Upgrade to Pro — share decks privately, control downloads, hide ads and more …

Rocky Road to Big Data analytics

Rocky Road to Big Data analytics

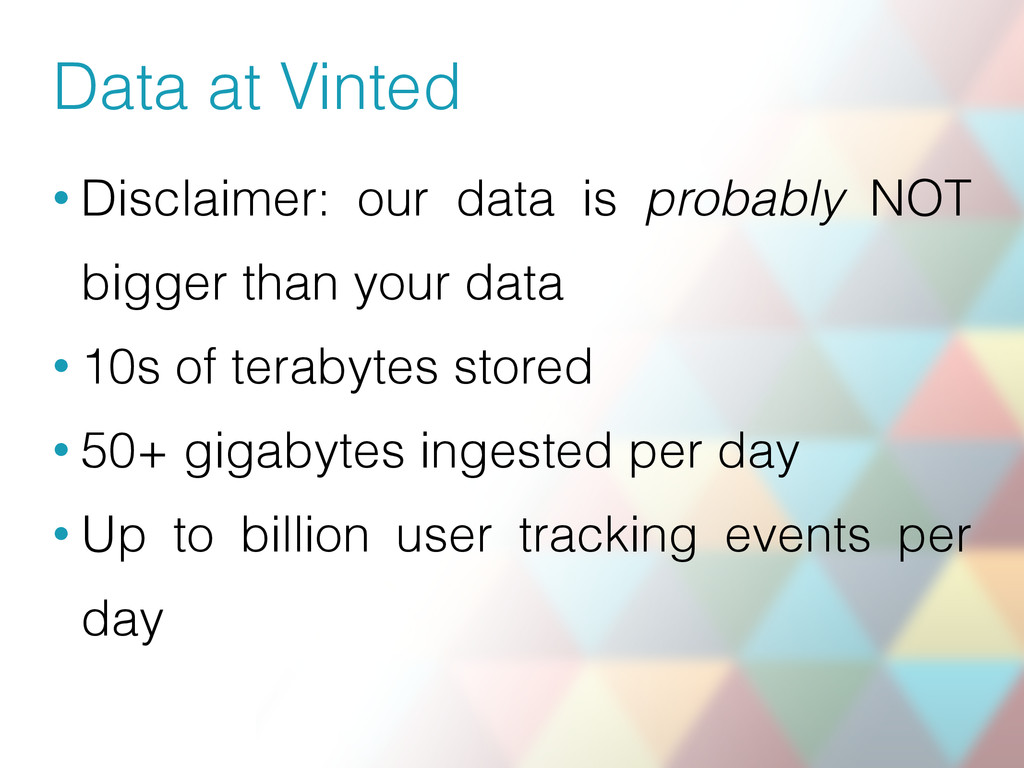
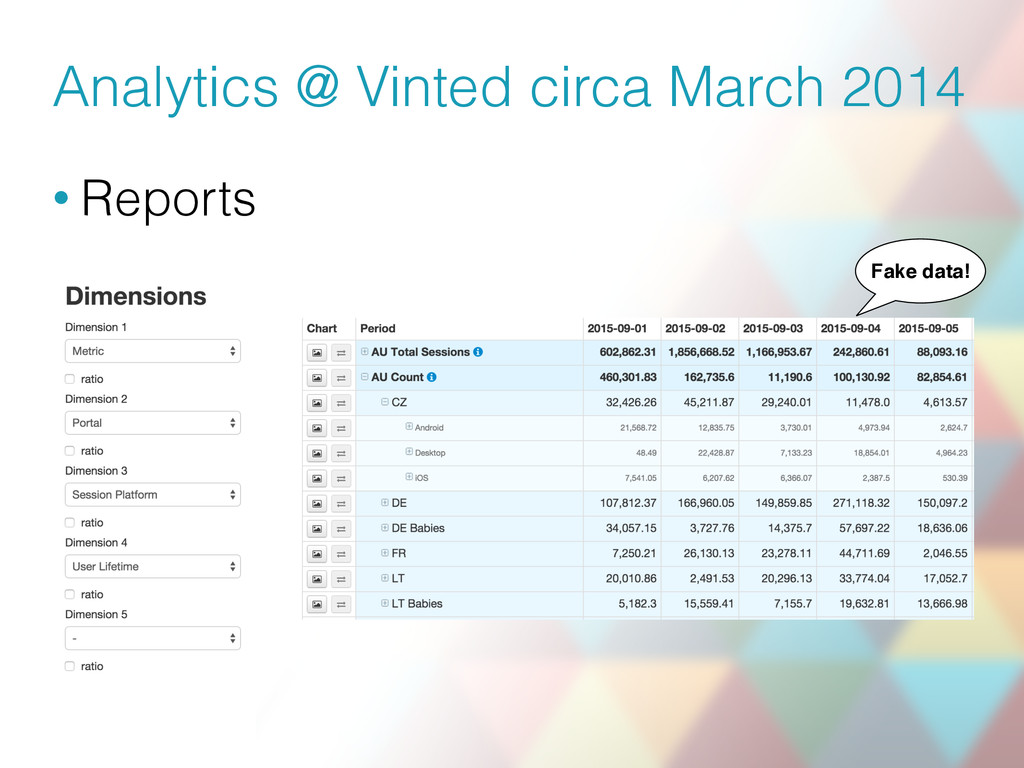
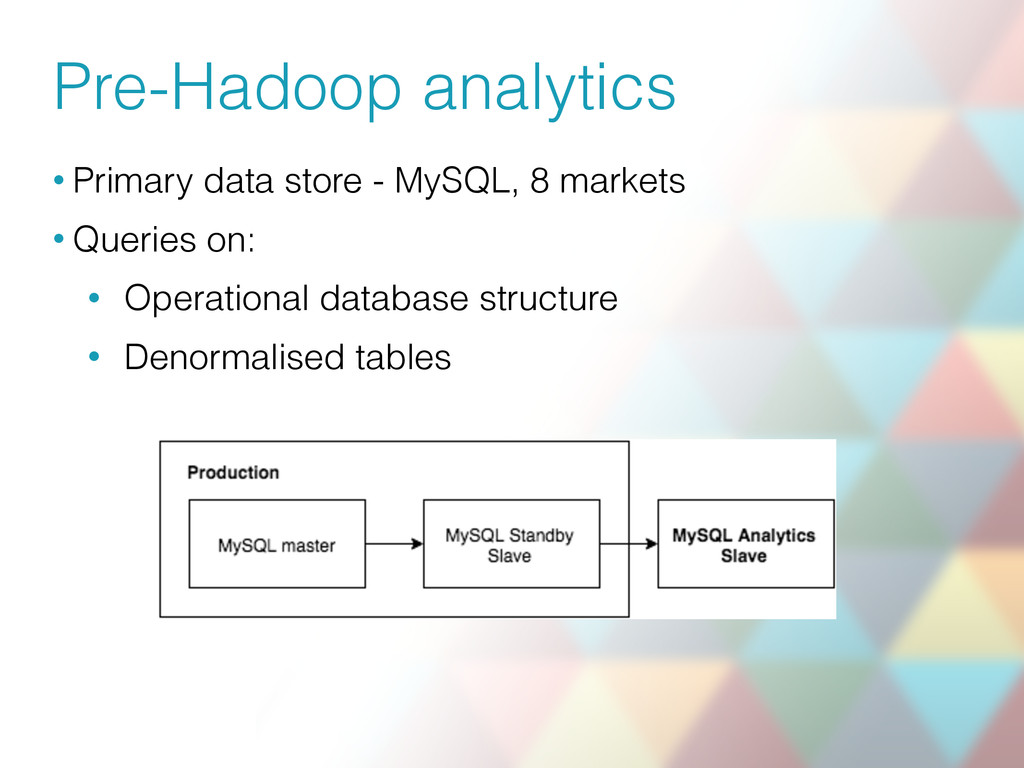
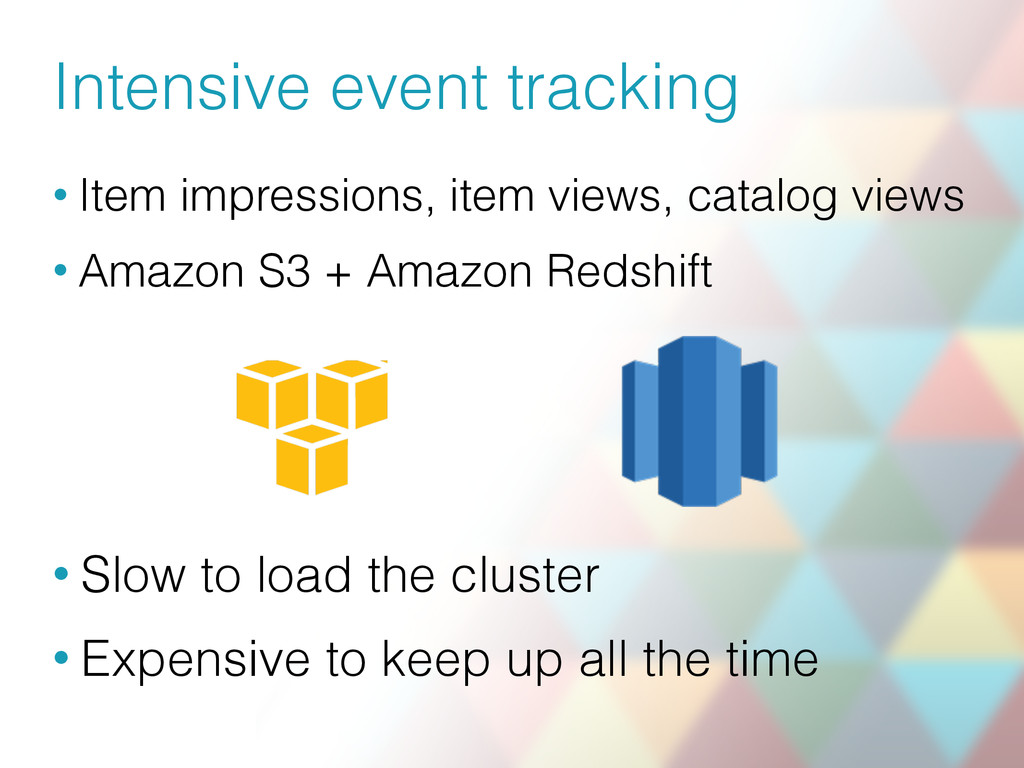
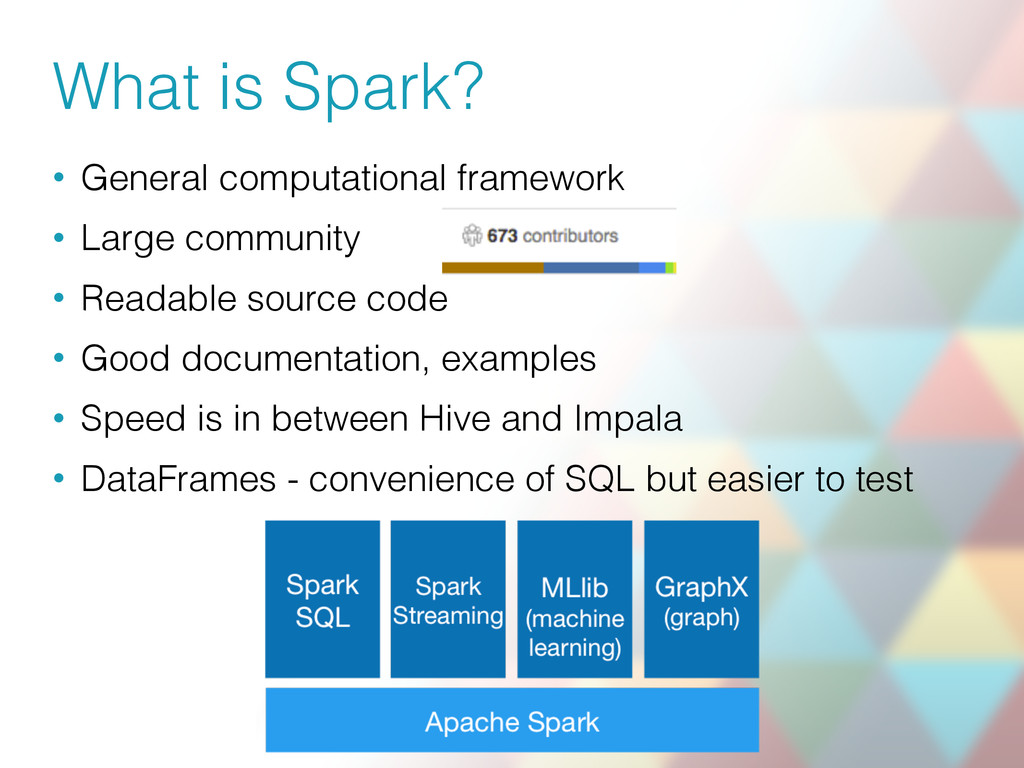
Vinted is an online lifestyle marketplace and a social network geared towards young women. We currently have 10 million members and we process and analyze up to 1 billion events daily. To overcome the limitations imposed by the implementation of our initial analytics solution based on MySQL, we evaluated Hive, Impala and Scalding, finally arriving at a solution built on Spark, Kafka and HBase.

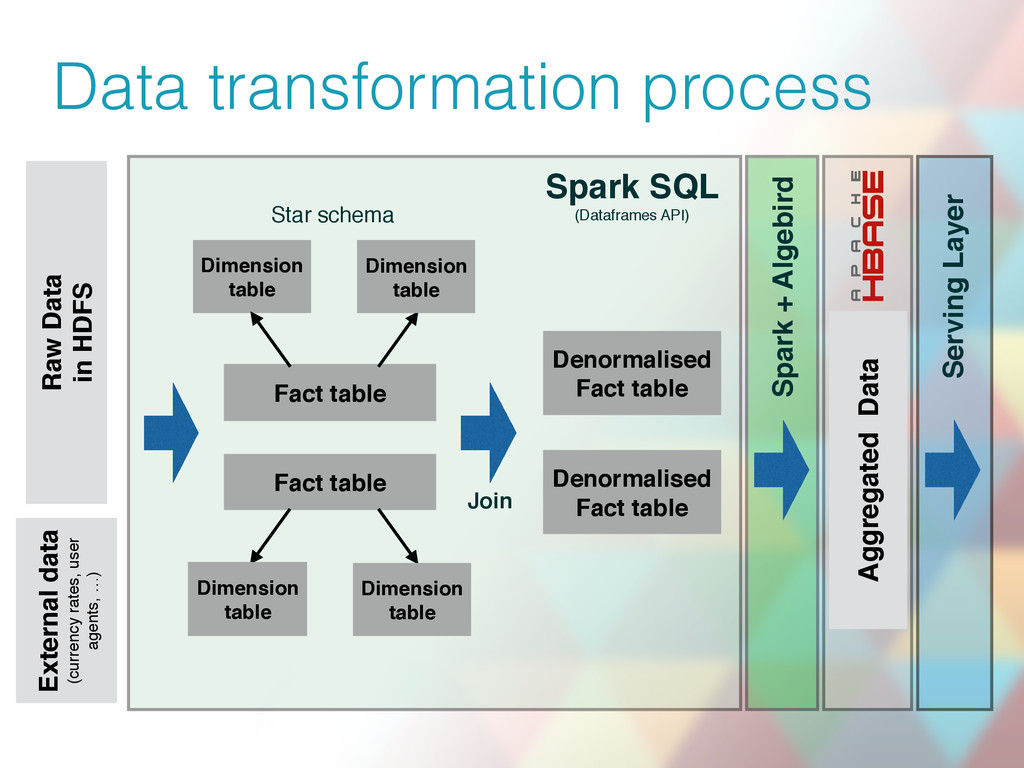
This is a lessons-learnt talk about our bumpy road to Big Data analytics on the Hadoop platform. We will cover our Kafka-based data ingestion pipeline, fact table preparation, data aggregation and talk about how all of this leads to a sub-second slicing of pre-aggregated data cubes. In addition, we will mention how our pipeline is reused for ad-hoc data analysis with the help of interactive notebooks.

Saulius Grigaliunas

October 05, 2015
Tweet

More Decks by Saulius Grigaliunas

Other Decks in Programming

Transcript

  1. Agenda • Analytics @ Vinted in pre-Hadoop era • Getting

    data into Hadoop • Analytics with Hadoop • Concluding remarks
  2. Make secondhand the first choice worldwide • 8 countries •

    10 million members • 11 000 new members / day • 20+ million listed items • 90 new items / minute
  3. Data at Vinted • Disclaimer: our data is probably NOT

    bigger than your data • 10s of terabytes stored • 50+ gigabytes ingested per day • Up to billion user tracking events per day
  4. Pre-Hadoop analytics • Primary data store - MySQL, 8 markets

    • Queries on: • Operational database structure • Denormalised tables
  5. Language for writing reports • Custom Ruby on Rails application

    • Domain specific language for report building class ListingsReport < SqlPivotReport metrics listings: 'count(distinct i.id)' listers: 'count(distinct i.lister_id)' dimensions brand: ‘brand_title' max_dimension_depth 3 from 'items i' period_field 'i.created_at' end → SELECT count(distinct i.id) listings, count(distinct i.lister) listers, brand_title FROM items i WHERE i.created_at BETWEEN .. AND .. GROUP BY brand_title
  6. Tracking user events • MySQL as a tracking event store

    CREATE TABLE `tracking_events`( `id` int(11) auto_increment, `event_type` int, `platform_id` int, `user_id` int, `created_at` datetime) CREATE TABLE `tracking_event_extras`( `id` int, `tracking_event_id`, `extra1` int, `extra2` int) + class TrackingEvent < ActiveRecord::Base EVENT_TYPES = { ‘session.start' => 1, ‘session.login' => 2, 'visit.start' => 10, ‘favourite.item.user_msg' => 50, ... # around 500 of these ... end
  7. Intensive event tracking • Item impressions, item views, catalog views

    • Amazon S3 + Amazon Redshift • Slow to load the cluster • Expensive to keep up all the time
  8. Pros and Cons • + Easy and fast to write

    new reports • - Reports run slowly • - Impacts operational database and the end user • - Cannot track and cheaply analyse a lot of data • - Hard to reuse dimension definitions • - Additional layer of knowledge (e.g event type IDs)
  9. Business requirements • Fast insights • Rich reporting: OLAP style

    slicing, funnels, cohorts, retention tracking • Should not affect product development speed • Extendable with possibility to contribute back to the product • Collaborative filtering • Improving search results and feed
  10. Requirements for a new system • Scalable • Fast to

    query • Testable • Easily deployable • Simple
  11. Hadoop stack • Cloudera's CDH distribution • Components: Hive, Impala,

    Oozie, Sqoop, Hue • Managed by Chef • 10-40 servers • 4 engineers • Github for code changes
  12. Getting data into Hadoop • Data from operational database imported

    with Apache Sqoop • 900GB daily • 720 tables from 8 MySQL replicas • Lots of effort to tame Sqoop • Streaming MySQL replication service in pre- production state
  13. Tracking user data 1: Schema registry • Avro for serialisation.

    JSON, Hive table schemas • Event schema store service
  14. Tracking user data 2: Kafka • Kafka - high throughput

    persistent commit log • Distributed: partitions messages across multiple nodes • Reliable: messages replicated across multiple nodes • Persistent: all messages are persisted to disk
  15. Tracking user data 3: Camus • Kafka to HDFS bridge

    • Map-Reduce job • Extended with additional ETL steps via Cloudera Kite Morphlines • Camus sweeper: periodic small file consolidation
  16. Hive + Impala • 1bn row scan • 24s in

    Impala • 46s in Hive • Feature-wise similar to MySQL (at the end of 2014) • Prepare denormalised fact tables with Hive • Aggregate with Impala on runtime • We can crunch all our data now!
  17. Data transformation process Fact table Raw Data in HDFS Fact

    table Dimension table Denormalised Fact table Denormalised Fact table Aggregated Data Dimension table Dimension table Dimension table Join Impala Hive Star schema
  18. However… • We had severe stability issues with Impala •

    Limited functionality at that time • Hard to extend with User Defined Functions (UDFs) • UDFs require separate code base • SQL is hard to test • Impala can’t read tables with complex types (Enum, Array, etc.) • String concatenation mess to arrive at the final SQL
 code
  19. • A Pipe in Scalding is a collection of transformations

    • Read data, pass to a Pipe, write output • No UDFs, just plain Scala functions • Unit tests (what is a unit of data transformation?) • Can run locally Data transformations in Scalding def firstVisit(viewScreenPipe: TypedPipe[ViewScreen]) = { viewScreenPipe .groupBy { v => (v.portal, v.anon_id) } .sortWithTake(1)(_.time < _.time) .values .flatten }
  20. val in = List(ViewScreen("a", "a", 10L, "a"), ViewScreen("a", "a", 5L,

    "b"), ViewScreen("a", "a", 1L, "b"), ViewScreen("a", "b", 2L, "b"), ViewScreen("a", "b", 5L, “b")) val firstEvent = List(in(2), in(3)) "An UserAgentsJob" should { "find first event" in { Operations.firstVisit(TypedPipe.from(in)) .toIterableExecution .waitFor(Config.default, Local(false)) .get.toList should contain theSameElementsAs firstEvent } } We have tests! Mock data Expected data Unit test
  21. However… • Getting anything but CSV files into Scalding was

    hard • Poor documentation • Hard to debug • Slow (ran on Map-Reduce) • High learning curve
  22. What is Spark? • General computational framework • Large community

    • Readable source code • Good documentation, examples • Speed is in between Hive and Impala • DataFrames - convenience of SQL but easier to test
  23. Data transformation process Fact table Raw Data in HDFS Fact

    table Dimension table Denormalised Fact table Denormalised Fact table Aggregated Data Dimension table Dimension table Dimension table Join Spark SQL (Dataframes API) Star schema External data (currency rates, user agents, …) Spark + Algebird Serving Layer
  24. Data input • Spark has data readers for most of

    the usual formats in Hadoop ecosystem • Connects directly to RDBMS through JDBC • Extendable
  25. Our data ingestion helpers def readCoreTables( name: String, portals: List[String],

    columns: List[String]) = { val tables = portals.map { portal => sqlCtx.readHiveTable("mysql_imports", s"${portal}__${name}") } tables.map(_.selectColumns(columns)).reduce(_ unionAll _) } • We have a number of helpers on top Spark data readers to: • Combine sharded data • Deduplicate • Custom data sampling strategies • Fix Sqoop related issues
  26. Custom functionality def seqContains = udf((seq: Seq[String], elem: String) =>

    seq.contains(elem) ) def isValidDate = udf((date: String) => Option(date).getOrElse("").isValidDate ) dataframe.filter(isValidDate($"created_at")) • Regular Scala functions wrapped in udf() • You can use lower level (RDD) api for complex functions • For example if state needs to be passed between rows
  27. Transformations • Dataframes API closely resembles regular
 SQL operations //

    Create a new DataFrame that contains “young users” only val young = users.filter($"age" < 21) // Increment everybody’s age by 1 young.select($"name", $"age" + 1) // Count the number of young users by gender young.groupBy($"gender").count // Join young users with another DataFrame called logs young.as("young").join(logs.as("logs"), $"young.userId" === $"logs.userId", "left_outer")
  28. Cubing class NewVisitorsCube(hiveCtx: HiveContext) extends Cube { val maxRollupDepth: Int

    = 4 val dimensionNames = Set("portal", "first_visit_platform") val metrics = MapAggregator( metric( id = "new_visitors", aggregator = Aggregator.size ) ) def facts = FirstAnonVisitEnrichedFact.read(hiveCtx) } • Cubing is done with the help of Algebird library • All metrics calculated in one pass over the data • Aggregated data is pushed to HBase
  29. Testing • Unit tests for reusable functionality • Integration tests

    for data transformations • REPL for prototyping and debugging • Sampled workflow test on production data • Can be run locally
  30. Integration tests with Cucumber Feature: Listing enriched fact generation Background:

    Given inline table "facts.listing" | String | String | Integer | Integer | Float | | local_time | portal | user_id | brand_id | listing_price_local | | 2014-01-02 | us | 2 | 101 | 10.0 | | 2014-01-01 | lt | 1 | 102 | 1.0 | When "vinted.warehouse.jobs.enrichedfacts.ListingEnrichedFact" job is run Then result table "enriched_facts.listing" includes the following rows | String | Integer | Float | | portal | brand_id | listing_price_local | | lt | 102 | 1.0 | | us | 101 | 10.0 | And result table "enriched_facts.listing" contains dimensions | item | | user temporal | And result table "enriched_facts.listing" contains cohorts | first_listing | And result table is valid input for "cubes.ListingsCube" cube
  31. Spark pros/cons • Fast (although not the fastest) • Easy

    to extend • Easy to test • Easy data IO • Moderate learning curve • Growing ecosystem of Spark packages • Configuration requires effort, sometimes is job specific • Hard to debug • Hard to optimise
  32. Zeppelin • Pros • Dashboards • Easy to use for

    SQL only • Nice out of the box visualisation capabilities • Cons • Crashes once a day usually • Hard to use in multi user environment • Most useful for quick data digging and ad-hoc BI tasks. Spark Notebook • Pros • Context, dependancies configurable per notebook • Stable • Support available on Gitter • Cons • More involved setup • Scala only • Targeted more at developers/ data scientists
  33. Job deployment • Continuous integration - Jenkins + Ruby +

    Oozie • Sampled workflow before production • Catch bugs early
  34. Achievements • Fast queries for data • Unified and explicit

    tracking event definitions • Explicit fact and dimension definitions • Minimised errors due to job testing, continuous integration and sampled workflow runs
  35. Lessons learnt • Invest in research time • Coding solutions

    yourself as a last resort for small teams • Try to avoid bleeding-edge releases • Invest in testing and automation
  36. What’s next? • Simplified, more approachable fact and dimension generation

    • Tracking event auditing and monitoring • Aggregation during query time • Replace Oozie and Sqoop