Upgrade to Pro — share decks privately, control downloads, hide ads and more …

Leveraging the Beautiful D3 Visualizations within your Sencha Applications by Gautam Argawal

Lee Boonstra
September 26, 2016

Leveraging the Beautiful D3 Visualizations within your Sencha Applications by Gautam Argawal

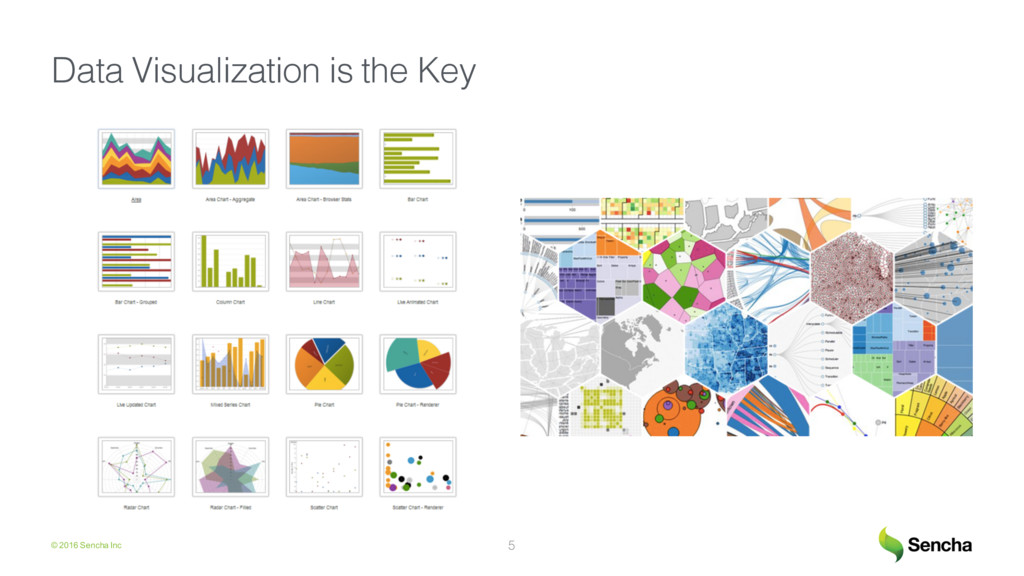
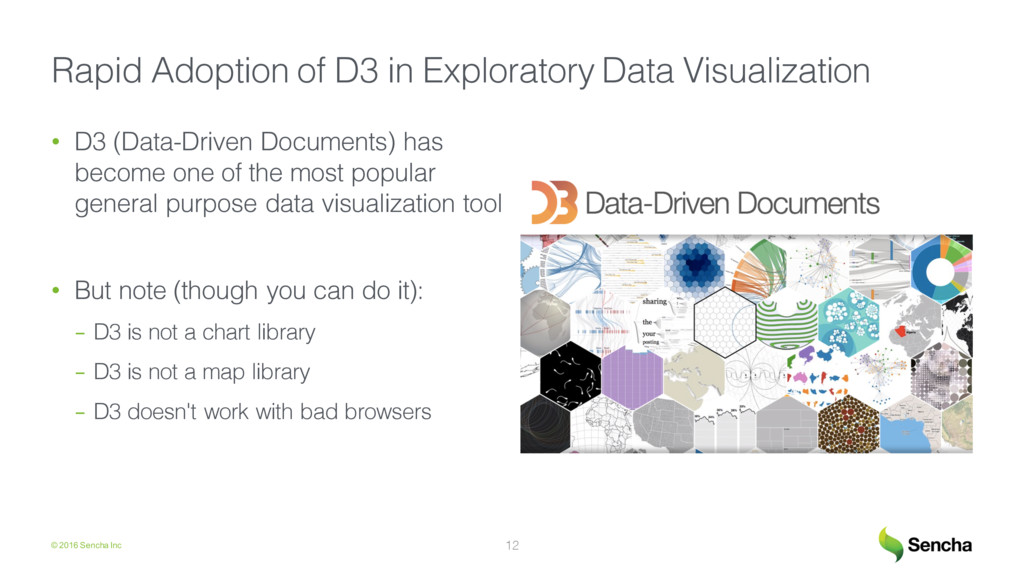
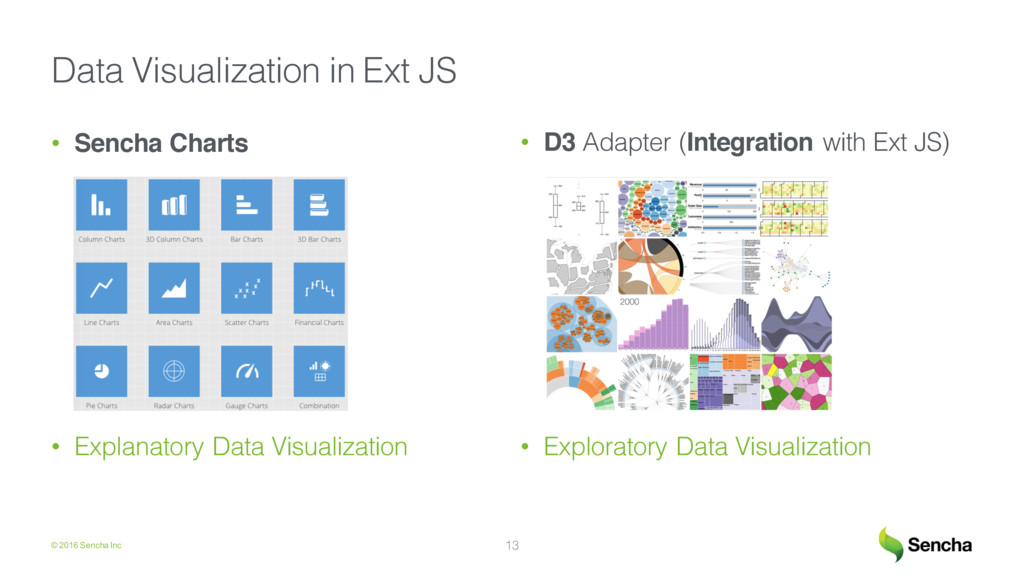
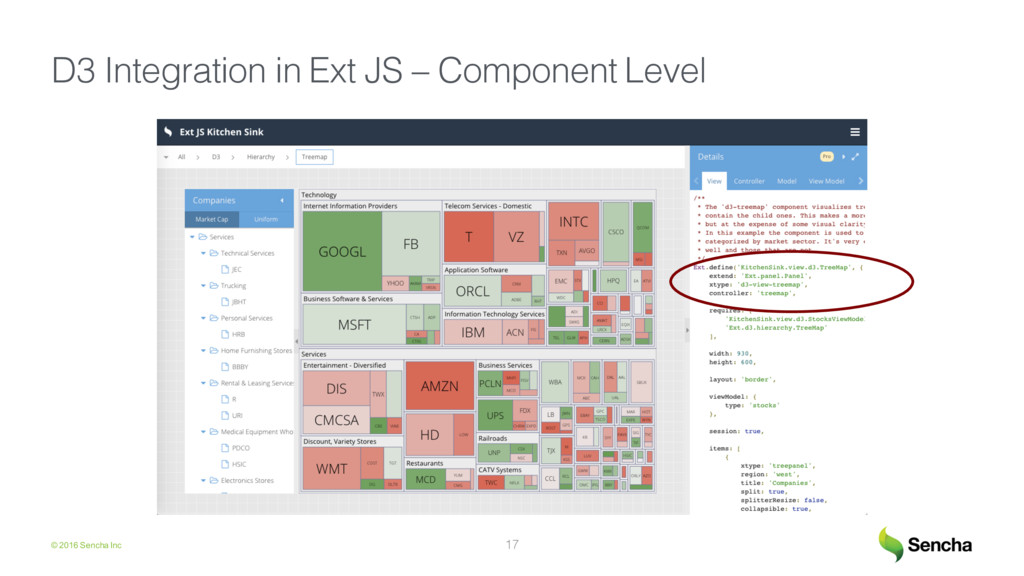
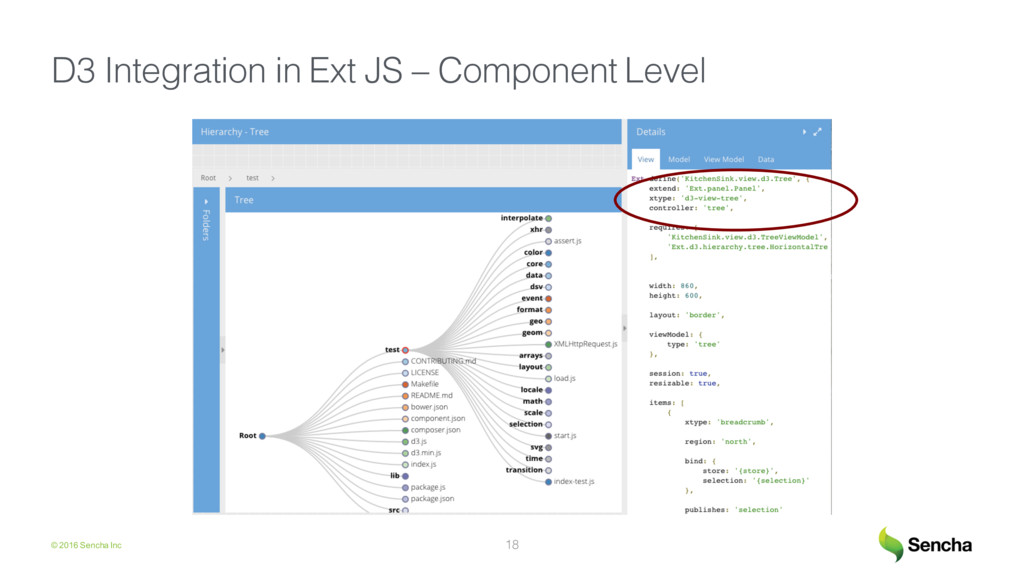
Learn how you can add powerful D3 visualizations to your Ext JS applications by using our new D3 adapter available in Ext JS 6.2. With the D3 adapter, you can now empower your users to navigate and explore large and complex datasets using visual representations that are intuitive to understand.

Lee Boonstra

September 26, 2016
Tweet

More Decks by Lee Boonstra

Other Decks in Technology

Transcript

  1. © 2016 Sencha Inc Leveraging the Beautiful D3 Visualizations within

    your Sencha Applications Gautam Agrawal Sr. Director, Product Management
  2. © 2016 Sencha Inc Growth in data “The rate at

    which we're generating data is rapidly outpacing our ability to analyze it.” Professor Patrick Wolfe, Big Data Institute 2
  3. © 2016 Sencha Inc Some Mind Blowing Stats • More

    than 90% of the data in the world was created in just last 2 years. • We sent astronauts to moon in 1969 on an infinitesimal fraction of the data we have in our everyday products. 1 MacBook Air = 2 Million Space Trips. • By 2020, digital knowledge is expected to equal 44 Zettabytes, up from 4.4 Zettabytes today. • 1 GB = 960 minutes of music, 1 ZB = 2 Billion minutes of music. 3
  4. © 2016 Sencha Inc Today, we’re drowning in data 99.5%

    of the data in the world hasn’t even been looked at… 4
  5. © 2016 Sencha Inc Two Basic Types of Data Visualization

    • Explanatory - Turn large quantities of data into information - Present data coherently with intuitive sense - Tell a story to an audience • Exploratory - Discern the relationships in the data - Find the story that data is telling 6
  6. © 2016 Sencha Inc Data Visualization – Explanatory You are

    using Data Visualization as an effective means to communicate the story. 7
  7. © 2016 Sencha Inc Data Visualization – Explanatory • Tabular

    Displays - Fairly pervasive - Only effective with limited number of rows and columns • Tips for using tables a.k.a. grid when telling a story - Show only the most vital columns - Scroll in a single direction 8
  8. © 2016 Sencha Inc Data Visualization – Explanatory • Charts

    & Graphs - Provide more effective explanations - Add the much needed intuitiveness • Tips for using charts and graphs when telling a story - Inappropriate choices distort reality - Proportional axis scaling 9
  9. © 2016 Sencha Inc Data Visualization – Exploratory You are

    using Data Visualization as a tool to understand the story behind your data. 10
  10. © 2016 Sencha Inc Data Visualization – Exploratory • You

    are exploring the story - Hundreds of columns, thousands of rows - Unknown relationships • Identify patterns and relationships that are not obvious 11
  11. © 2016 Sencha Inc Rapid Adoption of D3 in Exploratory

    Data Visualization 12 • D3 (Data-Driven Documents) has become one of the most popular general purpose data visualization tool • But note (though you can do it): - D3 is not a chart library - D3 is not a map library - D3 doesn't work with bad browsers
  12. © 2016 Sencha Inc Data Visualization in Ext JS •

    Sencha Charts • Explanatory Data Visualization • D3 Adapter (Integration with Ext JS) • Exploratory Data Visualization 13