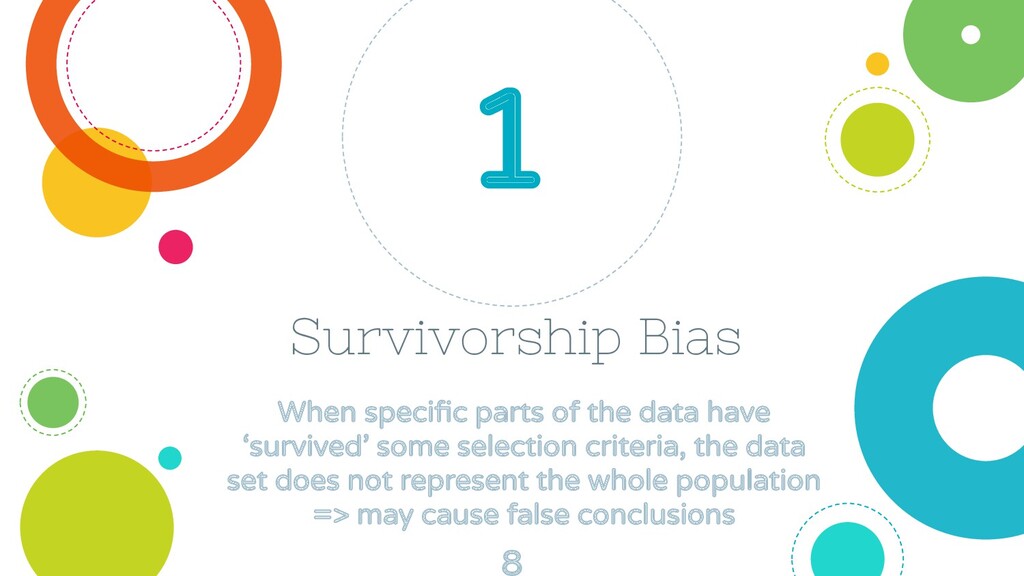
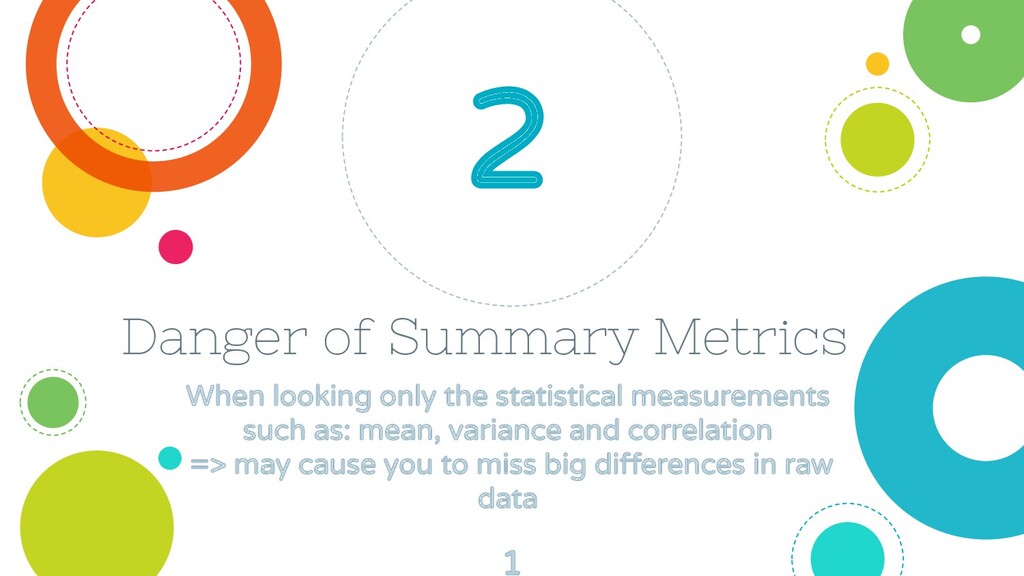
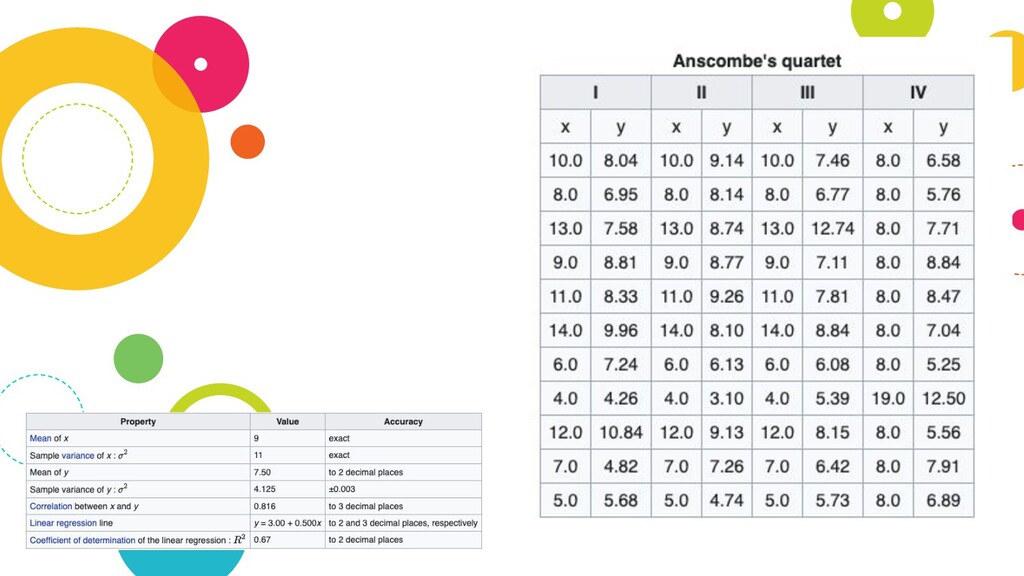
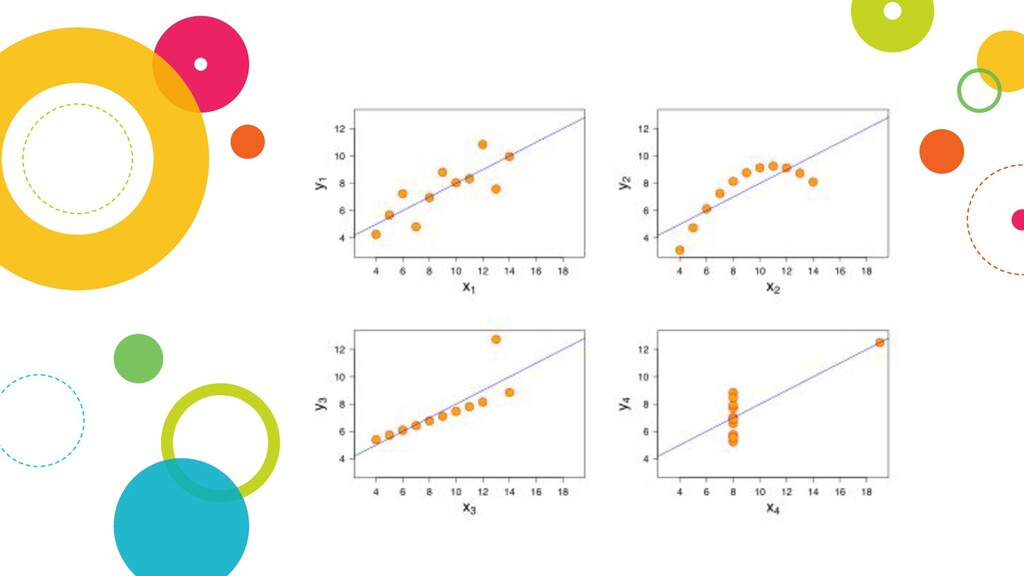
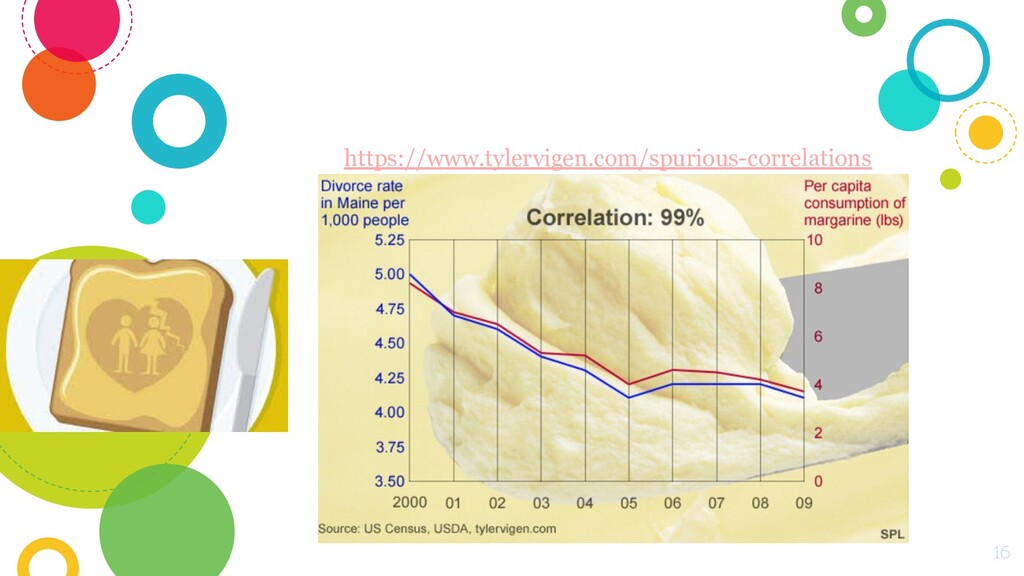
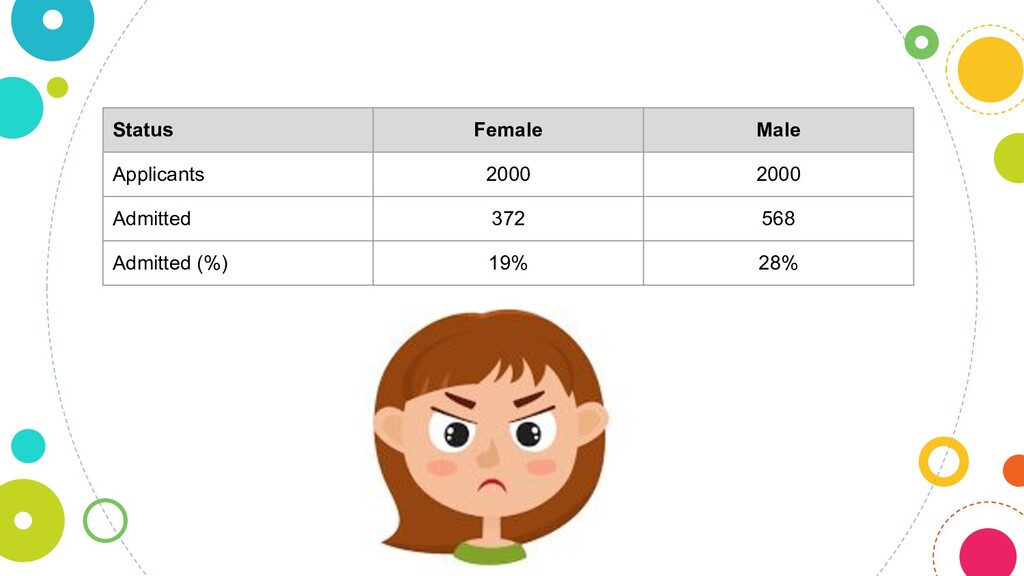
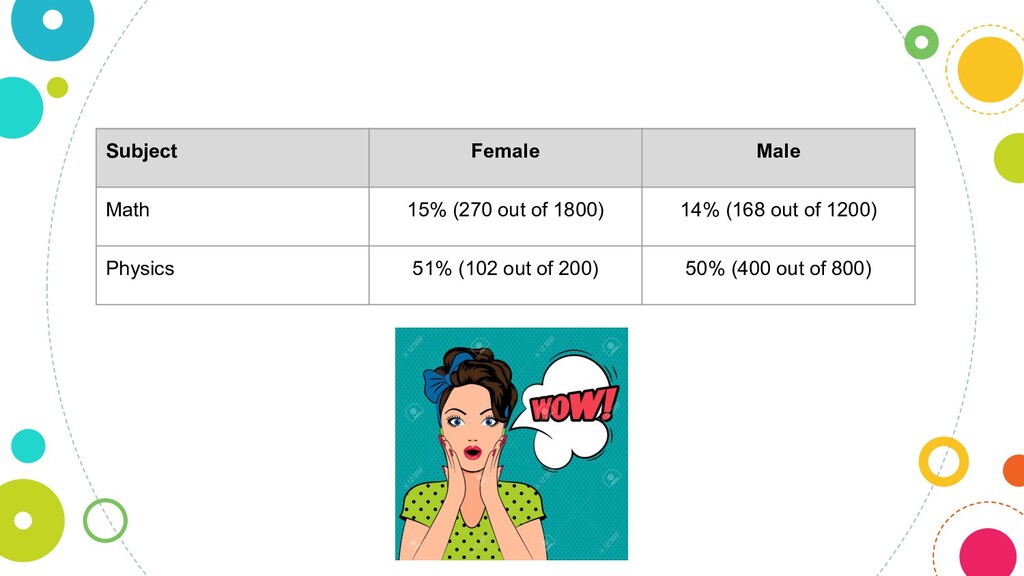
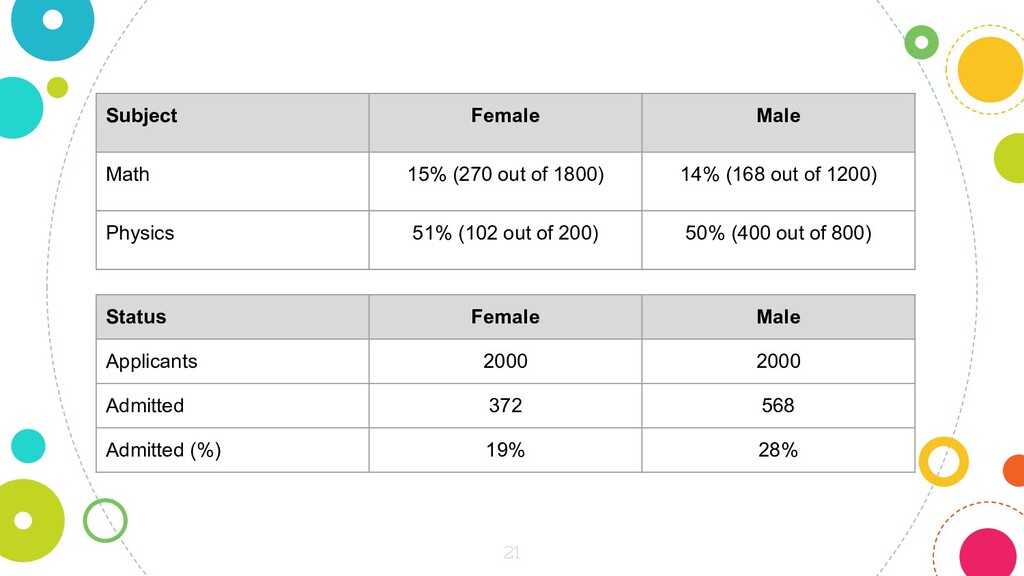
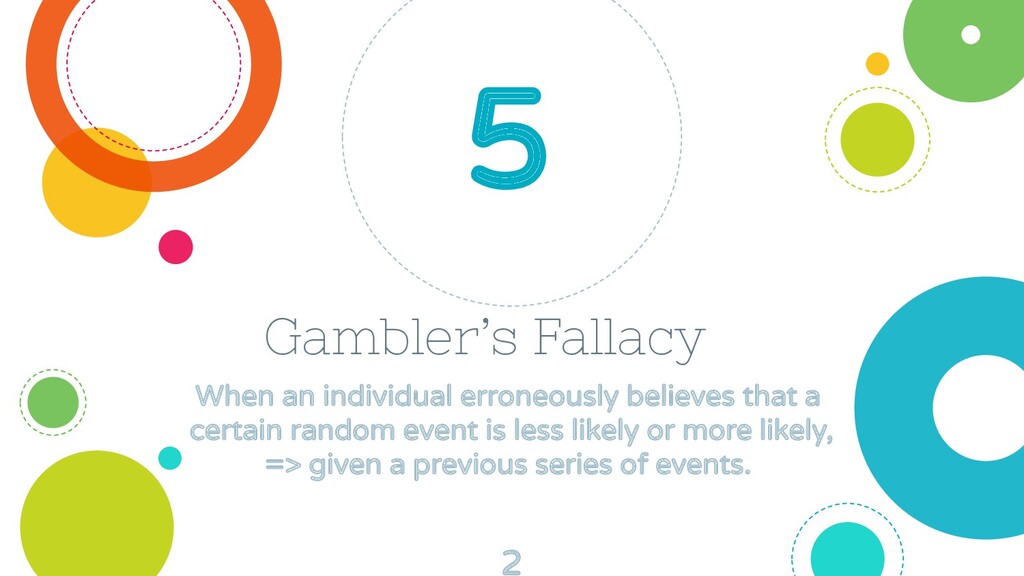
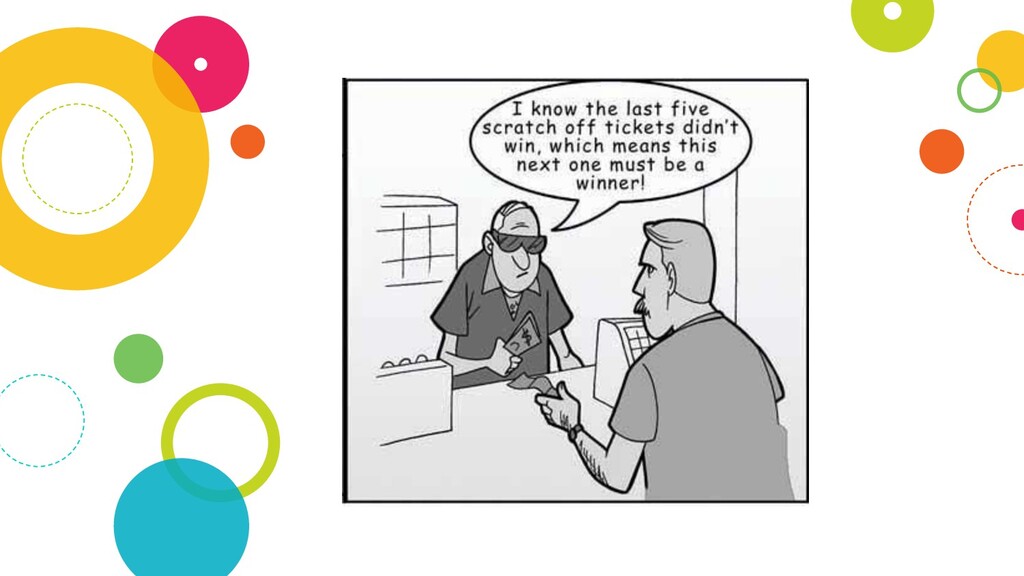
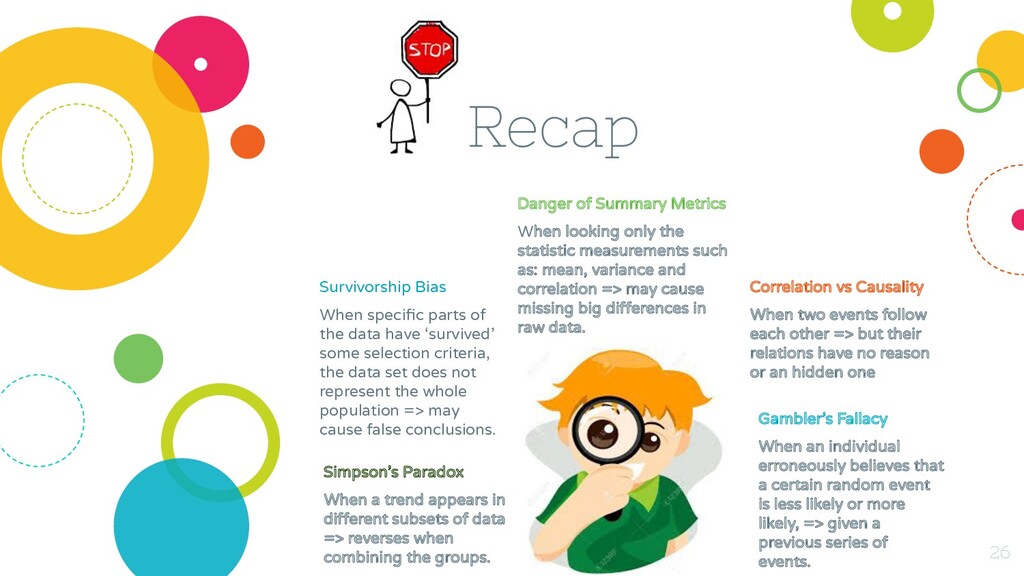
some selection criteria, the data set does not represent the whole population => may cause false conclusions. Danger of Summary Metrics When looking only the statistic measurements such as: mean, variance and correlation => may cause missing big differences in raw data. Simpson’s Paradox When a trend appears in different subsets of data => reverses when combining the groups. Correlation vs Causality When two events follow each other => but their relations have no reason or an hidden one Gambler’s Fallacy When an individual erroneously believes that a certain random event is less likely or more likely, => given a previous series of events. 26 Recap
blind spots. Yes! How we code matters Factoring fairness and think about ethics Why we code matters Social change should be a priority and not after thought 35 Can we change it?
![Thanks! Any questions? You can find me at https://shiran.tips/ [email protected]](https://files.speakerdeck.com/presentations/e980bf864ce64e5580c0359680204c69/slide_35.jpg)