Upgrade to Pro — share decks privately, control downloads, hide ads and more …

Intro to Data Analysis

shirankrasnov
September 20, 2019

Intro to Data Analysis

Intro into the day to day job of a Data Analyst.

* The Big Data Problem
* KPI's
* SaaS metrics (AARRR)
* Data pitfalls

shirankrasnov

September 20, 2019
Tweet

More Decks by shirankrasnov

Other Decks in Business

Transcript

  1. Hello! I am Shiran Krasnov Data Analyst at Ex Libris.

    You can find me at: [email protected] Shiran Krasnov Shiran Zakaim Krasnov 2
  2. “ Data is the oil of the 21st Century, Analytics

    is the engine Virginia Rometty, CEO, IBM, 2013.
  3. The big data problem With so much data to sort

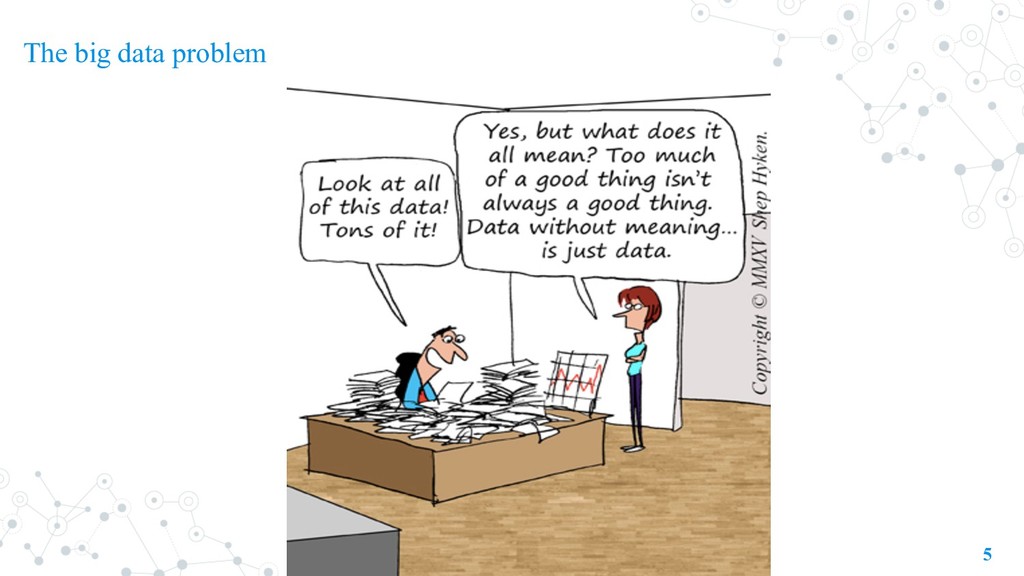
    through, you need something more from your data: ◎ You need to know it is the right data for answering your question; ◎ You need to draw accurate conclusions from that data; and ◎ You need data that informs your decision making process In short, you need better data analysis. 6
  4. What is Data Analysis? Data Analysis is the process of

    turning information into actionable insights. 7
  5. 8

  6. 9

  7. KPI - Key Performance Indicator A Key Performance Indicator is

    a measurable value that demonstrates how effectively a company is achieving key business objectives. 10
  8. 11 Some examples: ◎ Airbnb’s photos per month. ◎ Facebook’s

    Like experiment - comments to likes ratio. ◎ Wix - new registered users. KPI - Key Performance Indicator
  9. KPI - Key Performance Indicator 12 A good KPI is:

    ◎ Quantitative ◎ Comparative ◎ Understandable ◎ A Ratio or a Rate ◎ Behavior changing
  10. 13

  11. 15 Acquisition – How users find you? CAC Customer acquisition

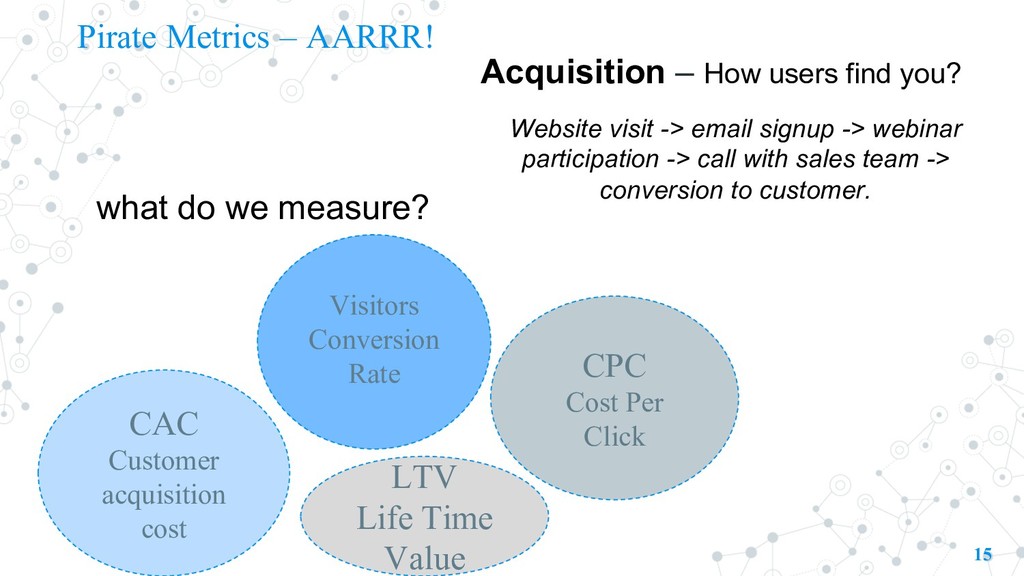
    cost Visitors Conversion Rate CPC Cost Per Click Pirate Metrics – AARRR! LTV Life Time Value what do we measure? Website visit -> email signup -> webinar participation -> call with sales team -> conversion to customer.
  12. 16 Activation – Do users use your product? what do

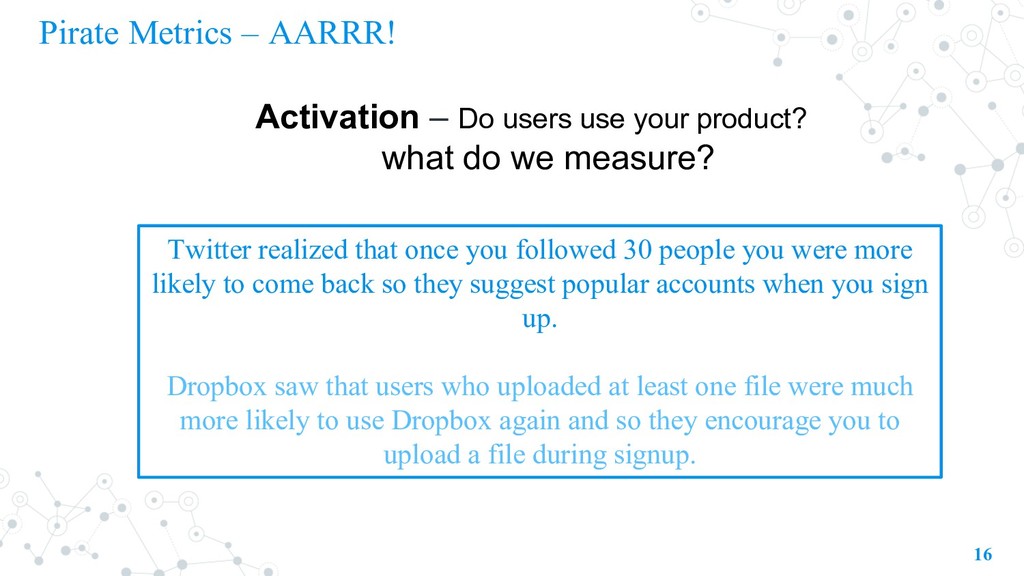
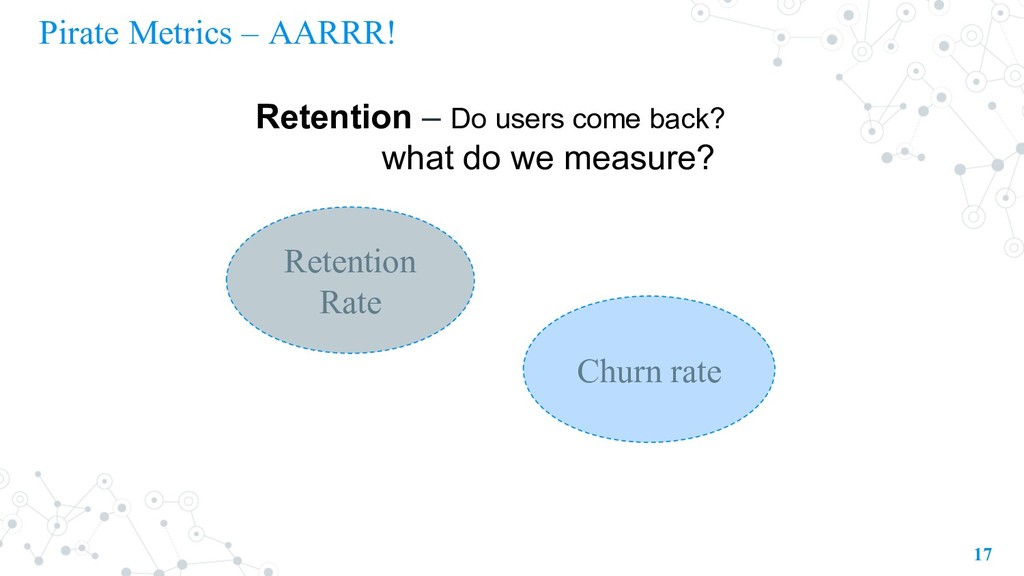
    we measure? Pirate Metrics – AARRR! Twitter realized that once you followed 30 people you were more likely to come back so they suggest popular accounts when you sign up. Dropbox saw that users who uploaded at least one file were much more likely to use Dropbox again and so they encourage you to upload a file during signup.
  13. 17 Retention – Do users come back? what do we

    measure? Churn rate Retention Rate Pirate Metrics – AARRR!
  14. 18 Referral – Do users bring other users? what do

    we measure? Pirate Metrics – AARRR!
  15. 19 Revenue – Are we making money? what do we

    measure? ARPU Average revenue per user MRR/ARR Monthly/ Annual Recurring Revenue Pirate Metrics – AARRR!
  16. KPIs summary 20 ◎ In order to understand your data,

    you must first understand your business ◎ Choose KPIs according to best practices, business model and priority. ◎ Keeping it lean and focused is an ongoing effort.
  17. Is DATA always the answer? No! Ø Lack of data

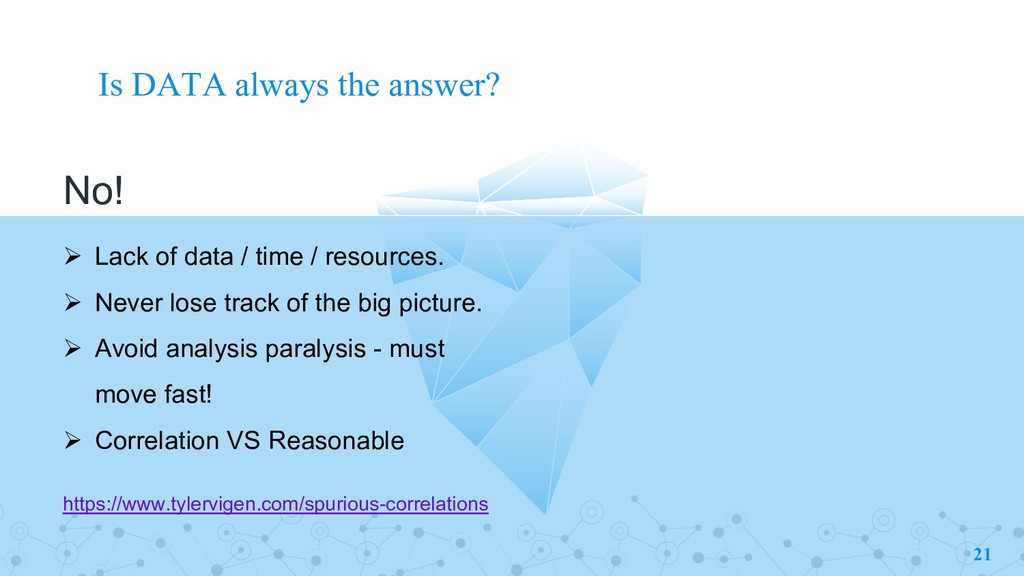
    / time / resources. Ø Never lose track of the big picture. Ø Avoid analysis paralysis - must move fast! Ø Correlation VS Reasonable https://www.tylervigen.com/spurious-correlations 21
  18. DATA pitfalls: ØAssume the data is clean. ØNot normalizing your

    data. ØIncluding/Excluding outliers. 22 ØIgnoring seasonality. ØIgnoring data you don’t collect/own.
  19. 23 So what do you need? ü Analytical thinking and

    abilities ü Excel high level ü SQL ü Python – an advantage