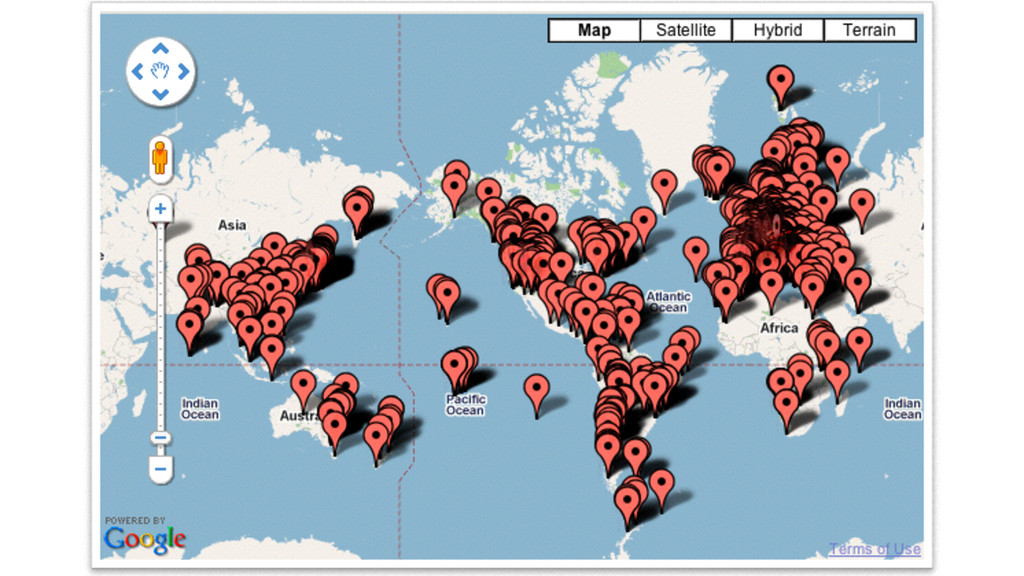
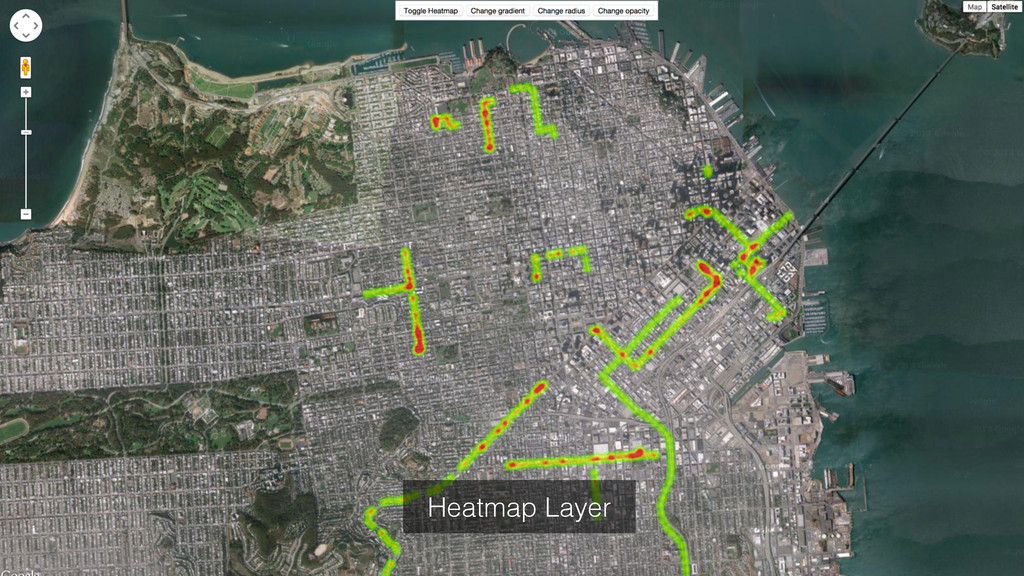
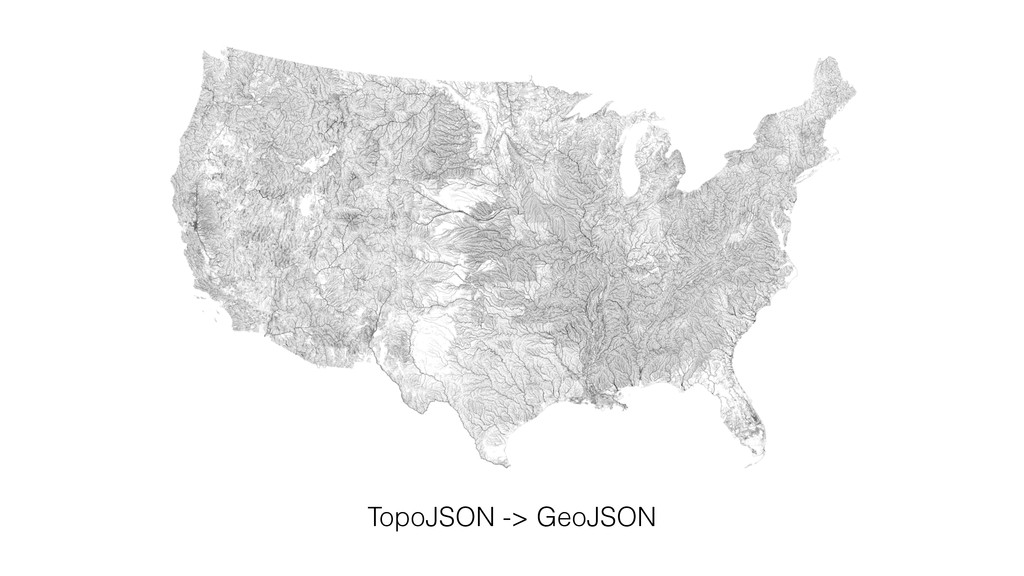
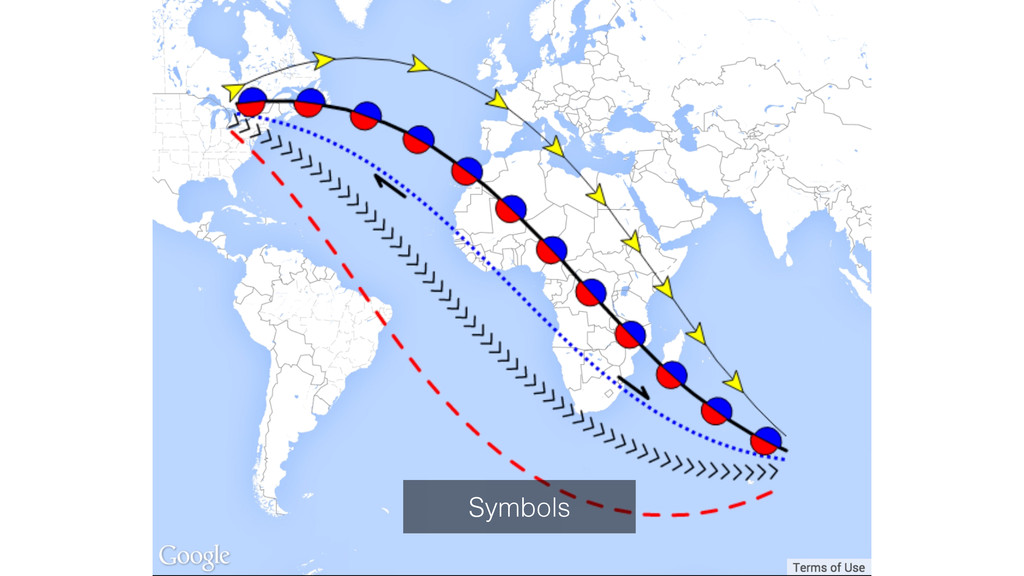
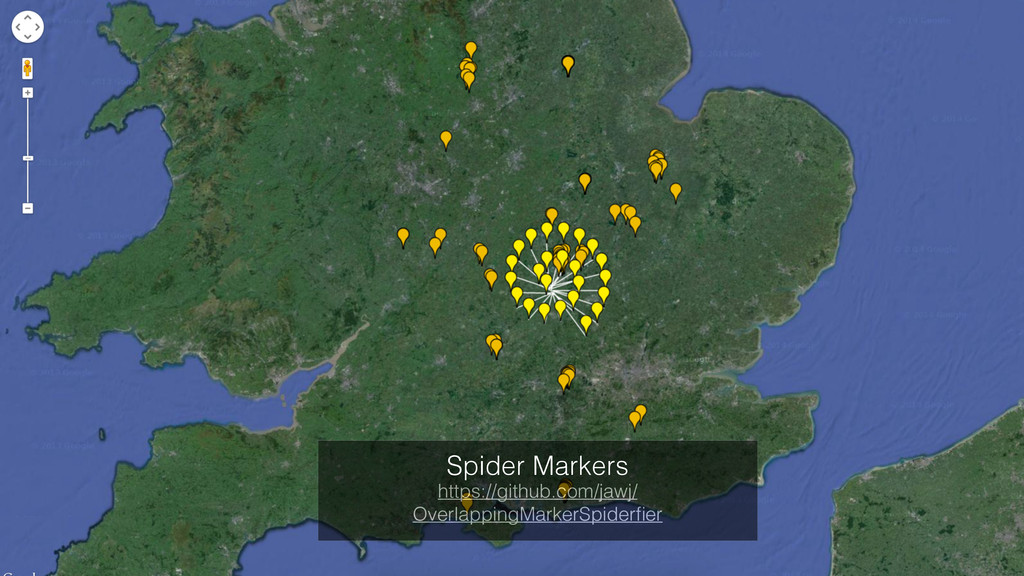
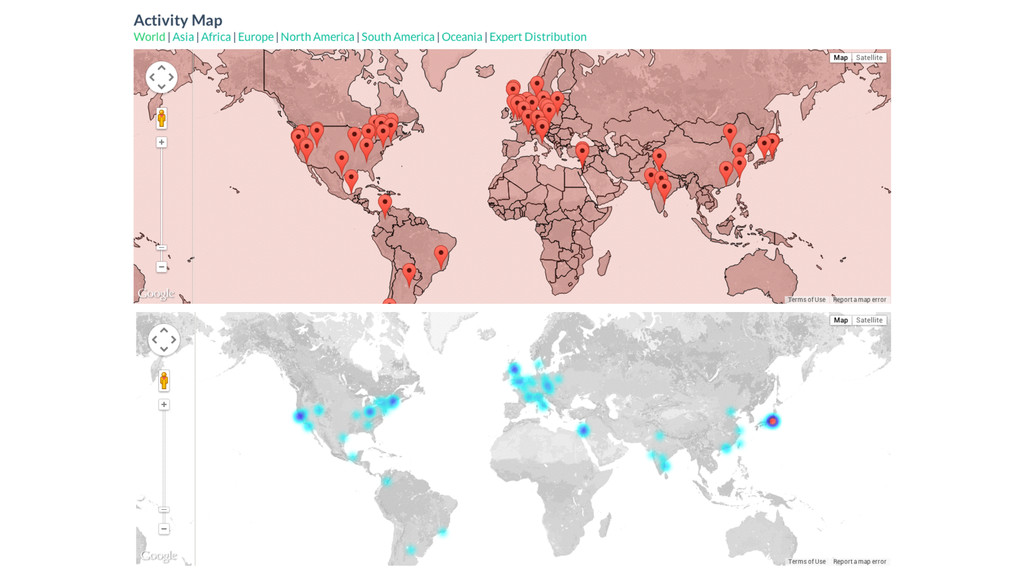
Talk I gave at Google DevFest London 2014 about using Google Maps Javascript API to visualise large sets of data. Don't just use a red pin. Make Maps Beautiful!
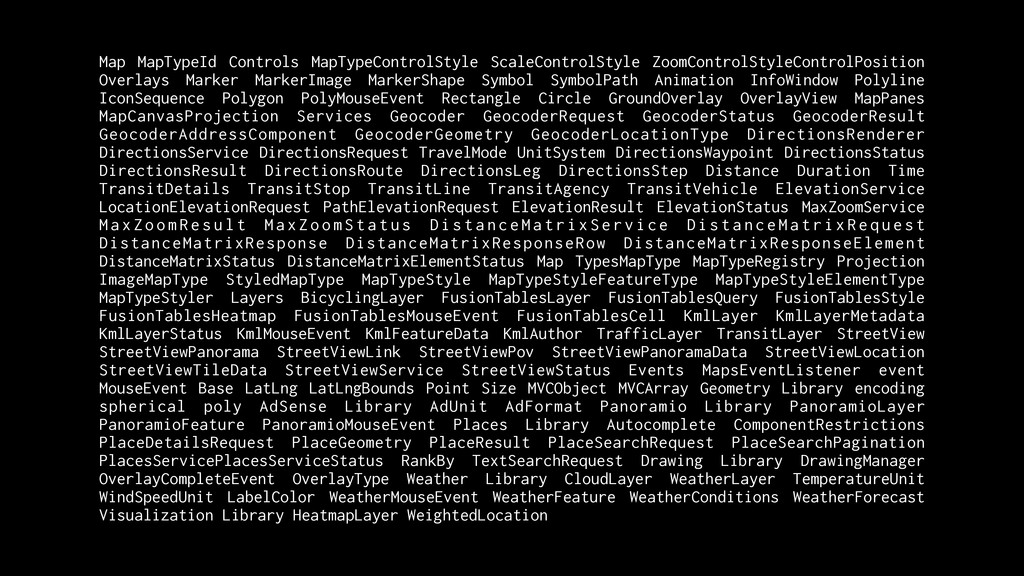
Symbol SymbolPath Animation InfoWindow Polyline IconSequence Polygon PolyMouseEvent Rectangle Circle GroundOverlay OverlayView MapPanes MapCanvasProjection Services Geocoder GeocoderRequest GeocoderStatus GeocoderResult GeocoderAddressComponent GeocoderGeometry GeocoderLocationType DirectionsRenderer DirectionsService DirectionsRequest TravelMode UnitSystem DirectionsWaypoint DirectionsStatus DirectionsResult DirectionsRoute DirectionsLeg DirectionsStep Distance Duration Time TransitDetails TransitStop TransitLine TransitAgency TransitVehicle ElevationService LocationElevationRequest PathElevationRequest ElevationResult ElevationStatus MaxZoomService M a x Z o o m R e s u l t M a x Z o o m S t a t u s D i s t a n c e M a t r i x S e r v i c e D i s t a n c e M a t r i x R e q u e s t DistanceMatrixResponse DistanceMatrixResponseRow DistanceMatrixResponseElement DistanceMatrixStatus DistanceMatrixElementStatus Map TypesMapType MapTypeRegistry Projection ImageMapType StyledMapType MapTypeStyle MapTypeStyleFeatureType MapTypeStyleElementType MapTypeStyler Layers BicyclingLayer FusionTablesLayer FusionTablesQuery FusionTablesStyle FusionTablesHeatmap FusionTablesMouseEvent FusionTablesCell KmlLayer KmlLayerMetadata KmlLayerStatus KmlMouseEvent KmlFeatureData KmlAuthor TrafficLayer TransitLayer StreetView StreetViewPanorama StreetViewLink StreetViewPov StreetViewPanoramaData StreetViewLocation StreetViewTileData StreetViewService StreetViewStatus Events MapsEventListener event MouseEvent Base LatLng LatLngBounds Point Size MVCObject MVCArray Geometry Library encoding spherical poly AdSense Library AdUnit AdFormat Panoramio Library PanoramioLayer PanoramioFeature PanoramioMouseEvent Places Library Autocomplete ComponentRestrictions PlaceDetailsRequest PlaceGeometry PlaceResult PlaceSearchRequest PlaceSearchPagination PlacesServicePlacesServiceStatus RankBy TextSearchRequest Drawing Library DrawingManager OverlayCompleteEvent OverlayType Weather Library CloudLayer WeatherLayer TemperatureUnit WindSpeedUnit LabelColor WeatherMouseEvent WeatherFeature WeatherConditions WeatherForecast Visualization Library HeatmapLayer WeightedLocation
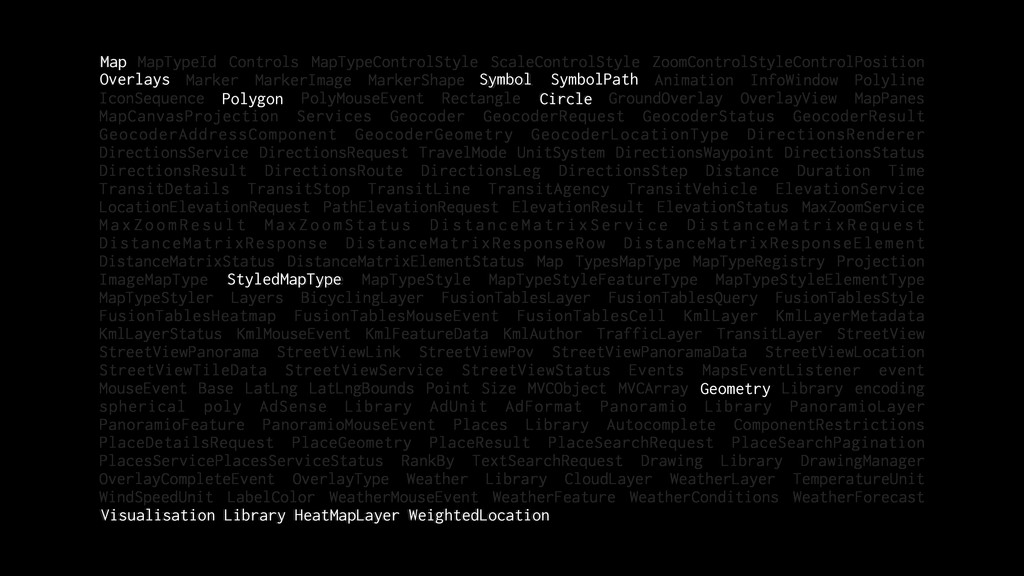
Symbol SymbolPath Animation InfoWindow Polyline IconSequence Polygon PolyMouseEvent Rectangle Circle GroundOverlay OverlayView MapPanes MapCanvasProjection Services Geocoder GeocoderRequest GeocoderStatus GeocoderResult GeocoderAddressComponent GeocoderGeometry GeocoderLocationType DirectionsRenderer DirectionsService DirectionsRequest TravelMode UnitSystem DirectionsWaypoint DirectionsStatus DirectionsResult DirectionsRoute DirectionsLeg DirectionsStep Distance Duration Time TransitDetails TransitStop TransitLine TransitAgency TransitVehicle ElevationService LocationElevationRequest PathElevationRequest ElevationResult ElevationStatus MaxZoomService M a x Z o o m R e s u l t M a x Z o o m S t a t u s D i s t a n c e M a t r i x S e r v i c e D i s t a n c e M a t r i x R e q u e s t DistanceMatrixResponse DistanceMatrixResponseRow DistanceMatrixResponseElement DistanceMatrixStatus DistanceMatrixElementStatus Map TypesMapType MapTypeRegistry Projection ImageMapType StyledMapType MapTypeStyle MapTypeStyleFeatureType MapTypeStyleElementType MapTypeStyler Layers BicyclingLayer FusionTablesLayer FusionTablesQuery FusionTablesStyle FusionTablesHeatmap FusionTablesMouseEvent FusionTablesCell KmlLayer KmlLayerMetadata KmlLayerStatus KmlMouseEvent KmlFeatureData KmlAuthor TrafficLayer TransitLayer StreetView StreetViewPanorama StreetViewLink StreetViewPov StreetViewPanoramaData StreetViewLocation StreetViewTileData StreetViewService StreetViewStatus Events MapsEventListener event MouseEvent Base LatLng LatLngBounds Point Size MVCObject MVCArray Geometry Library encoding spherical poly AdSense Library AdUnit AdFormat Panoramio Library PanoramioLayer PanoramioFeature PanoramioMouseEvent Places Library Autocomplete ComponentRestrictions PlaceDetailsRequest PlaceGeometry PlaceResult PlaceSearchRequest PlaceSearchPagination PlacesServicePlacesServiceStatus RankBy TextSearchRequest Drawing Library DrawingManager OverlayCompleteEvent OverlayType Weather Library CloudLayer WeatherLayer TemperatureUnit WindSpeedUnit LabelColor WeatherMouseEvent WeatherFeature WeatherConditions WeatherForecast Visualization Library HeatmapLayer WeightedLocation HeatMapLayer Visualisation Library Map Overlays Symbol SymbolPath Polygon Circle StyledMapType Geometry WeightedLocation
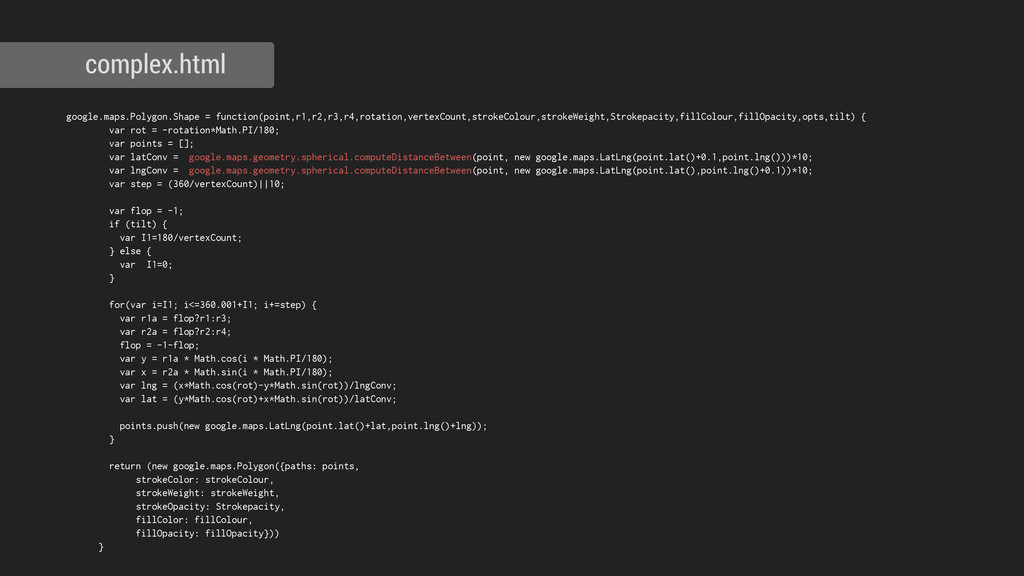
points = []; var latConv = google.maps.geometry.spherical.computeDistanceBetween(point, new google.maps.LatLng(point.lat()+0.1,point.lng()))*10; var lngConv = google.maps.geometry.spherical.computeDistanceBetween(point, new google.maps.LatLng(point.lat(),point.lng()+0.1))*10; var step = (360/vertexCount)||10; var flop = -1; if (tilt) { var I1=180/vertexCount; } else { var I1=0; } for(var i=I1; i<=360.001+I1; i+=step) { var r1a = flop?r1:r3; var r2a = flop?r2:r4; flop = -1-flop; var y = r1a * Math.cos(i * Math.PI/180); var x = r2a * Math.sin(i * Math.PI/180); var lng = (x*Math.cos(rot)-y*Math.sin(rot))/lngConv; var lat = (y*Math.cos(rot)+x*Math.sin(rot))/latConv; points.push(new google.maps.LatLng(point.lat()+lat,point.lng()+lng)); } return (new google.maps.Polygon({paths: points, strokeColor: strokeColour, strokeWeight: strokeWeight, strokeOpacity: Strokepacity, fillColor: fillColour, fillOpacity: fillOpacity})) }
![index.html map.data.addListener('mouseover', function(event) { map.data.revertStyle(); var lineColor = event.feature.getProperty('lines')[0].colour; map.data.overrideStyle(event.feature,](https://files.speakerdeck.com/presentations/ac58b4904f100132348e6661b83ad9a0/slide_41.jpg)
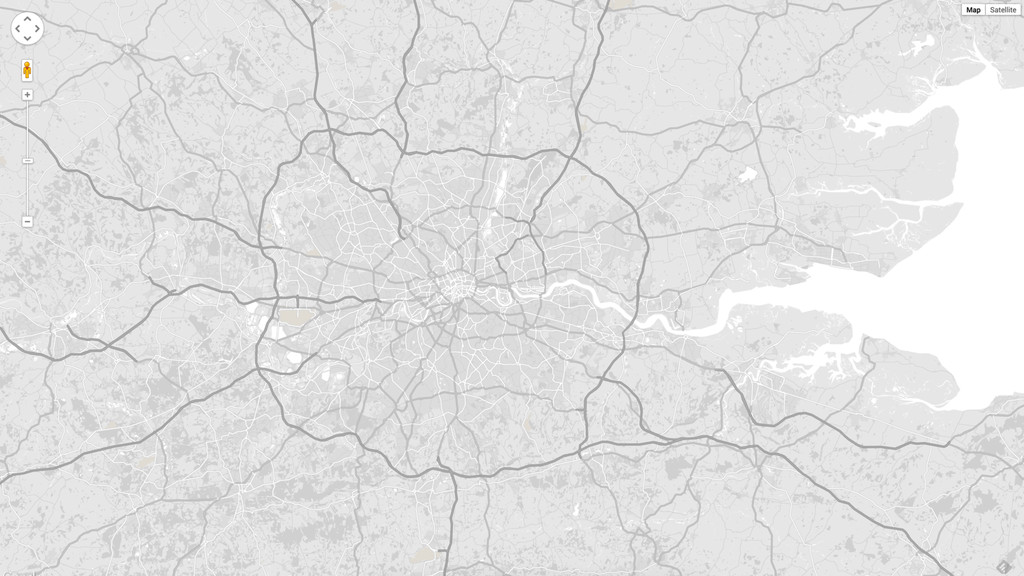
![index.html var grayStyles = [{"featureType":"water","elementType":"geometry","stylers":[{"color":"#000000"},{"lightness": 17}]},{"featureType":"landscape","elementType":"geometry","stylers":[{"color":"#000000"},{"lightness":20}]}, {"featureType":"road.highway","elementType":"geometry.fill","stylers":[{"color":"#000000"},{"lightness":17}]}, {"featureType":"road.highway","elementType":"geometry.stroke","stylers":[{"color":"#000000"},{"lightness":29}, {"weight":0.2}]},{"featureType":"road.arterial","elementType":"geometry","stylers":[{"color":"#000000"}, {"lightness":18}]},{"featureType":"road.local","elementType":"geometry","stylers":[{"color":"#000000"},](https://files.speakerdeck.com/presentations/ac58b4904f100132348e6661b83ad9a0/slide_51.jpg)
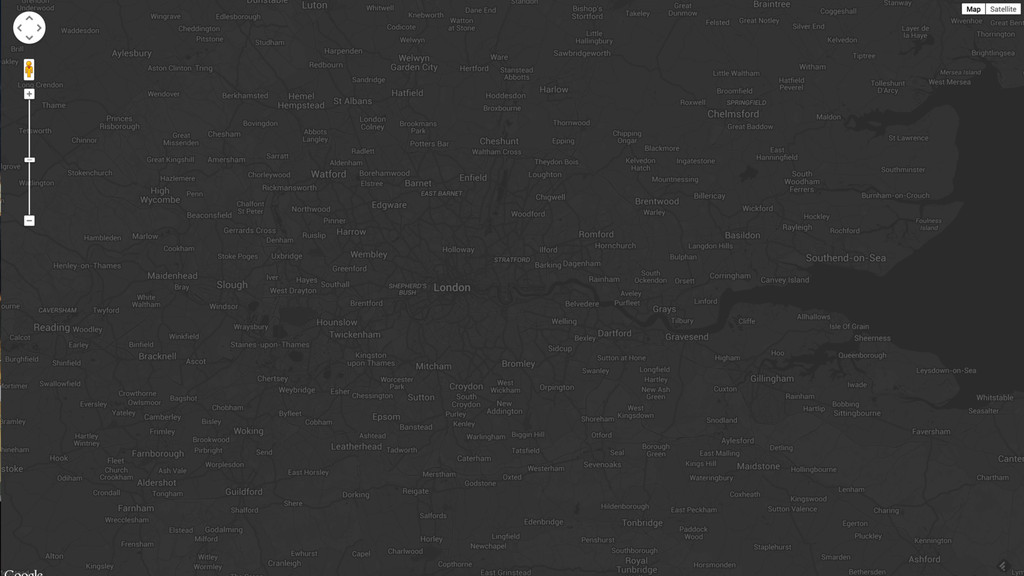
![index.html var mono = [{"featureType":"poi","elementType":"all","stylers":[{"hue":"#000000"},{"saturation":-100}, {"lightness":-100},{"visibility":"off"}]},{"featureType":"poi","elementType":"all","stylers":[{"hue":"#000000"}, {"saturation":-100},{"lightness":-100},{"visibility":"off"}]}, {"featureType":"administrative","elementType":"all","stylers":[{"hue":"#000000"},{"saturation":0}, {"lightness":-100},{"visibility":"off"}]},{"featureType":"road","elementType":"labels","stylers": [{"hue":"#ffffff"},{"saturation":-100},{"lightness":100},{"visibility":"off"}]},](https://files.speakerdeck.com/presentations/ac58b4904f100132348e6661b83ad9a0/slide_54.jpg)
![+StevenGray Thank you! #makemapsbeautiful [email protected] www.stevenjamesgray.com @frogo](https://files.speakerdeck.com/presentations/ac58b4904f100132348e6661b83ad9a0/slide_79.jpg)