Upgrade to Pro
— share decks privately, control downloads, hide ads and more …
Speaker Deck
Features
Speaker Deck
PRO
Sign in
Sign up for free
Search
Search
Troubleshooting Node.js
Search
Sponsored
·
Ship Features Fearlessly
Turn features on and off without deploys. Used by thousands of Ruby developers.
→
Igor Soarez
July 23, 2015
Programming
0
260
Troubleshooting Node.js
what to do when things go wrong
Igor Soarez
July 23, 2015
Tweet
Share
Other Decks in Programming
See All in Programming
What Spring Developers Should Know About Jakarta EE
ivargrimstad
0
640
安いハードウェアでVulkan
fadis
0
520
Redox OS でのネームスペース管理と chroot の実現
isanethen
0
250
The free-lunch guide to idea circularity
hollycummins
0
270
nuget-server - あなたが必要だったNuGetサーバー
kekyo
PRO
0
280
Windows on Ryzen and I
seosoft
0
320
メタプログラミングで実現する「コードを仕様にする」仕組み/nikkei-tech-talk43
nikkei_engineer_recruiting
0
200
Fundamentals of Software Engineering In the Age of AI
therealdanvega
2
260
今からFlash開発できるわけないじゃん、ムリムリ! (※ムリじゃなかった!?)
arkw
0
110
20260313 - Grafana & Friends Taipei #1 - Kubernetes v1.36 的開發雜記:那些困在 Alpha 加護病房太久的 Metrics
tico88612
0
220
Symfony + NelmioApiDocBundle を使った スキーマ駆動開発 / Schema Driven Development with NelmioApiDocBundle
okashoi
0
170
[PHPerKaigi 2026]PHPerKaigi2025の企画CodeGolfが最高すぎて社内で内製して半年運営して得た内製と運営の知見
ikezoemakoto
0
150
Featured
See All Featured
Public Speaking Without Barfing On Your Shoes - THAT 2023
reverentgeek
1
340
Reality Check: Gamification 10 Years Later
codingconduct
0
2.1k
Leveraging Curiosity to Care for An Aging Population
cassininazir
1
200
End of SEO as We Know It (SMX Advanced Version)
ipullrank
3
4.1k
The AI Search Optimization Roadmap by Aleyda Solis
aleyda
1
5.4k
What Being in a Rock Band Can Teach Us About Real World SEO
427marketing
0
190
Collaborative Software Design: How to facilitate domain modelling decisions
baasie
0
160
Optimizing for Happiness
mojombo
378
71k
The Illustrated Children's Guide to Kubernetes
chrisshort
51
52k
Building a Scalable Design System with Sketch
lauravandoore
463
34k
Side Projects
sachag
455
43k
StorybookのUI Testing Handbookを読んだ
zakiyama
31
6.6k
Transcript
TROUBLESHOOTING NODE.JS what to do when things go wrong Igor
Soarez
[email protected]
@igorsoarez Hassy Veldstra
[email protected]
@hveldstra WDCNZ, July 2015
HELLO HELLO • YLD! • Node.js Consultancy & Training •
Digital transformation for enterprise clients
FIRES Someone has to put them out
BE PREPARED
LOG EVERYTHING Make it easy to grep & visualise
TEST TEST TEST • Functional tests first • Good coverage
for unit tests • Randomised testing & fuzz testing
MONITORING & ALERTING • Resource monitoring • CPU • Memory
• I/O • Application monitoring • Errors • Real-user monitoring • Latency • Availability
AUTOMATED DEPLOYMENTS
PAIR PROGRAMMING
TAKE YOUR TIME WHEN BUILDING YOUR APPLICATION Tight deadlines are
the root of all evil
LOAD TESTING
LOAD TESTING • You should do it
LOAD TESTING • You should do it • Find the
bottlenecks
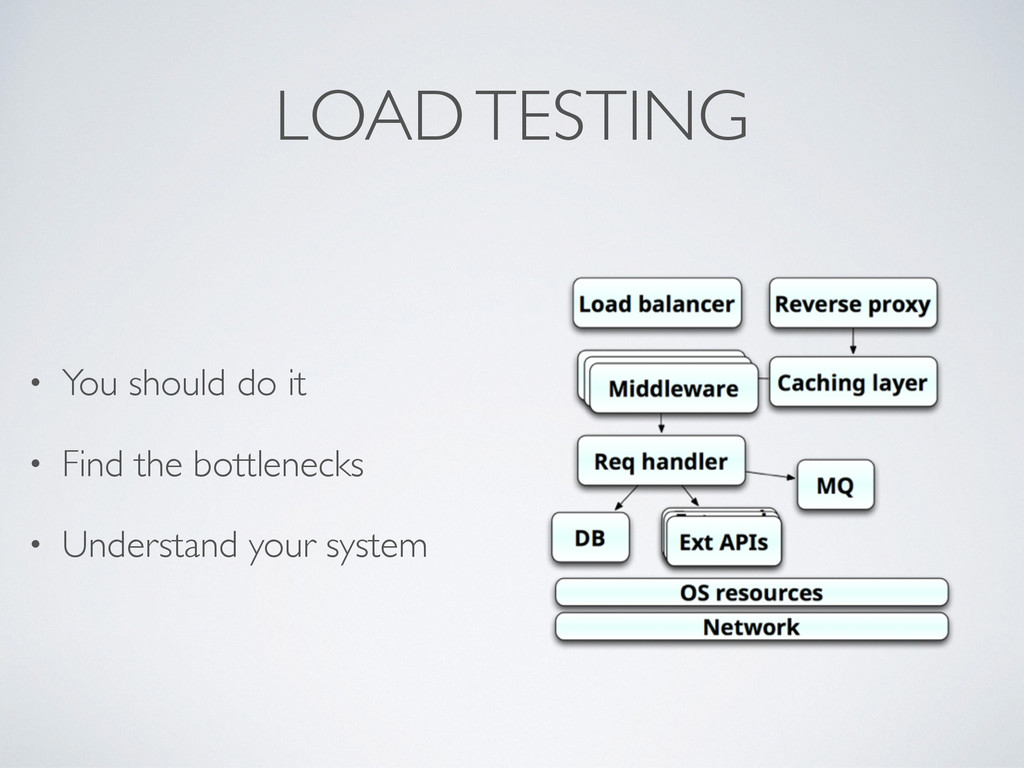
LOAD TESTING • You should do it • Find the
bottlenecks • Understand your system
LOAD TESTING • You should do it • Find the
bottlenecks • Understand your system
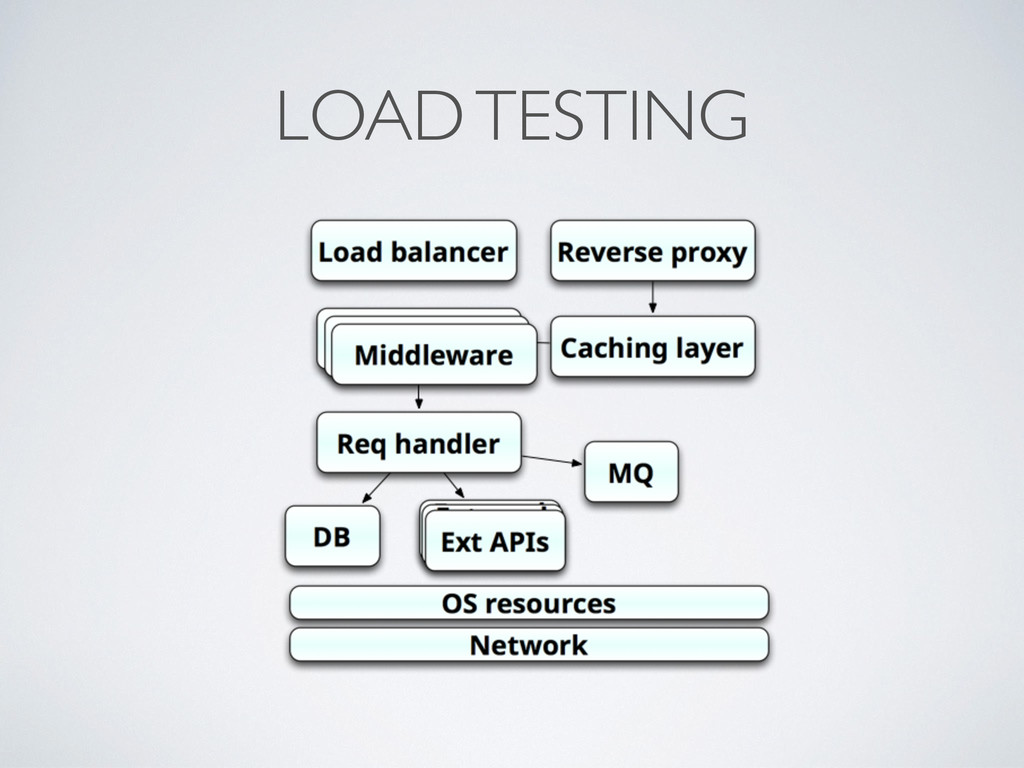
LOAD TESTING
LOAD TESTING
YOU SHOULD DO IT IN PRODUCTION
IN PRODUCTION??? I must have heard you wrong
WHY NOT? Why — Reason 1
STAGING IS NEVER THE SAME Why — Reason 1I
GAIN EXTRA CONFIDENCE Why — Reason 1II
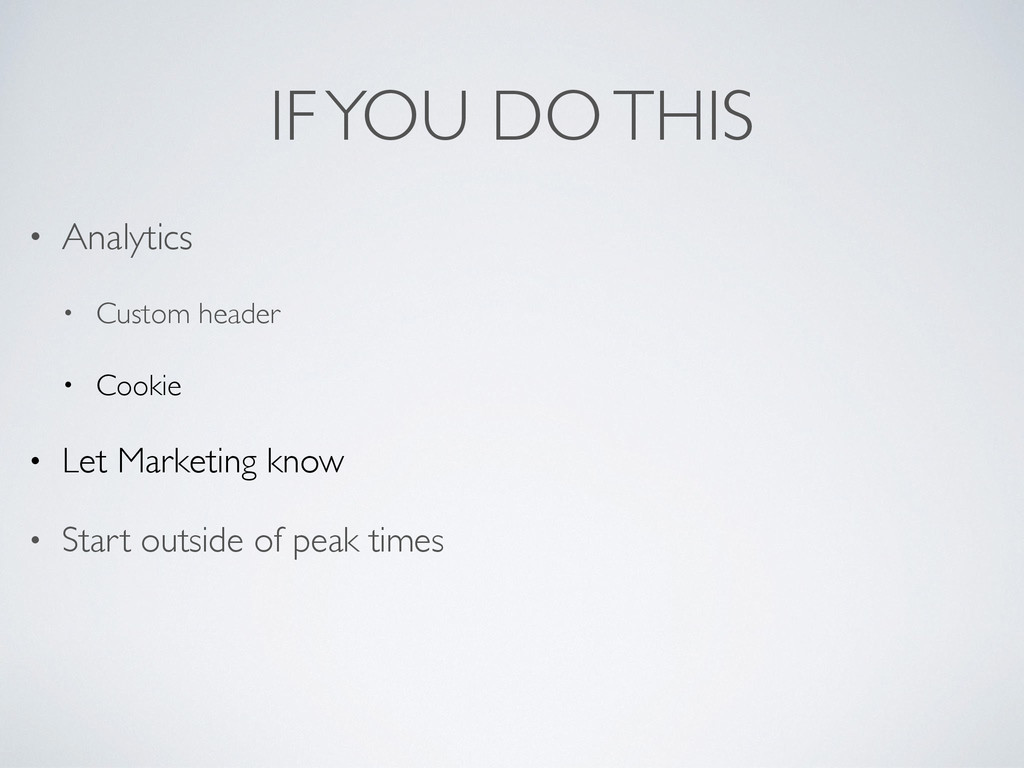
IF YOU DO THIS • Analytics
IF YOU DO THIS • Analytics • Custom header •
Cookie
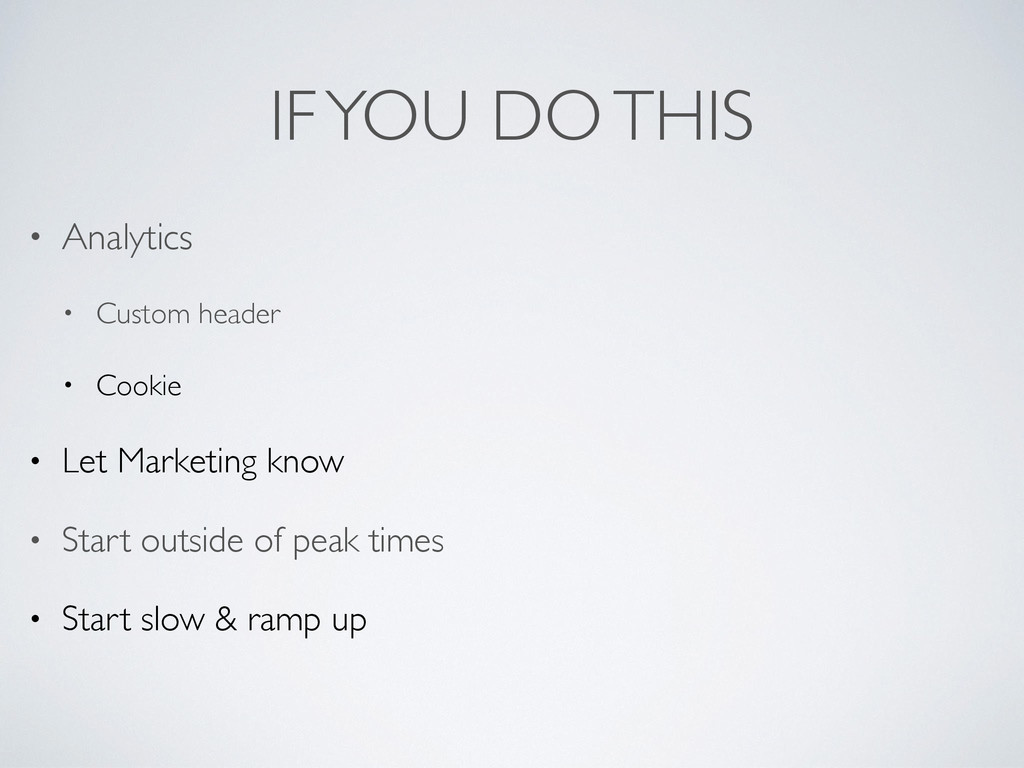
IF YOU DO THIS • Analytics • Custom header •
Cookie • Let Marketing know
IF YOU DO THIS • Analytics • Custom header •
Cookie • Let Marketing know • Start outside of peak times
IF YOU DO THIS • Analytics • Custom header •
Cookie • Let Marketing know • Start outside of peak times • Start slow & ramp up
LOAD TESTING TOOLS • JMeter
LOAD TESTING TOOLS • JMeter • Tsung
LOAD TESTING TOOLS • JMeter • Tsung • Minigun -
https://artillery.io/minigun
AFTER THE FIRE STARTS how to approach it
PERFORMANCE PROBLEMS
ATTACK THE PROBLEM 1. Isolated test case * 2. Measure
3. Change / Tweak / Improve 4. Goto 2 * If possible
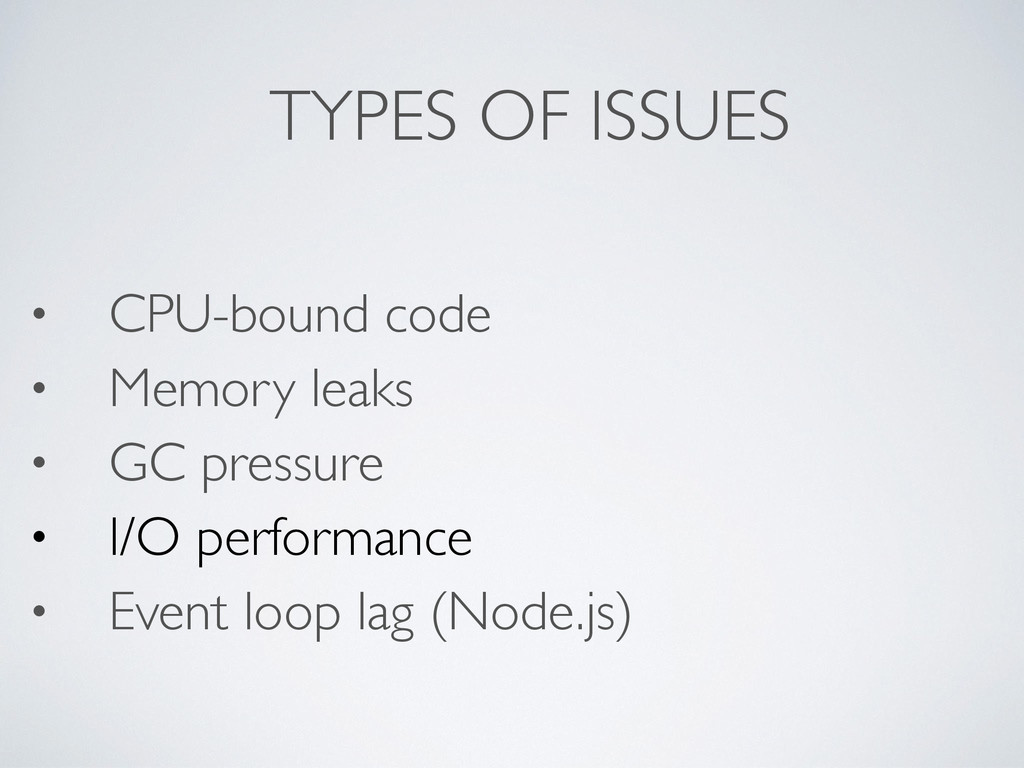
TYPES OF ISSUES • CPU-bound code • Memory leaks •
GC pressure • I/O performance • Event loop lag (Node.js)
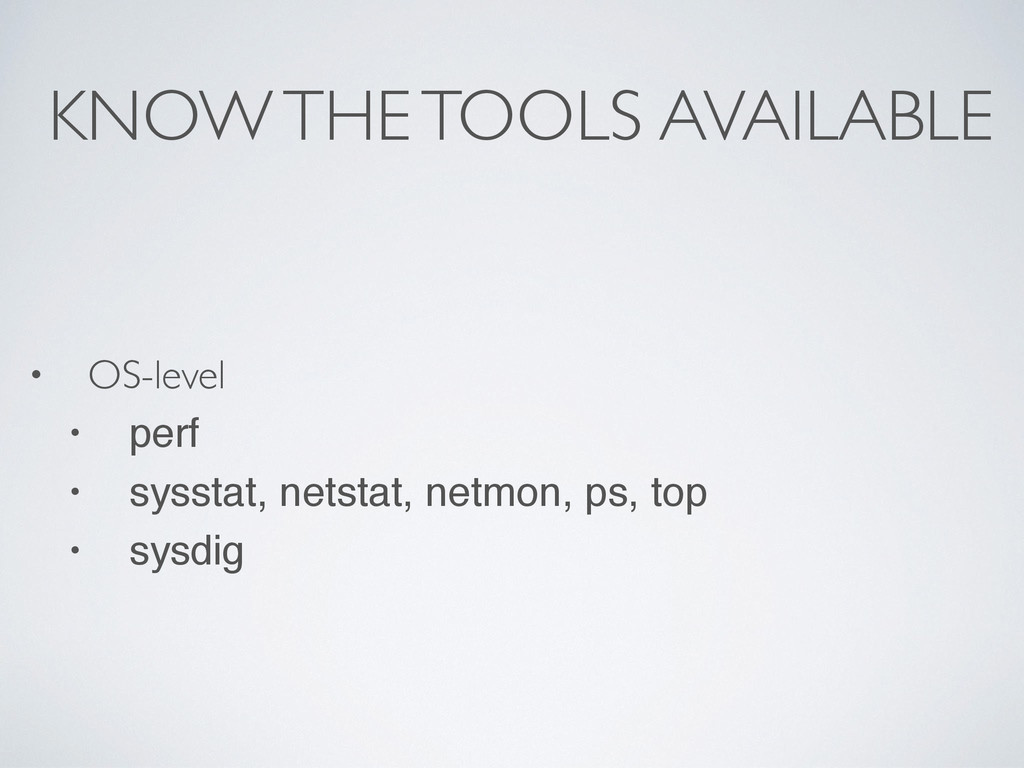
KNOW THE TOOLS AVAILABLE • OS-level • perf • sysstat,
netstat, netmon, ps, top • sysdig
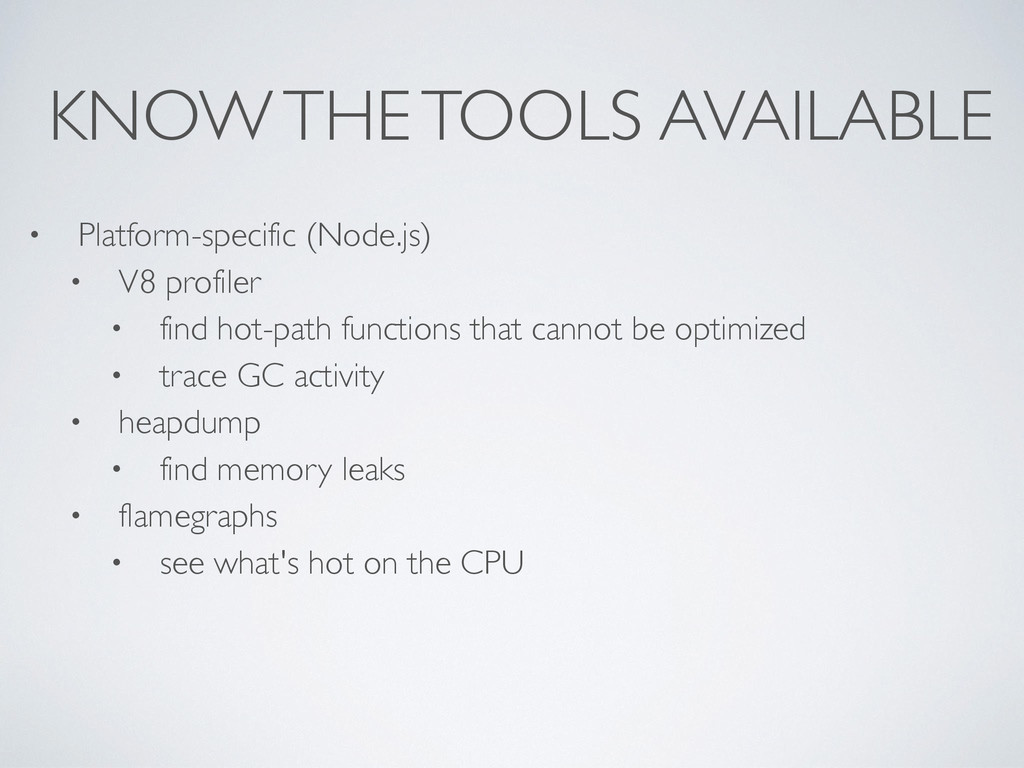
KNOW THE TOOLS AVAILABLE • Platform-specific (Node.js)
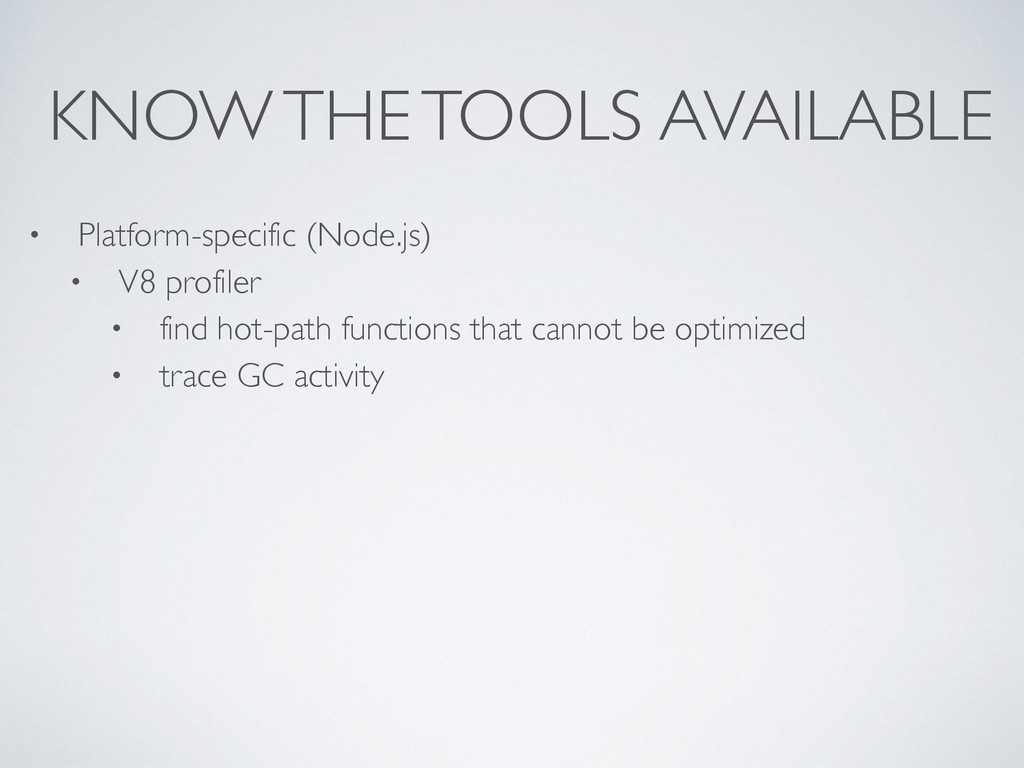
KNOW THE TOOLS AVAILABLE • Platform-specific (Node.js) • V8 profiler
• find hot-path functions that cannot be optimized • trace GC activity
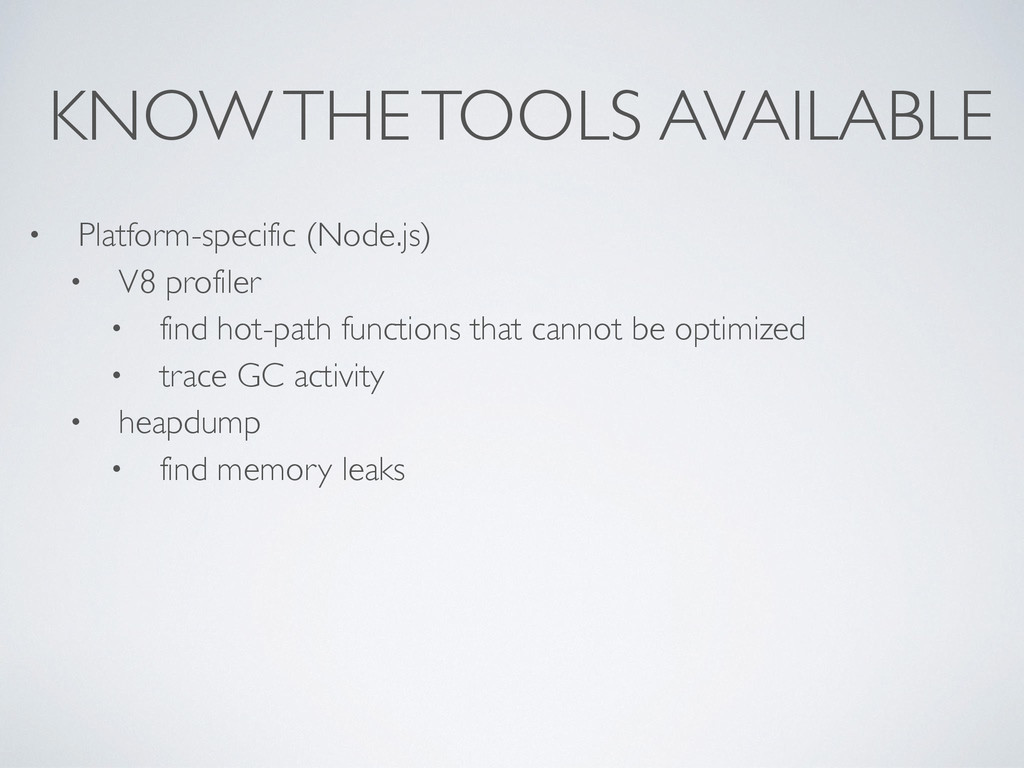
KNOW THE TOOLS AVAILABLE • Platform-specific (Node.js) • V8 profiler
• find hot-path functions that cannot be optimized • trace GC activity • heapdump • find memory leaks
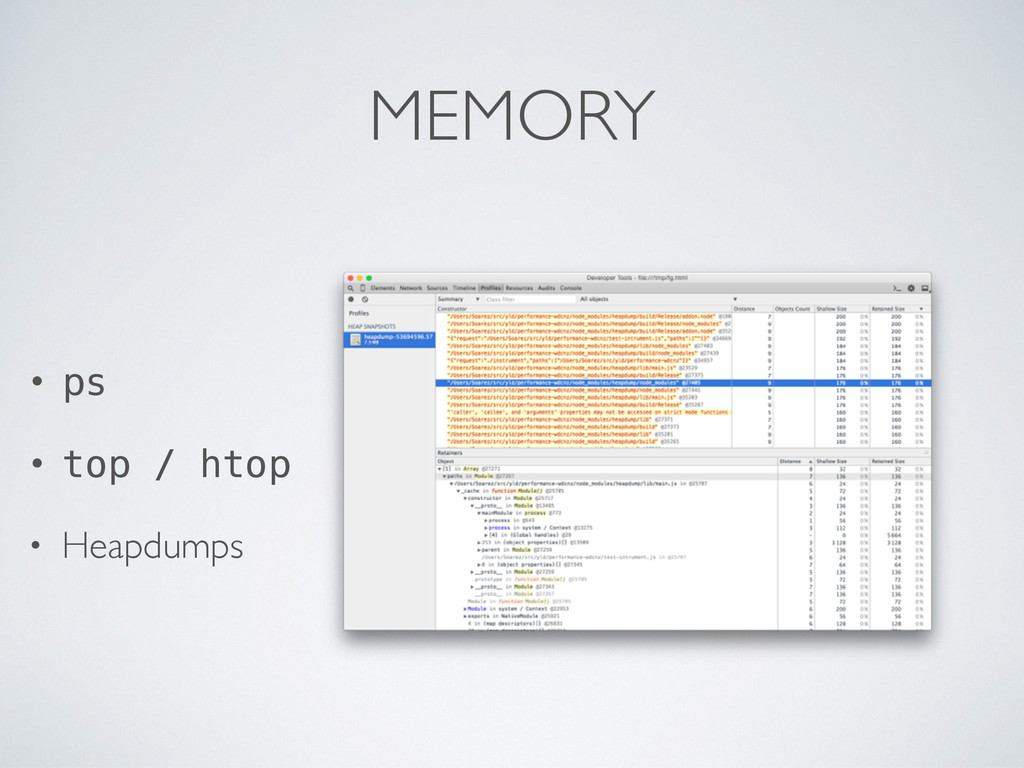
MEMORY • ps • top / htop • Heapdumps
KNOW THE TOOLS AVAILABLE • Platform-specific (Node.js) • V8 profiler
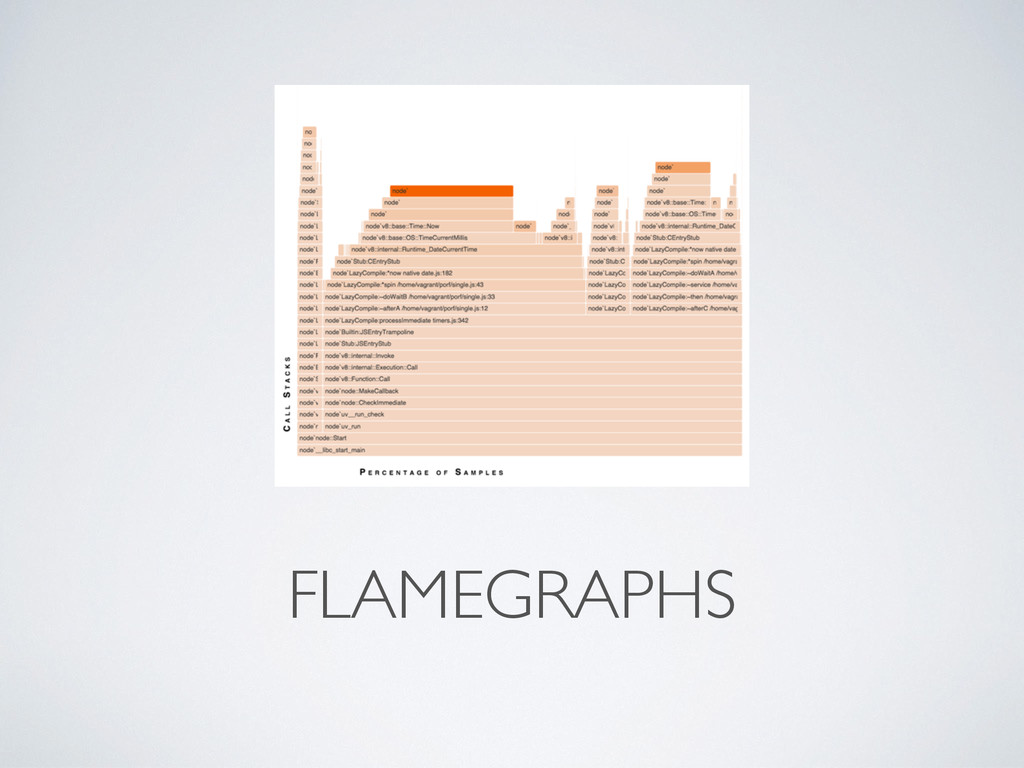
• find hot-path functions that cannot be optimized • trace GC activity • heapdump • find memory leaks • flamegraphs • see what's hot on the CPU
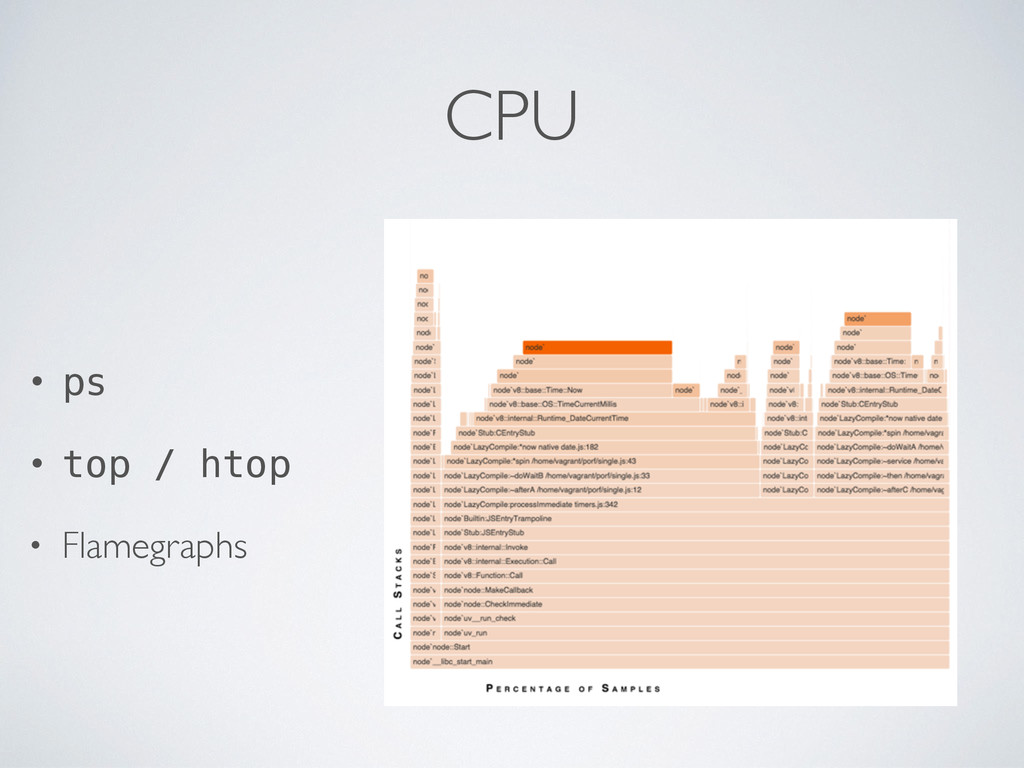
CPU • ps • top / htop • Flamegraphs
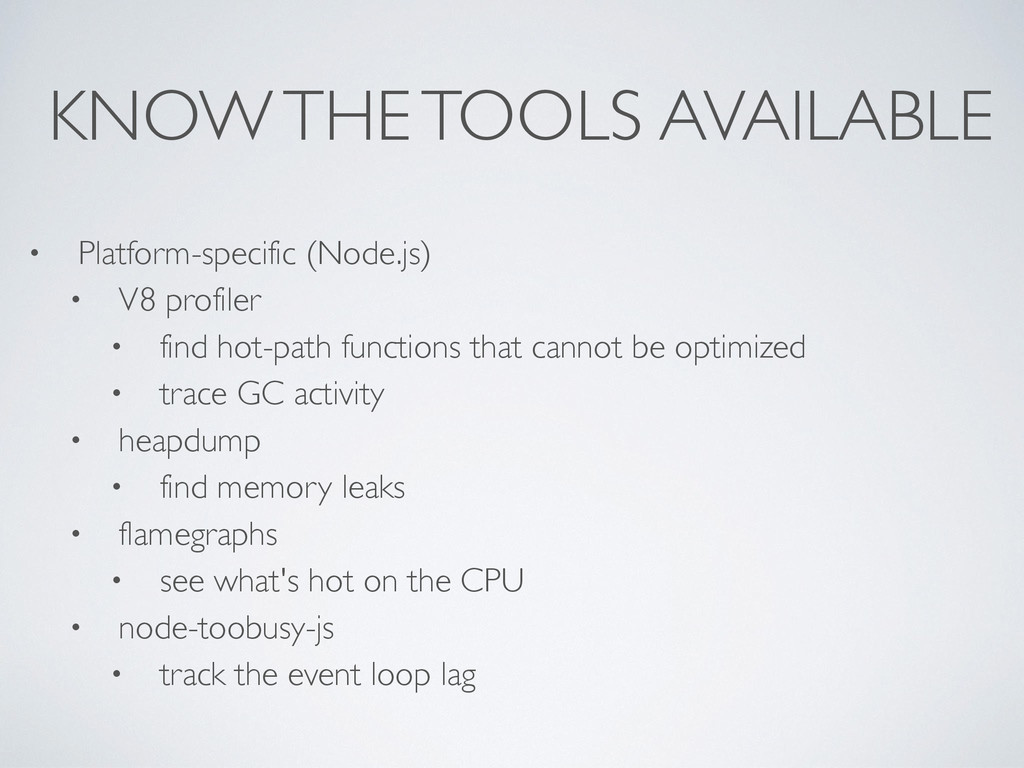
KNOW THE TOOLS AVAILABLE • Platform-specific (Node.js) • V8 profiler
• find hot-path functions that cannot be optimized • trace GC activity • heapdump • find memory leaks • flamegraphs • see what's hot on the CPU • node-toobusy-js • track the event loop lag
FLAMEGRAPHS
PERF aka Performance Counters
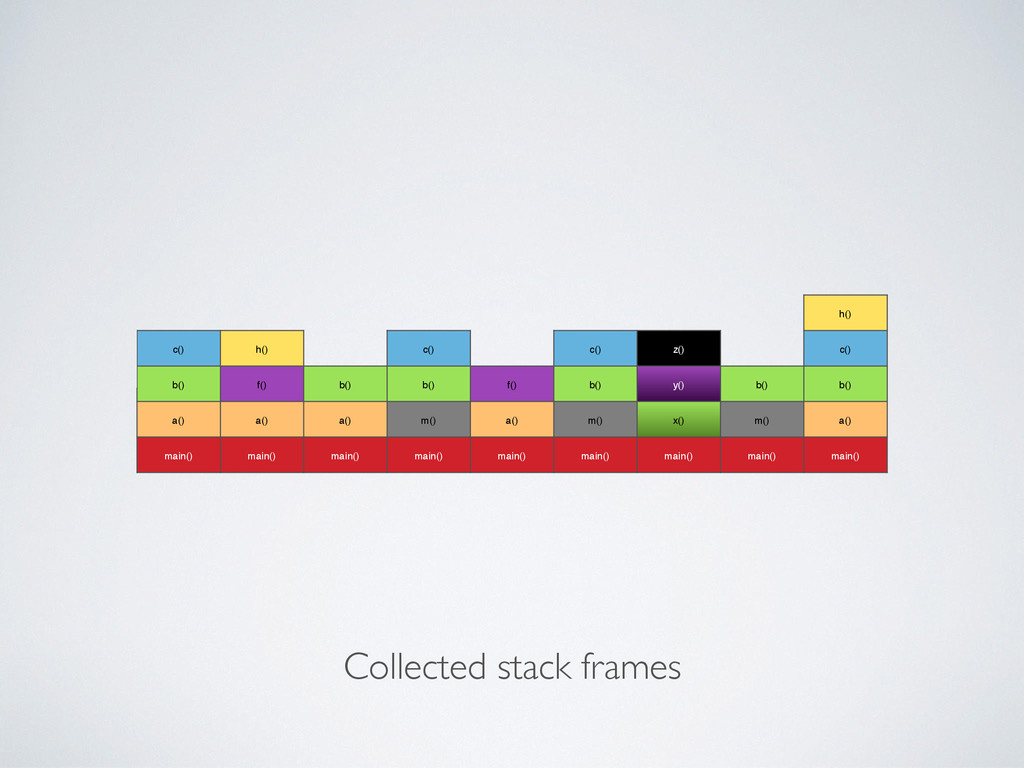
Collected stack frames h() c() h() c() c() z() c()
b() f() b() b() f() b() y() b() b() a() a() a() m() a() m() x() m() a() main() main() main() main() main() main() main() main() main()
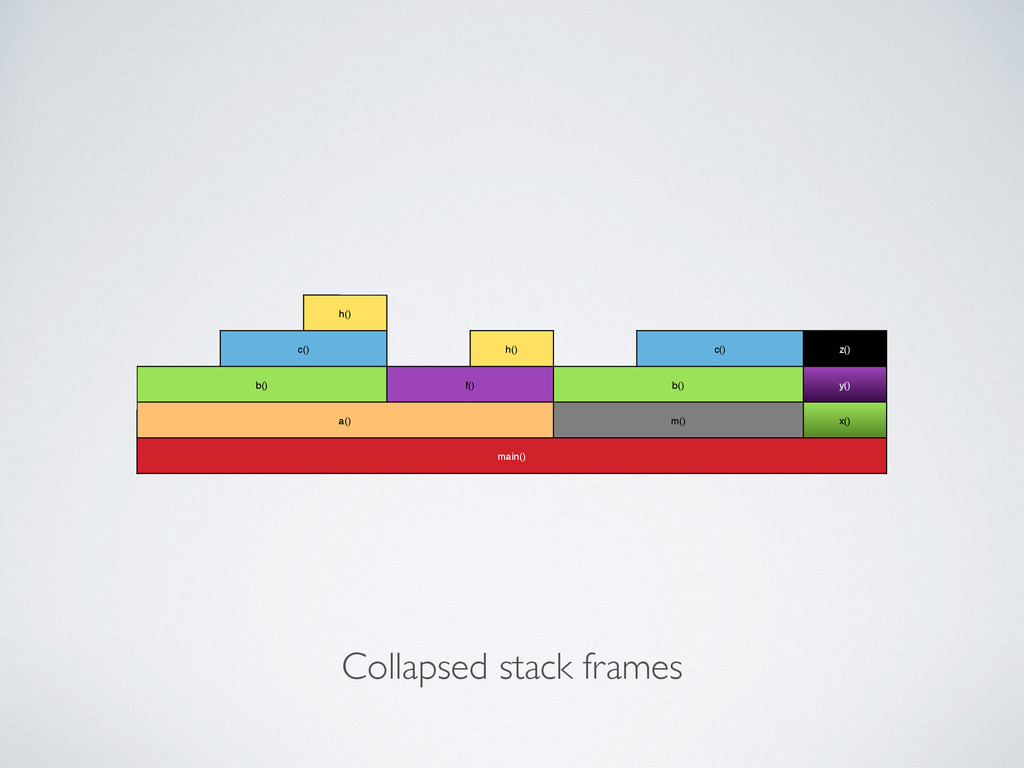
Collapsed stack frames h() c() h() c() z() b() f()
b() y() a() m() x() main()
DEMO!
THANK YOU! @hveldstra @igorsoarez