An introduction to simple and complex traits in humans, and how to study them in mice.
This slide deck describes the difference between simple and complex genetic traits in humans, how complex traits are studied in humans, and especially how we study them in laboratory mice.
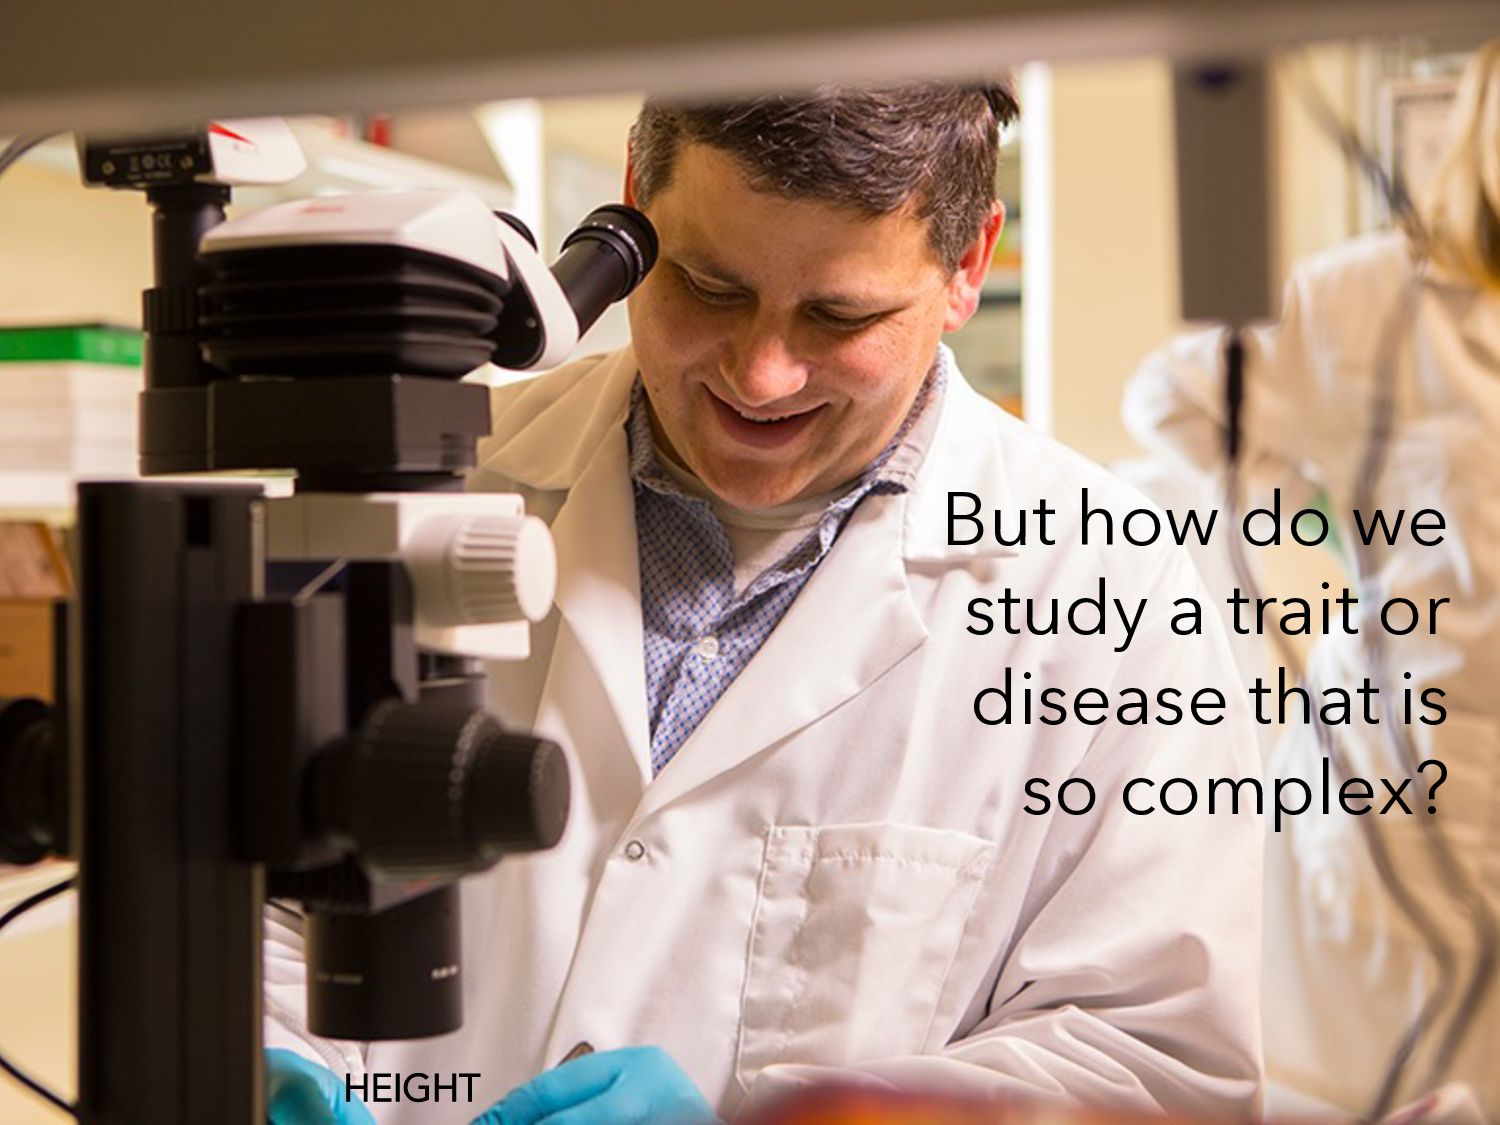
and complex traits? • How do we study the genetic basis of complex traits in humans? • Why and how do we study complex traits in mice? • What is “21st Century Mouse Genetics”?
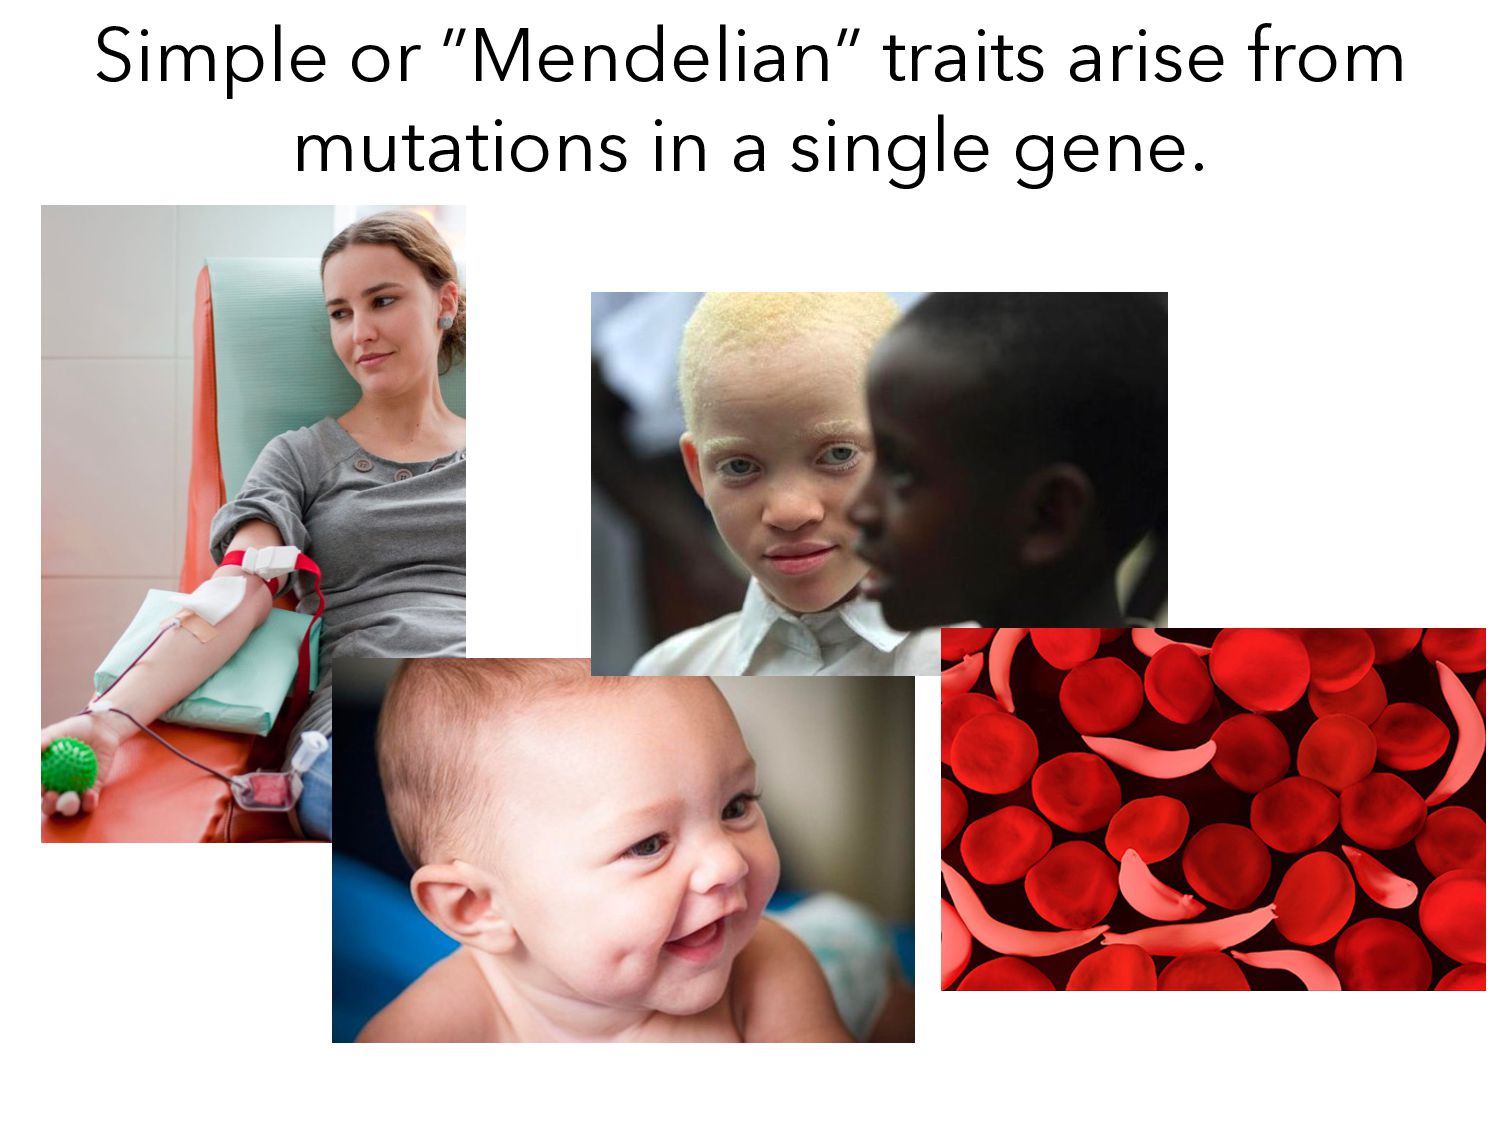
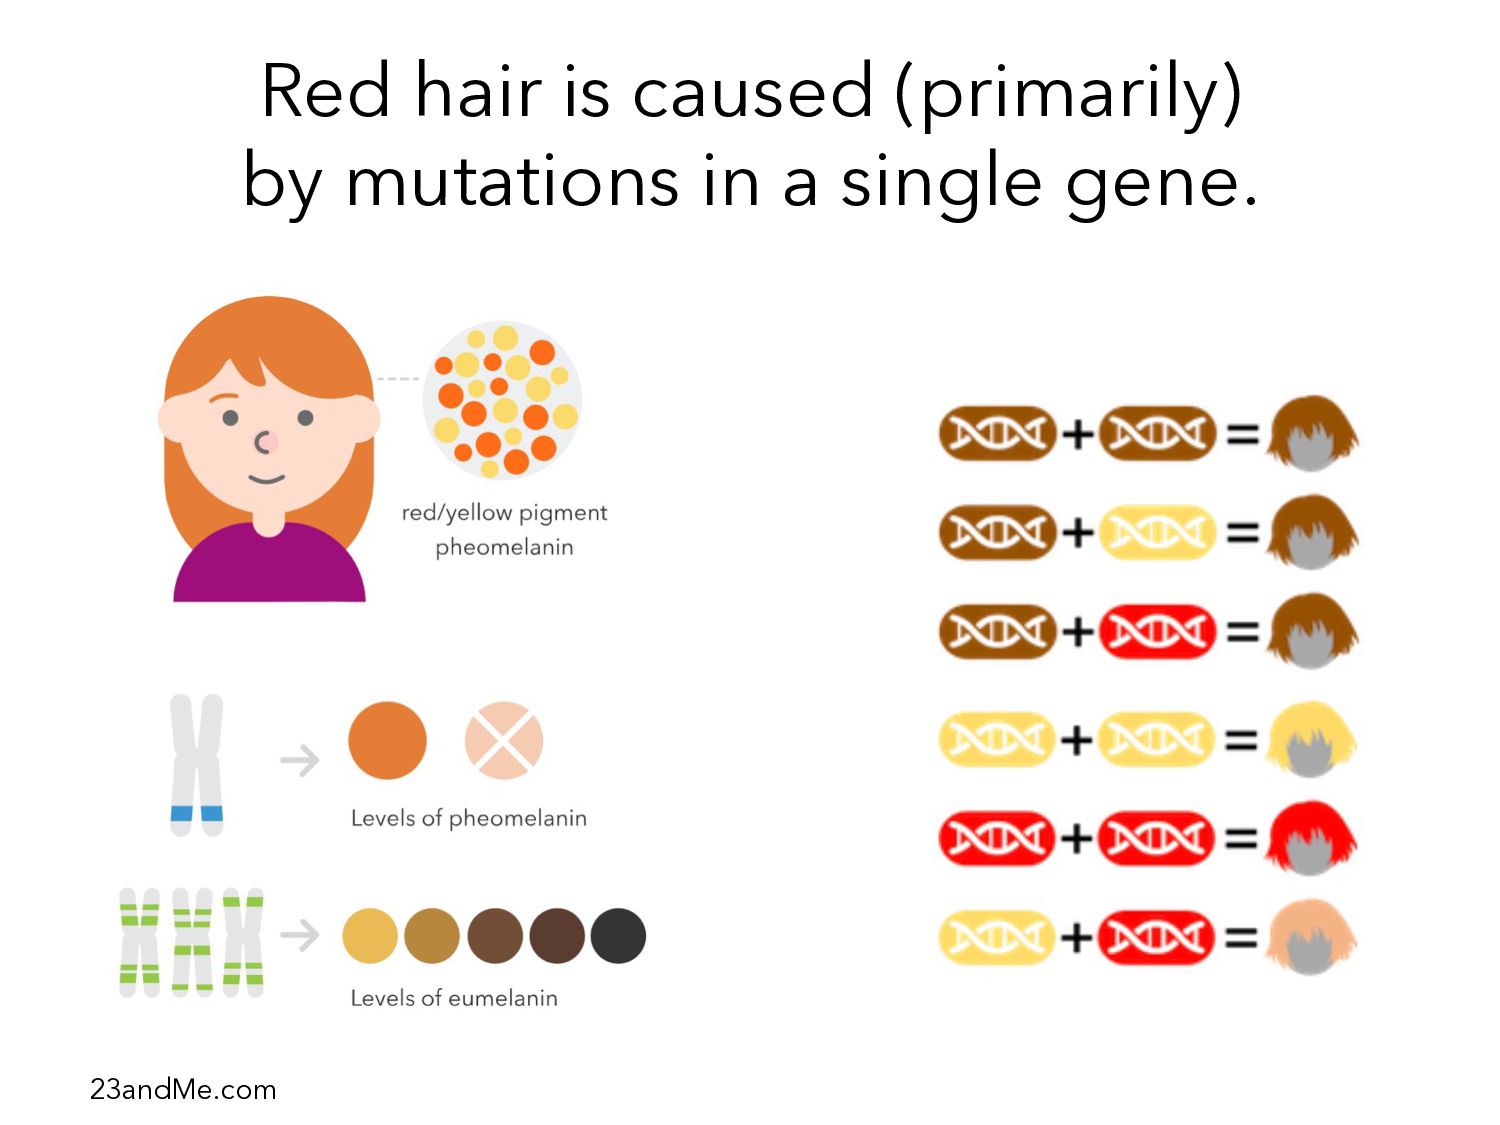
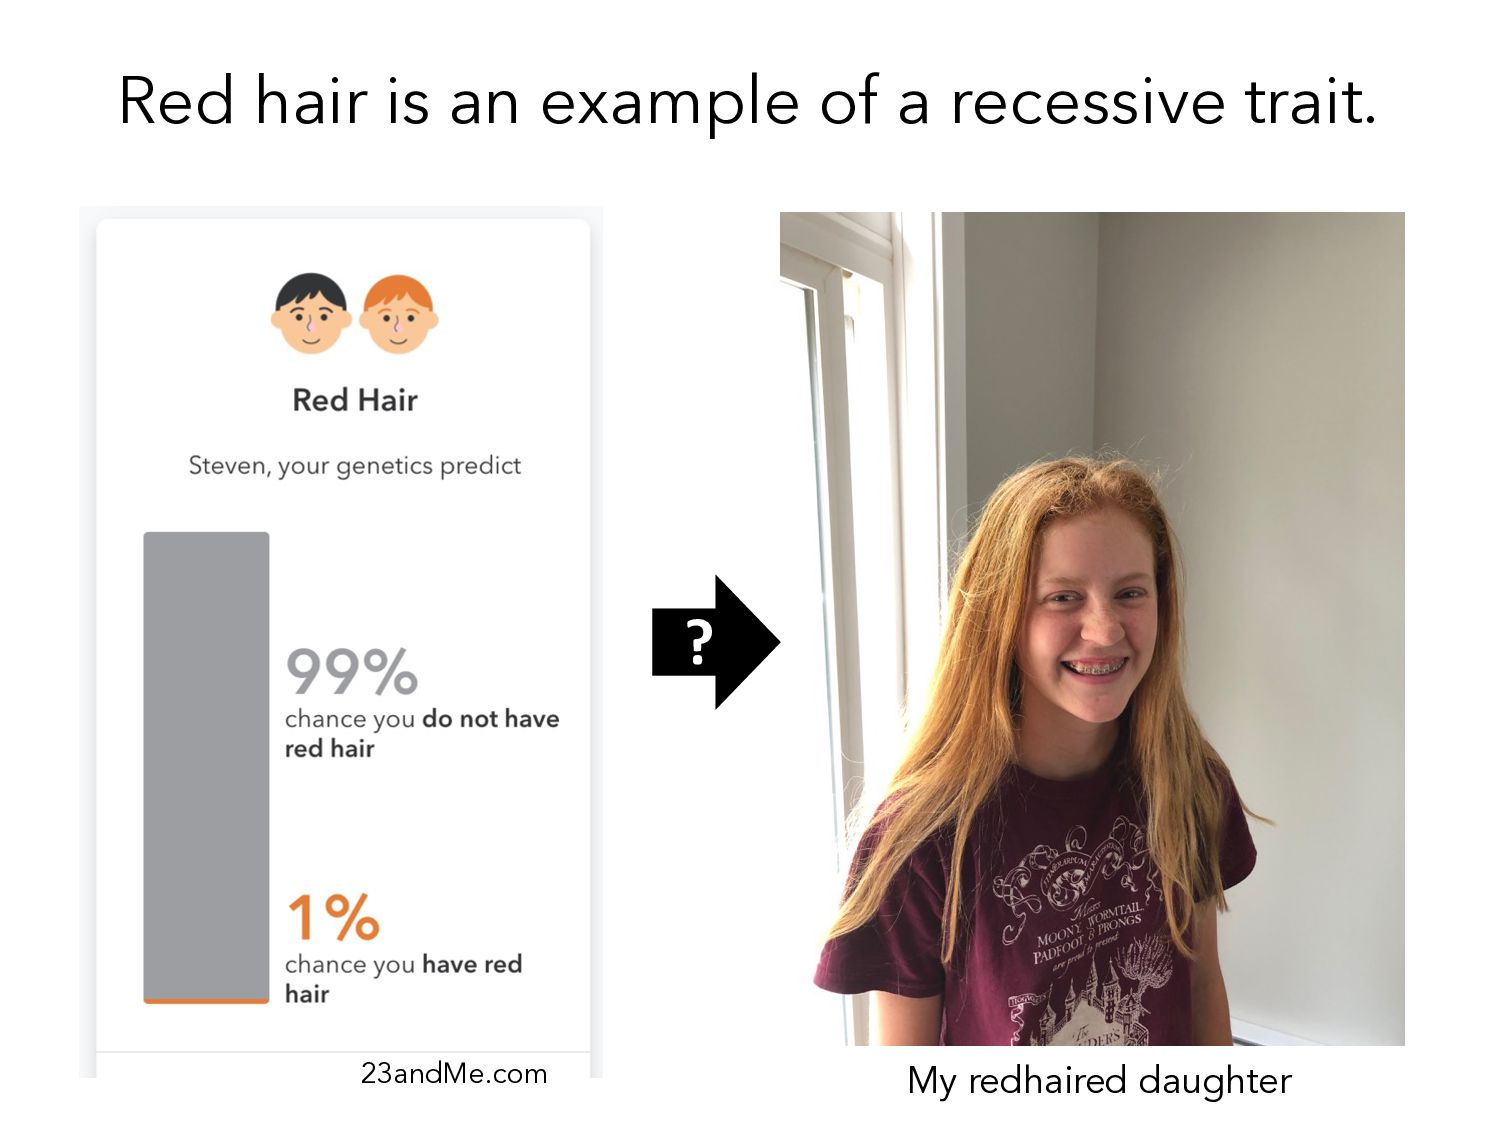
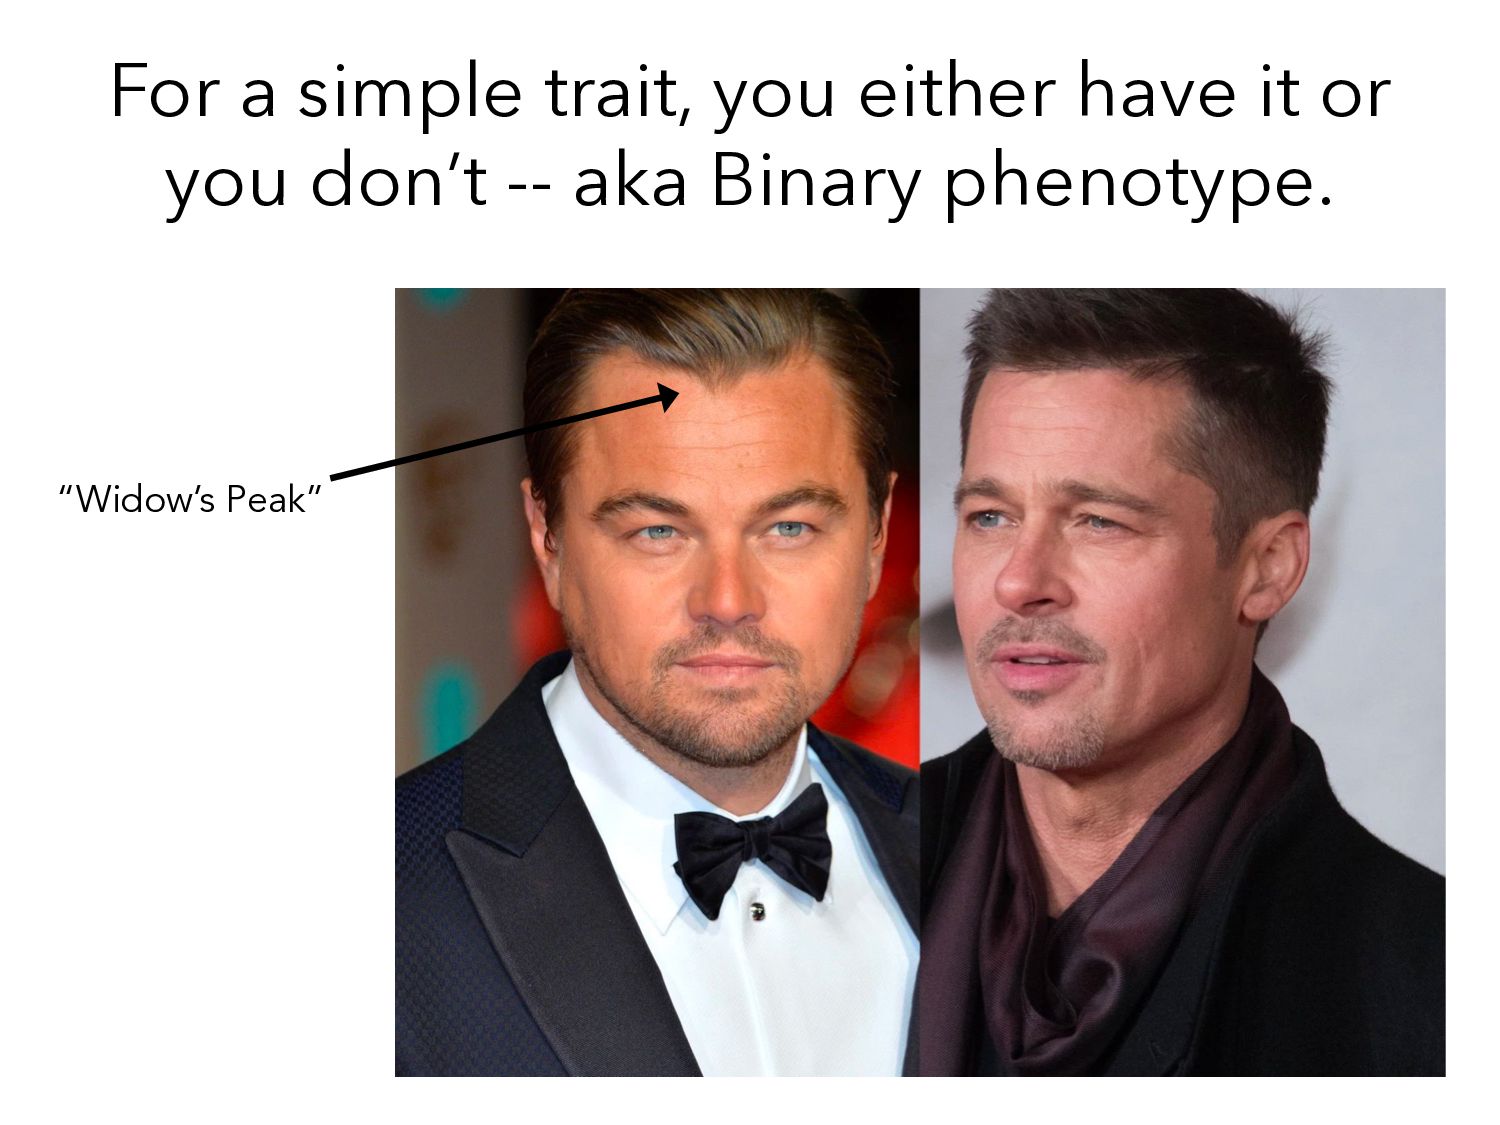
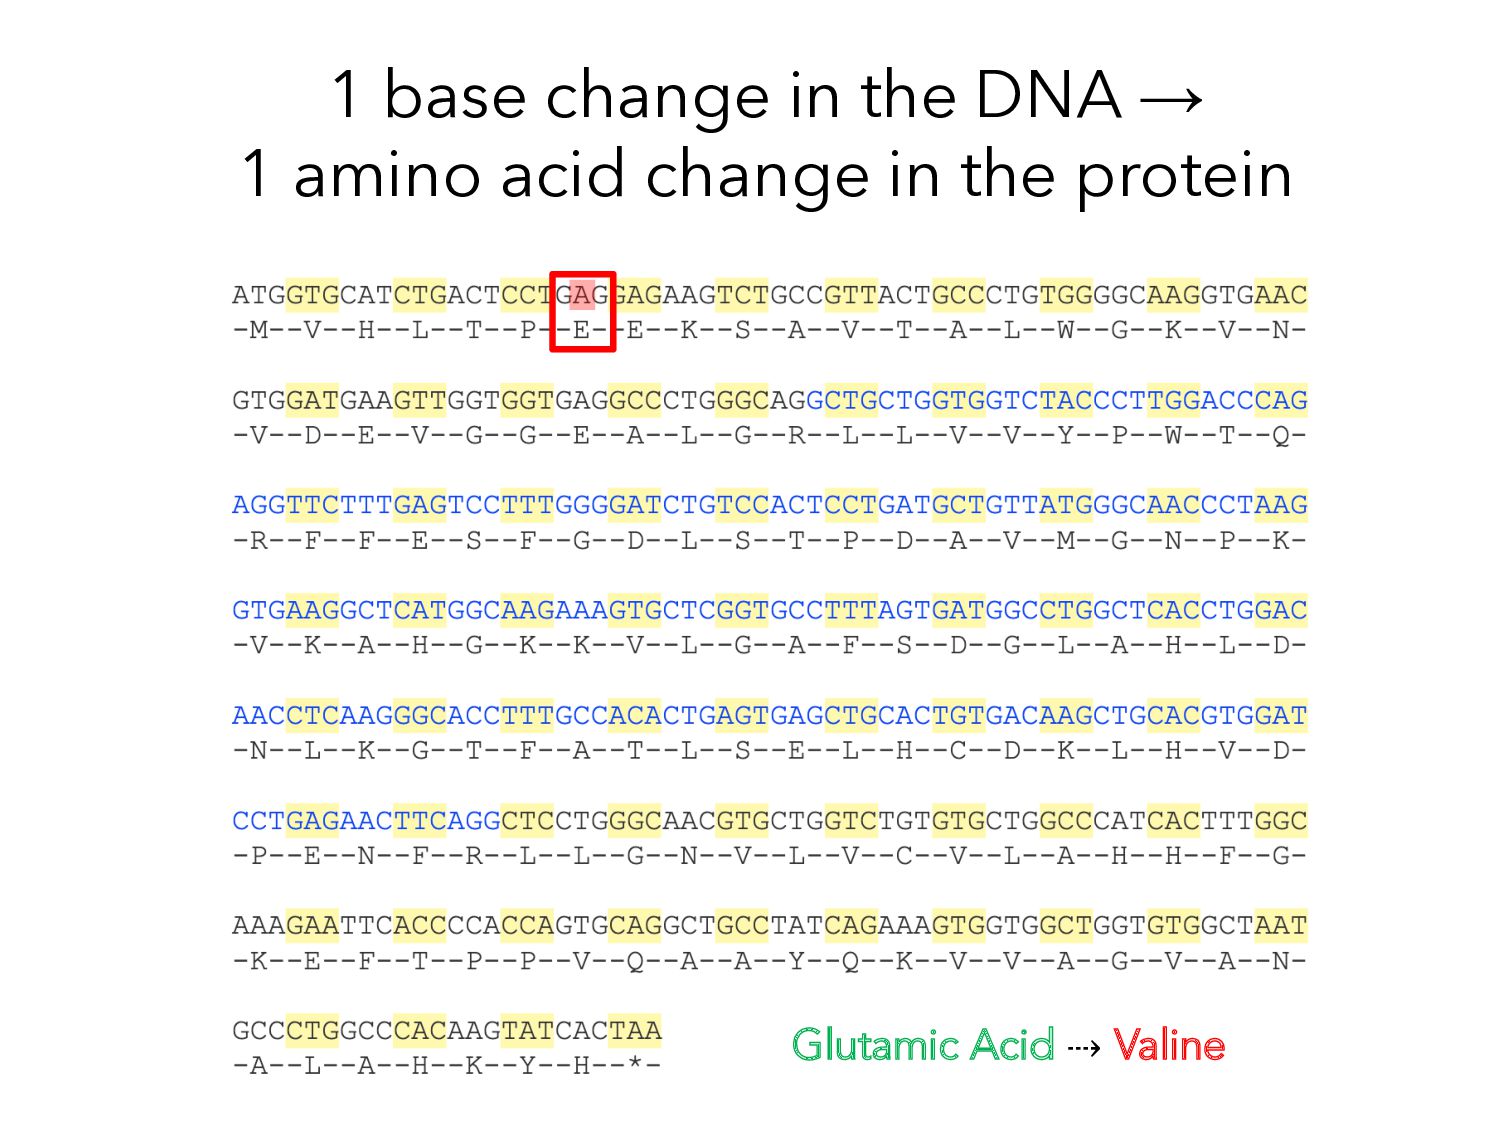
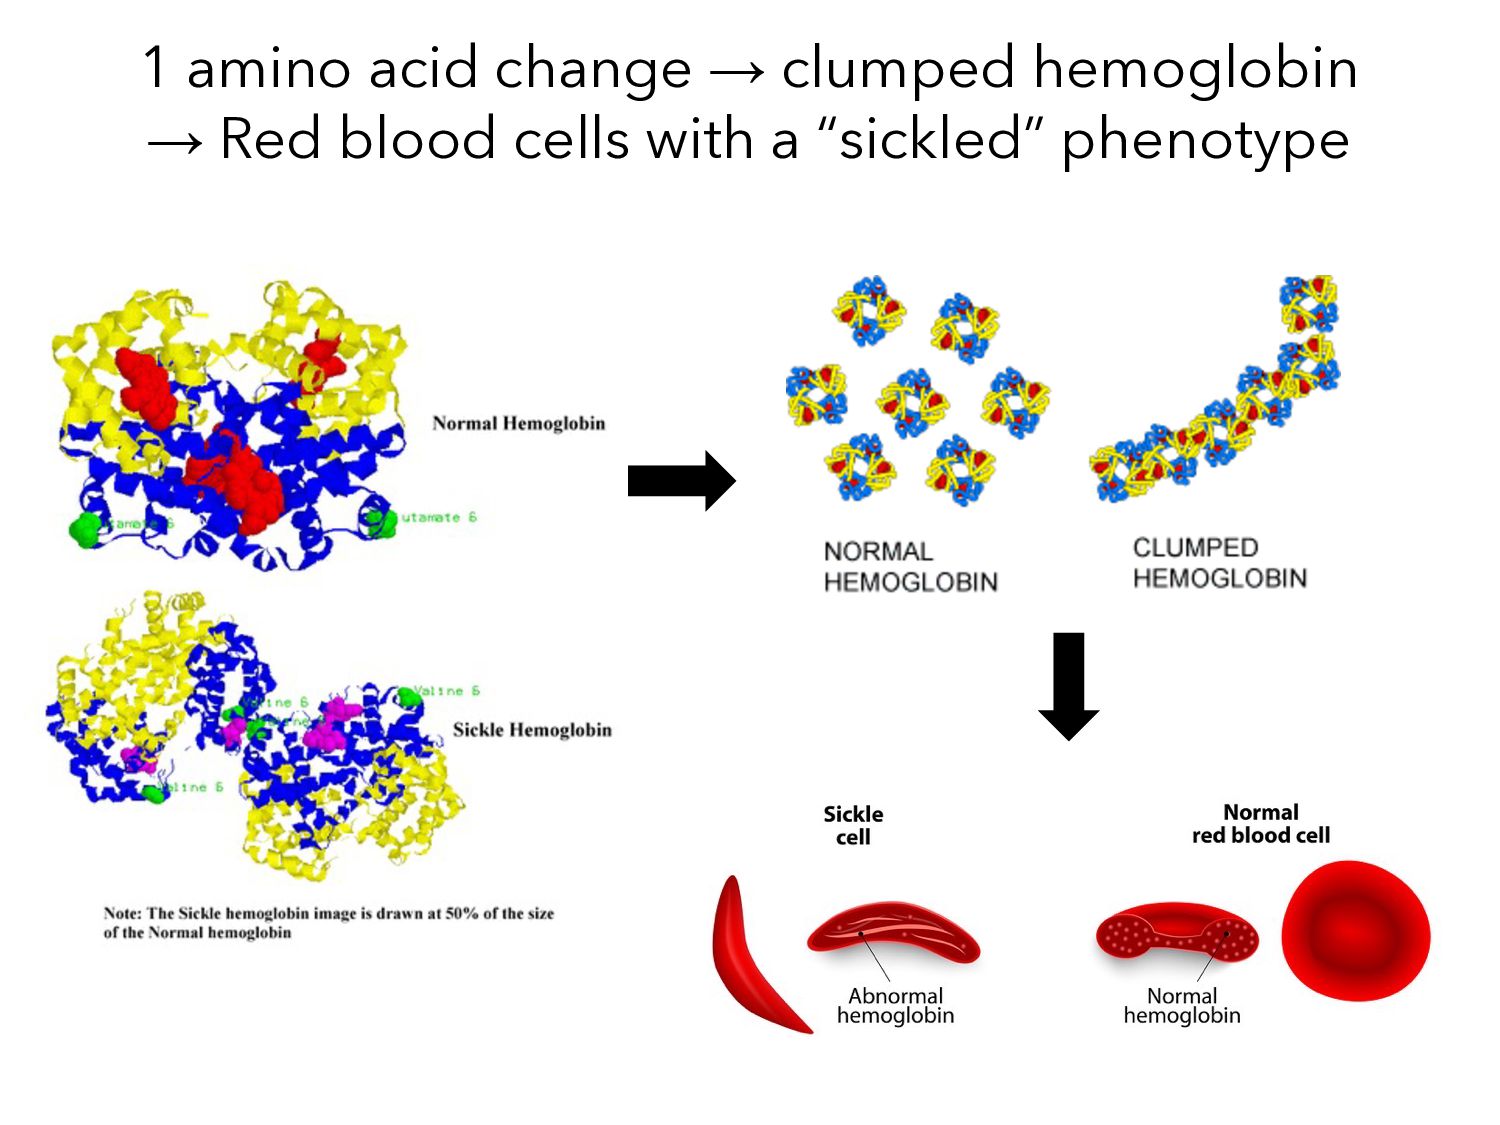
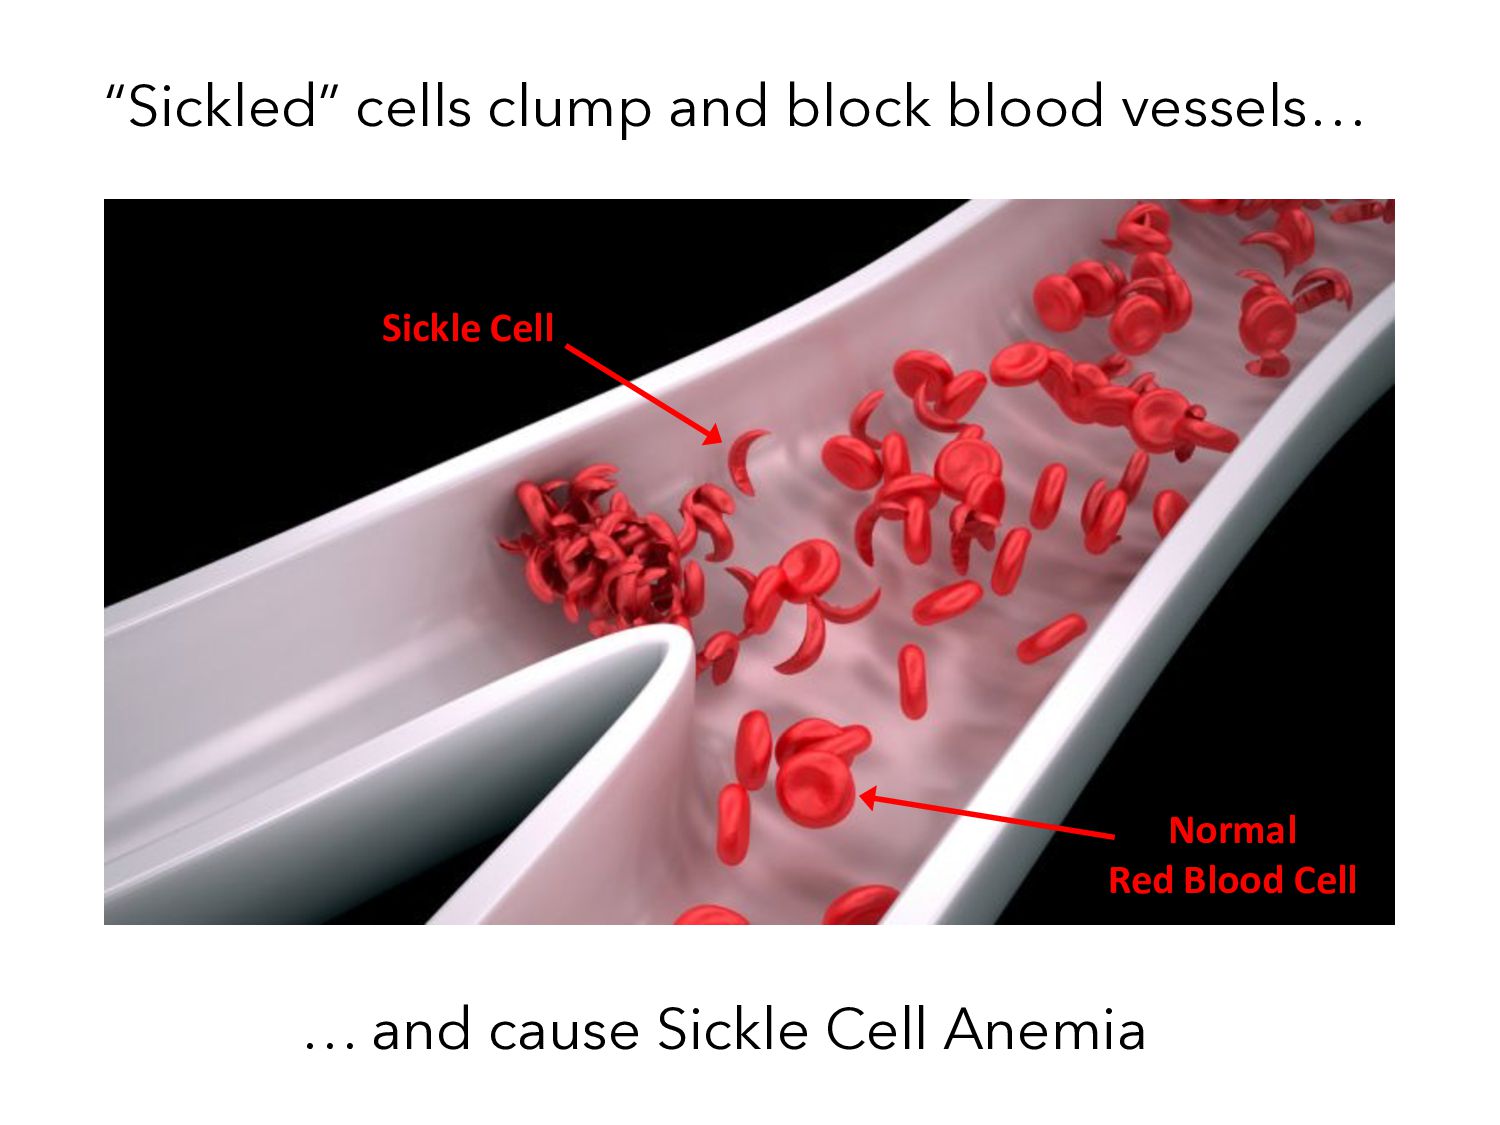
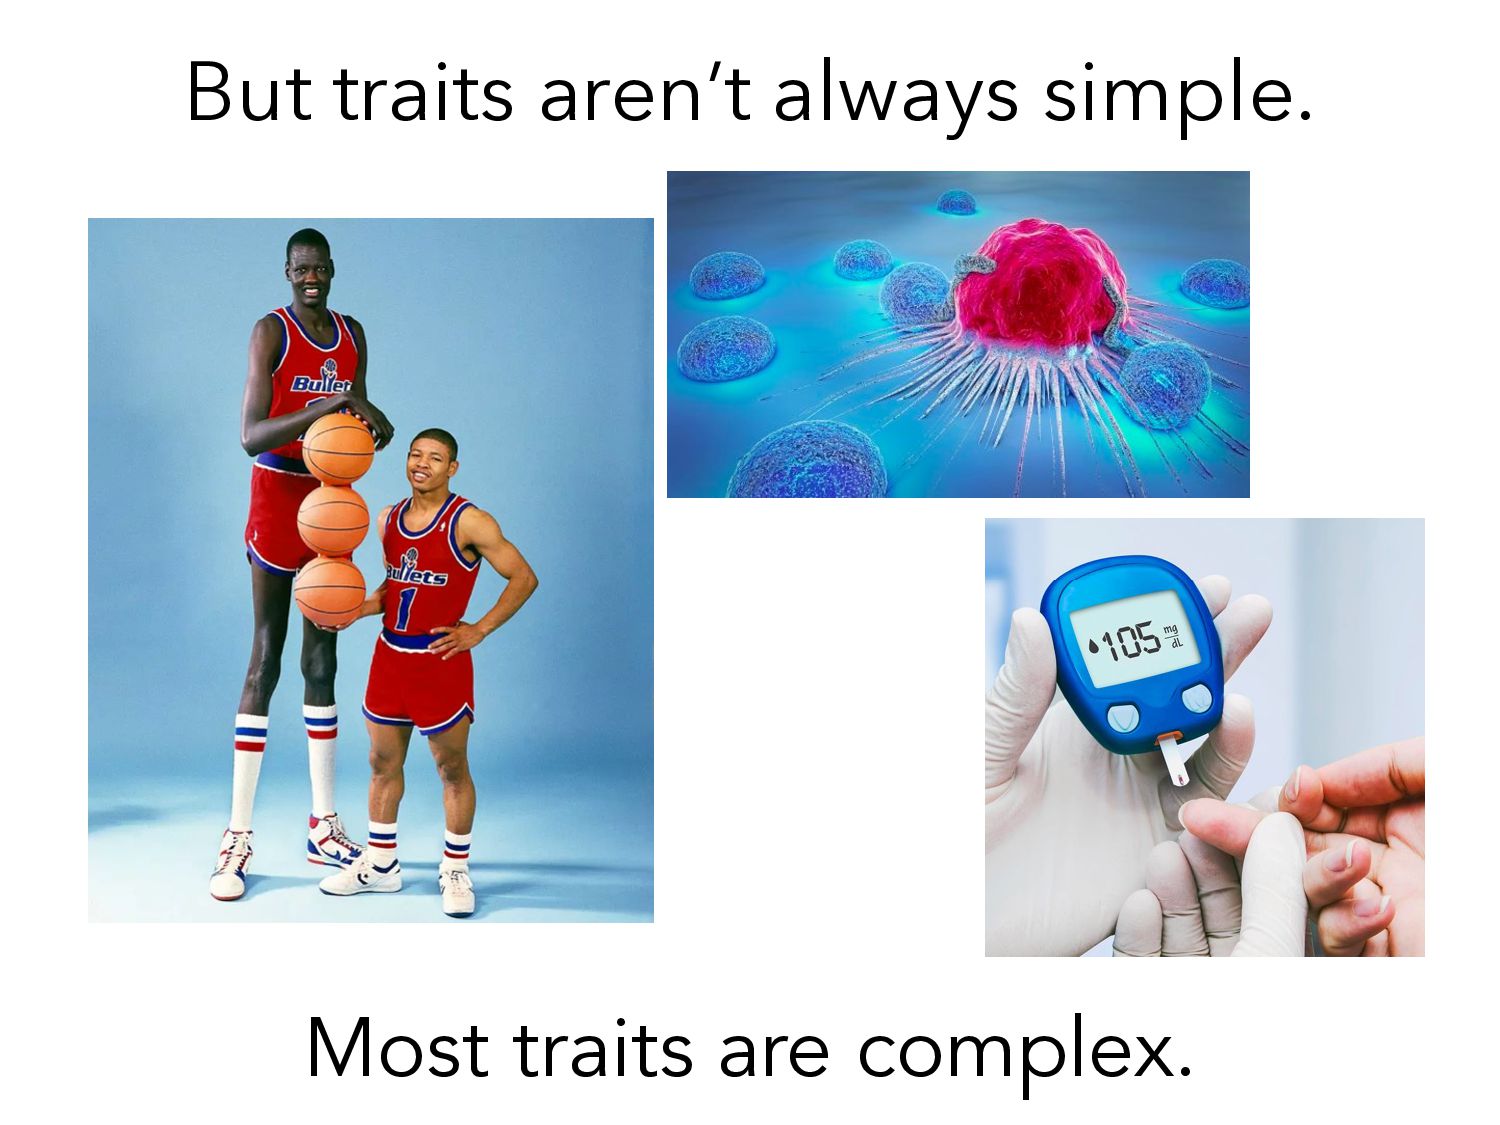
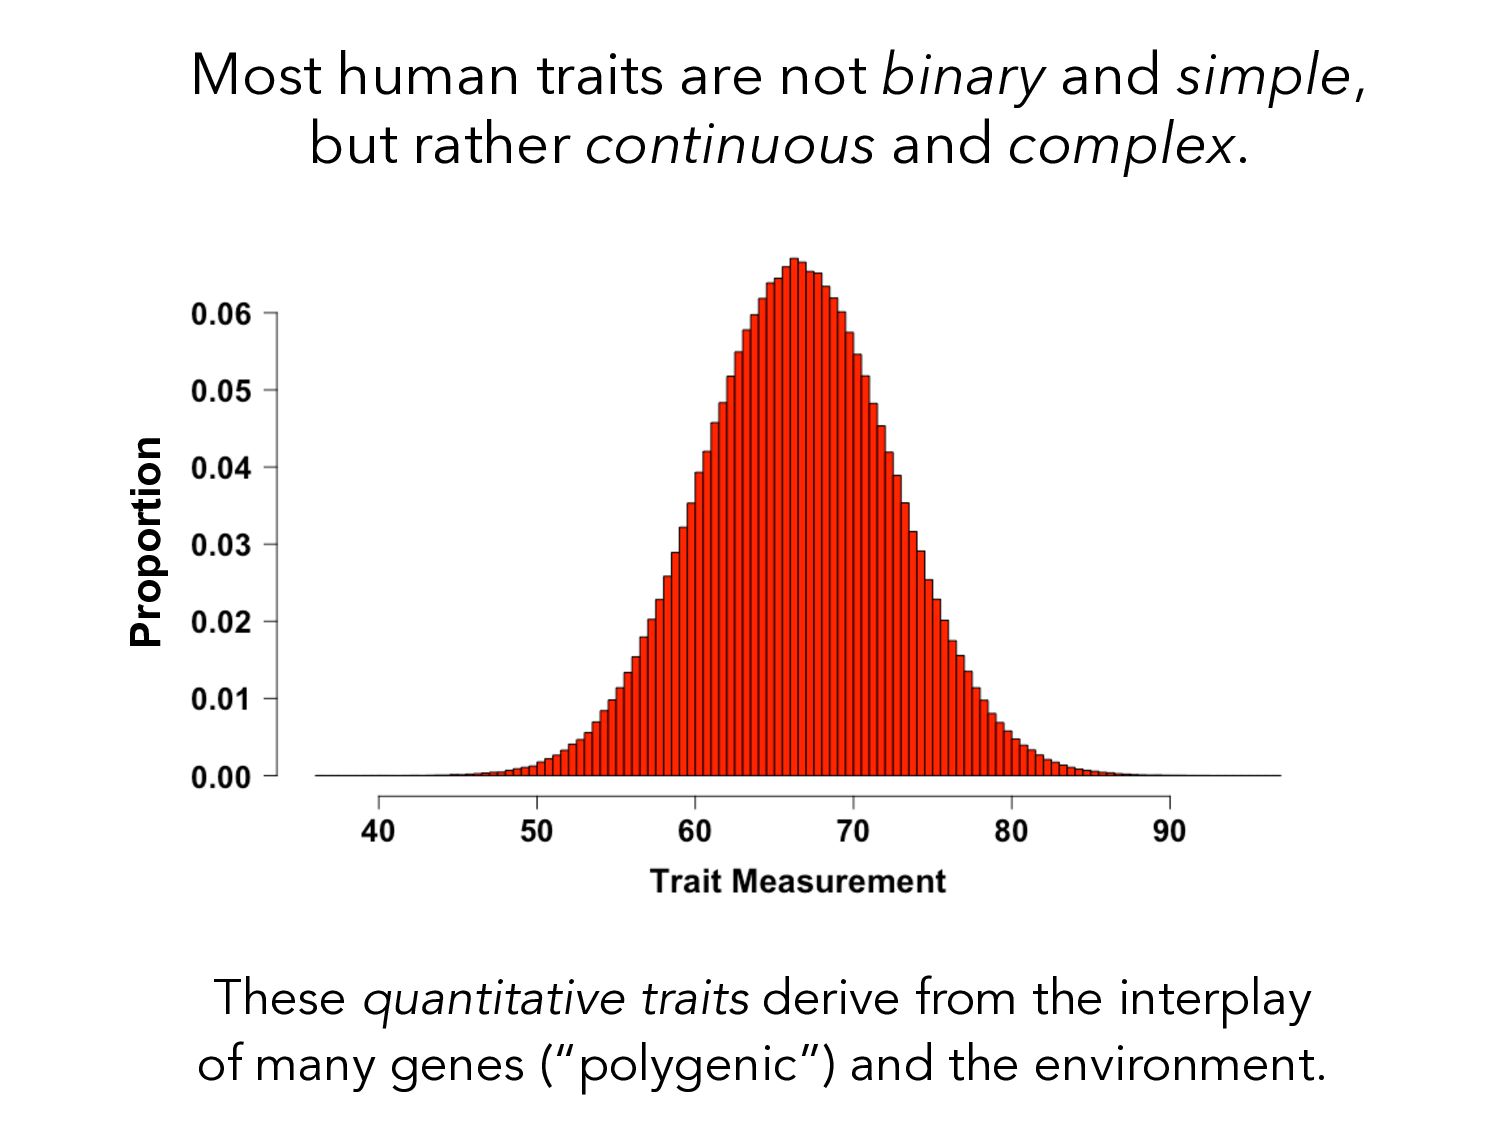
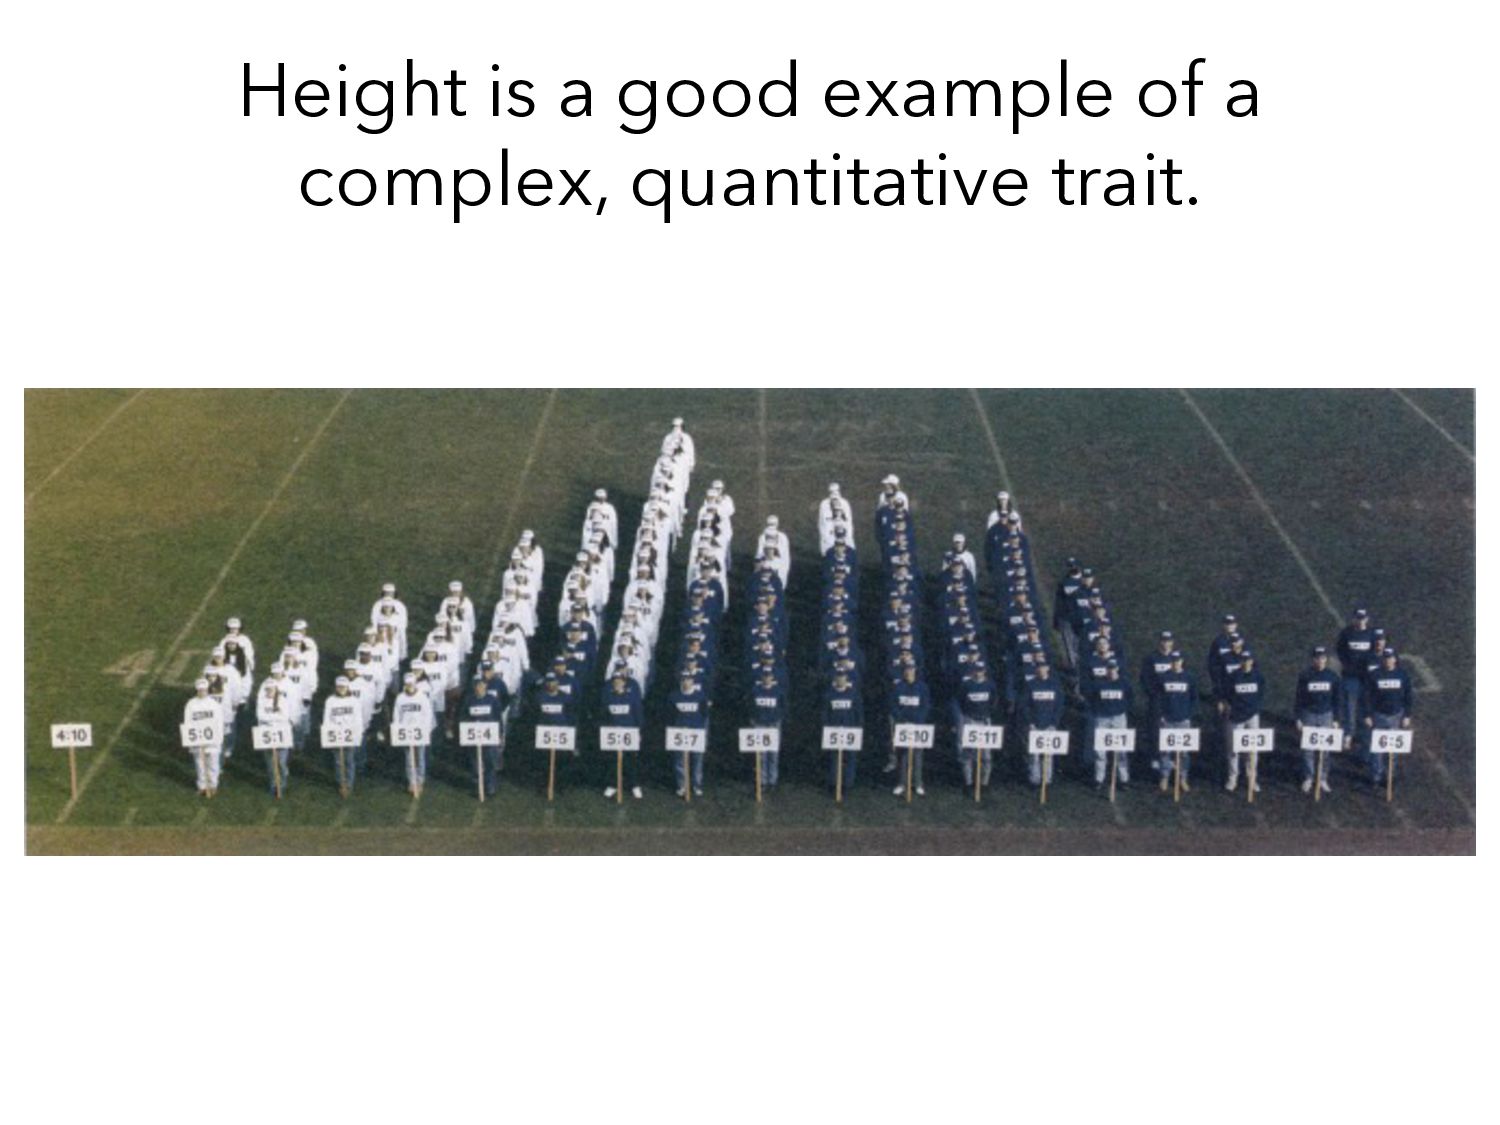
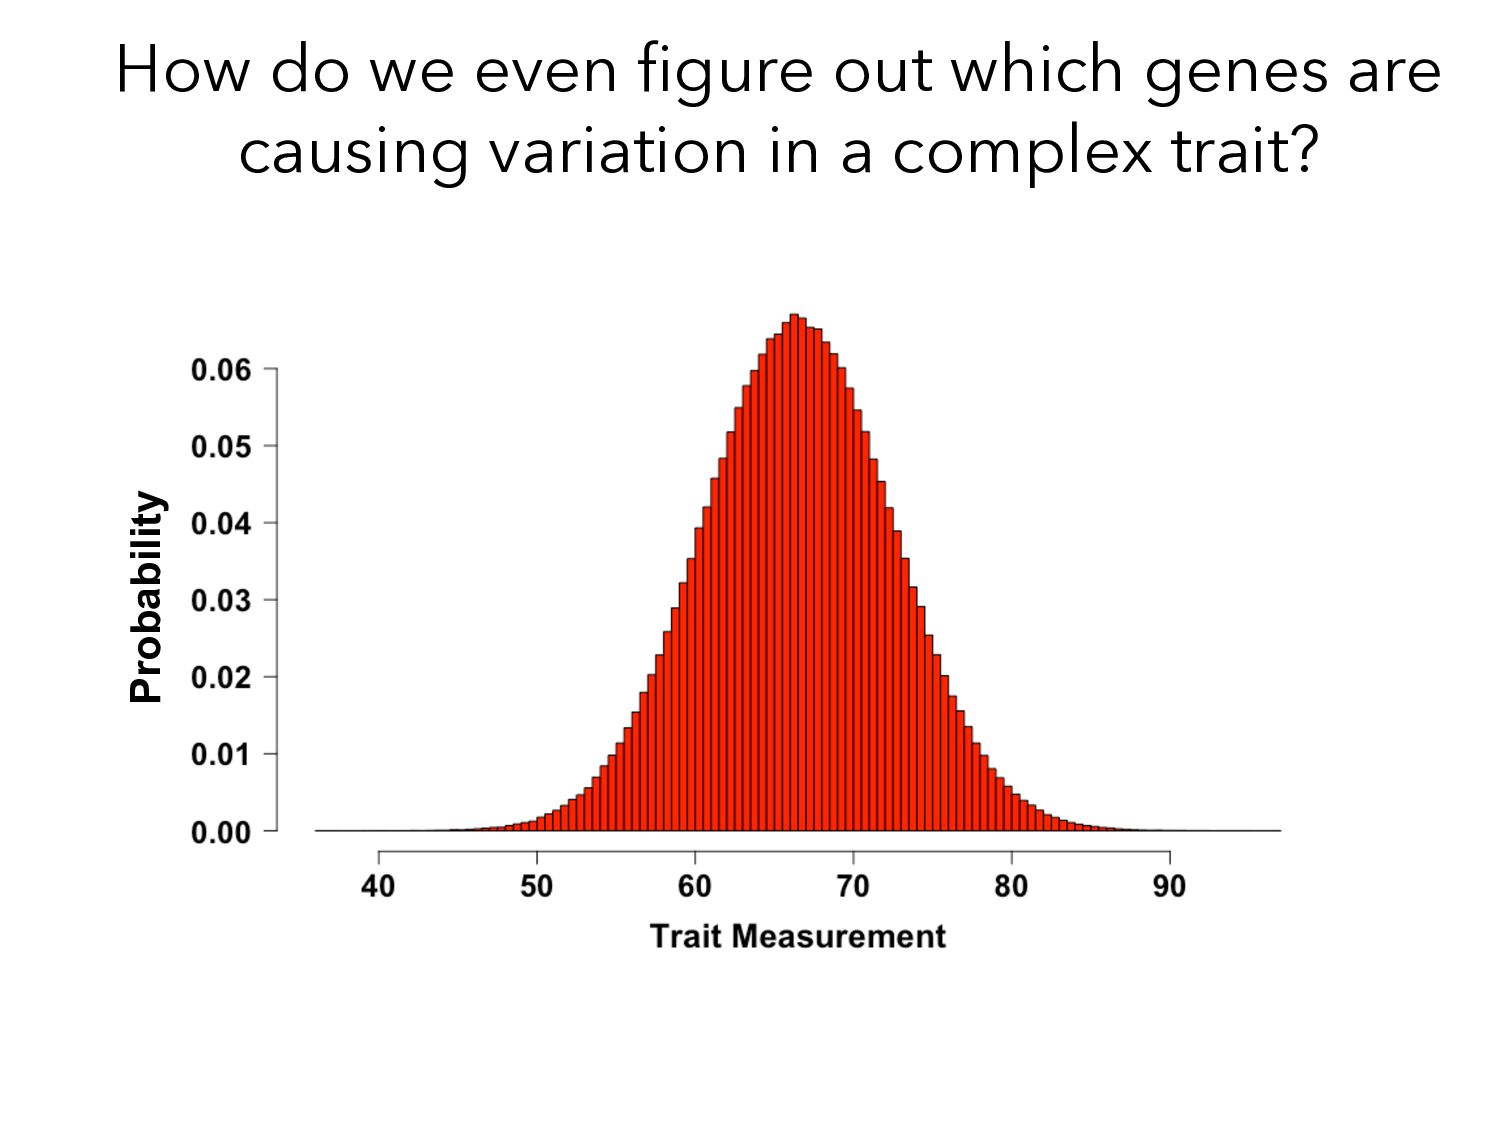
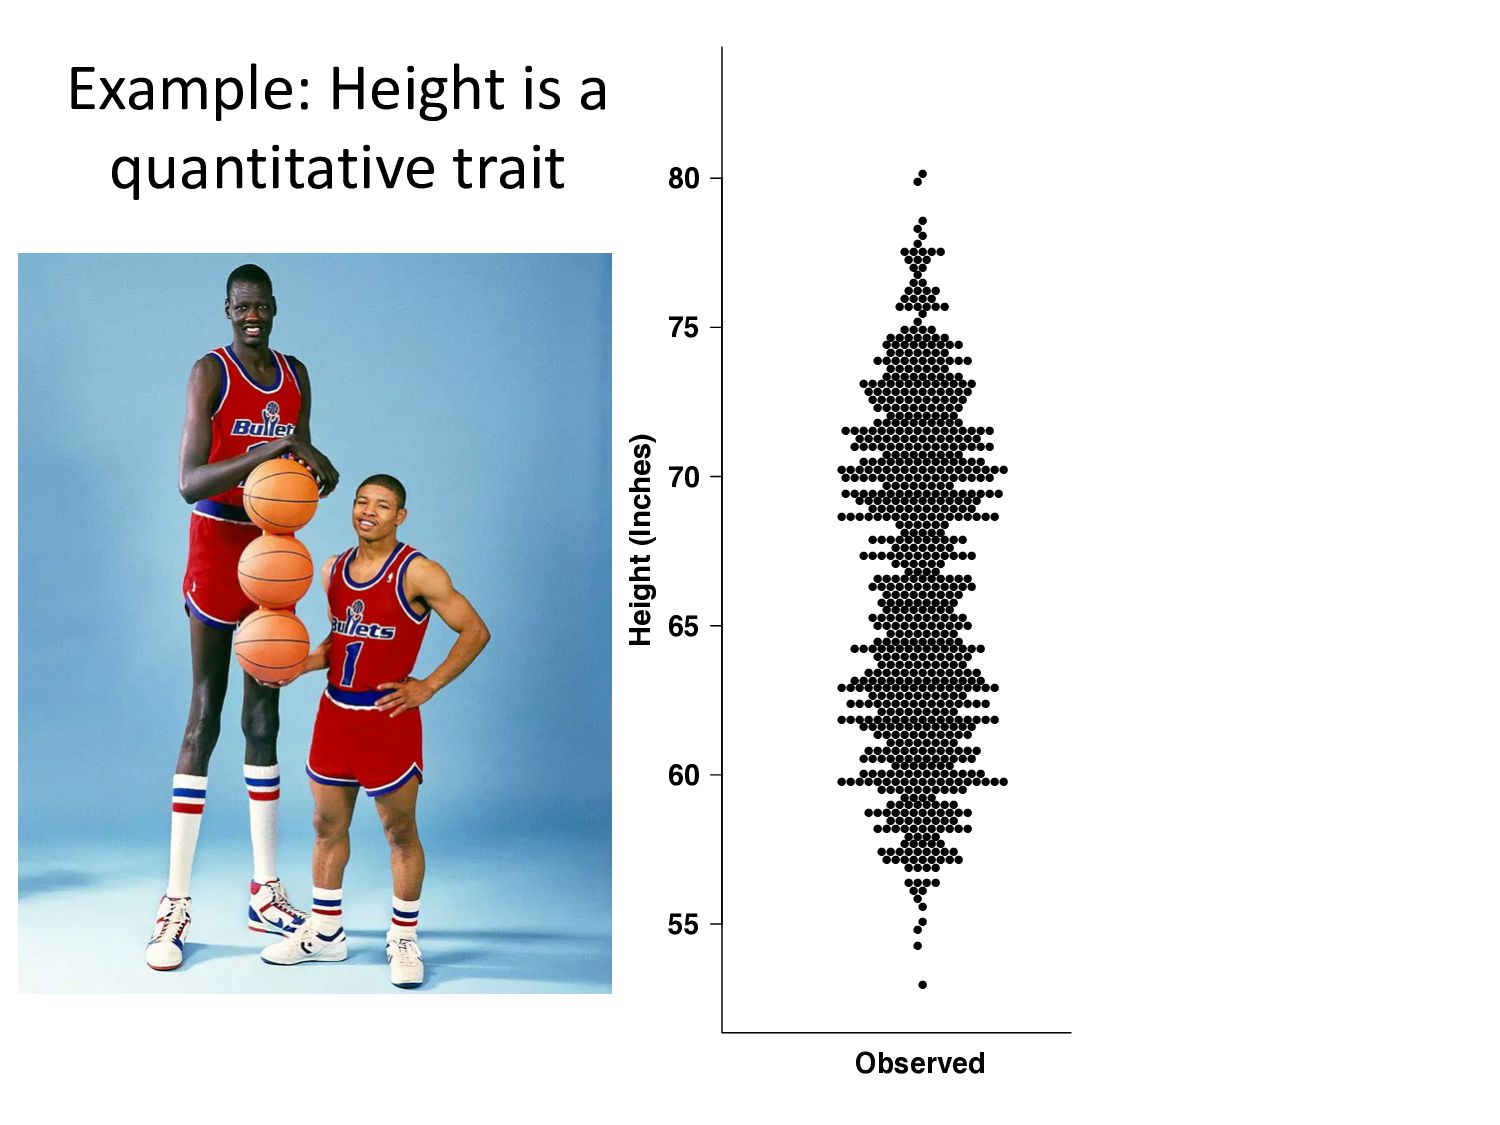
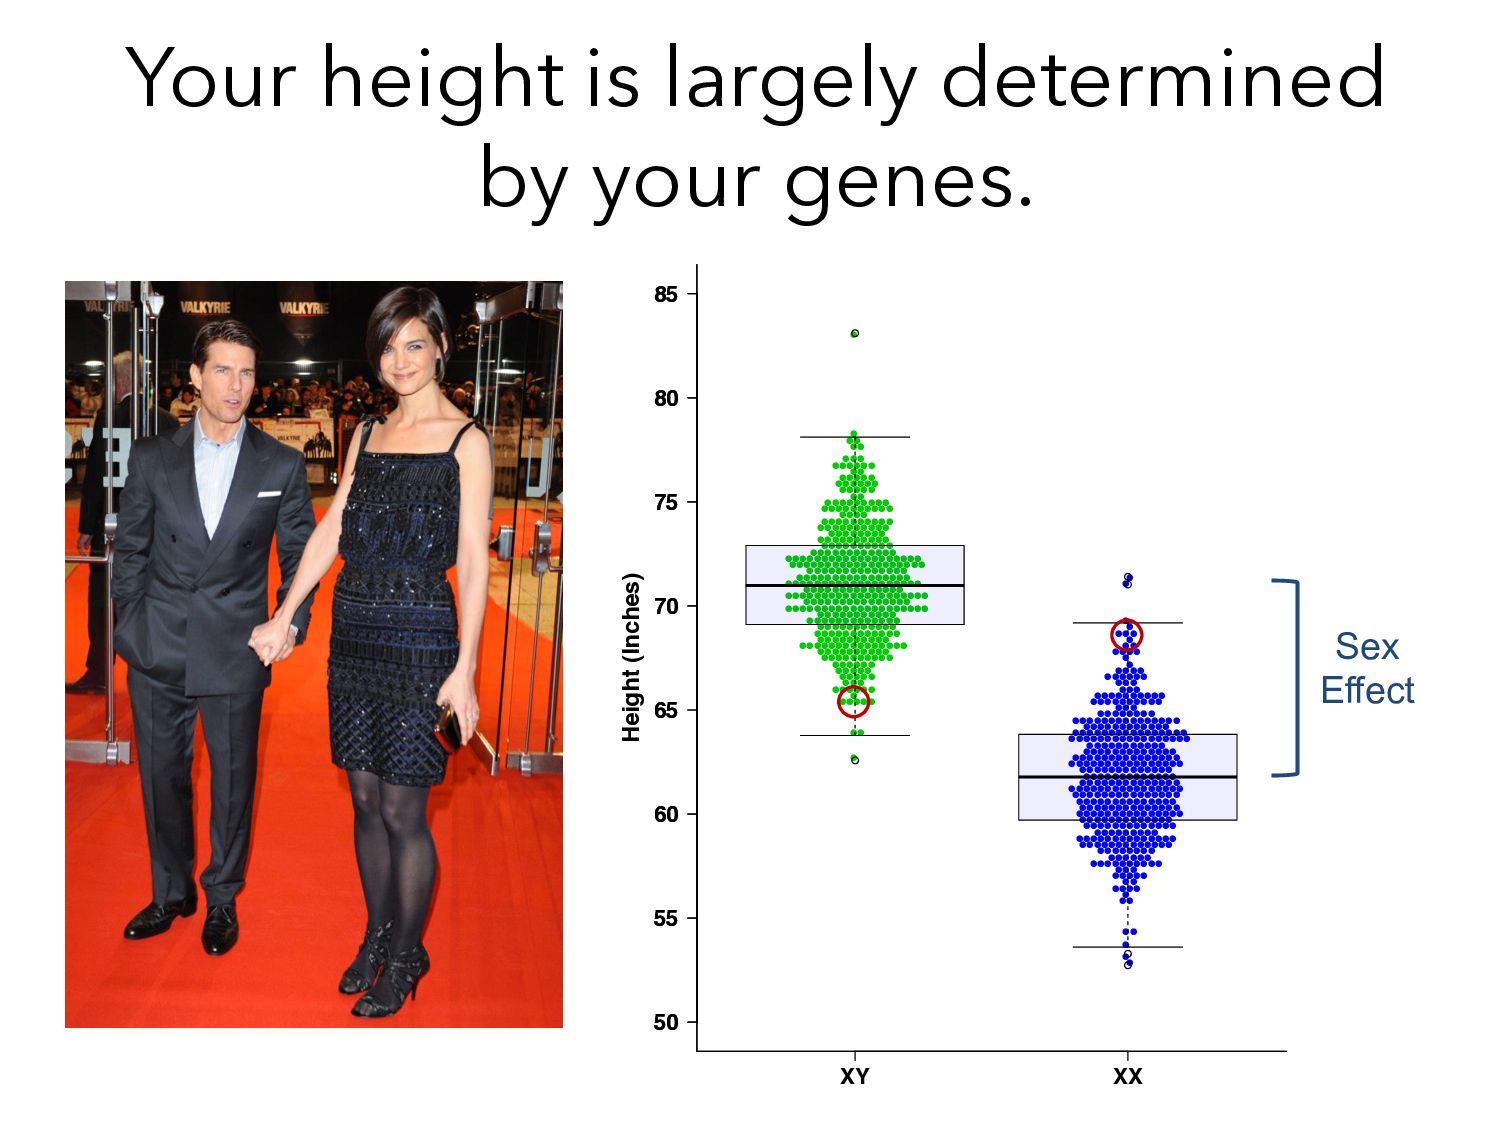
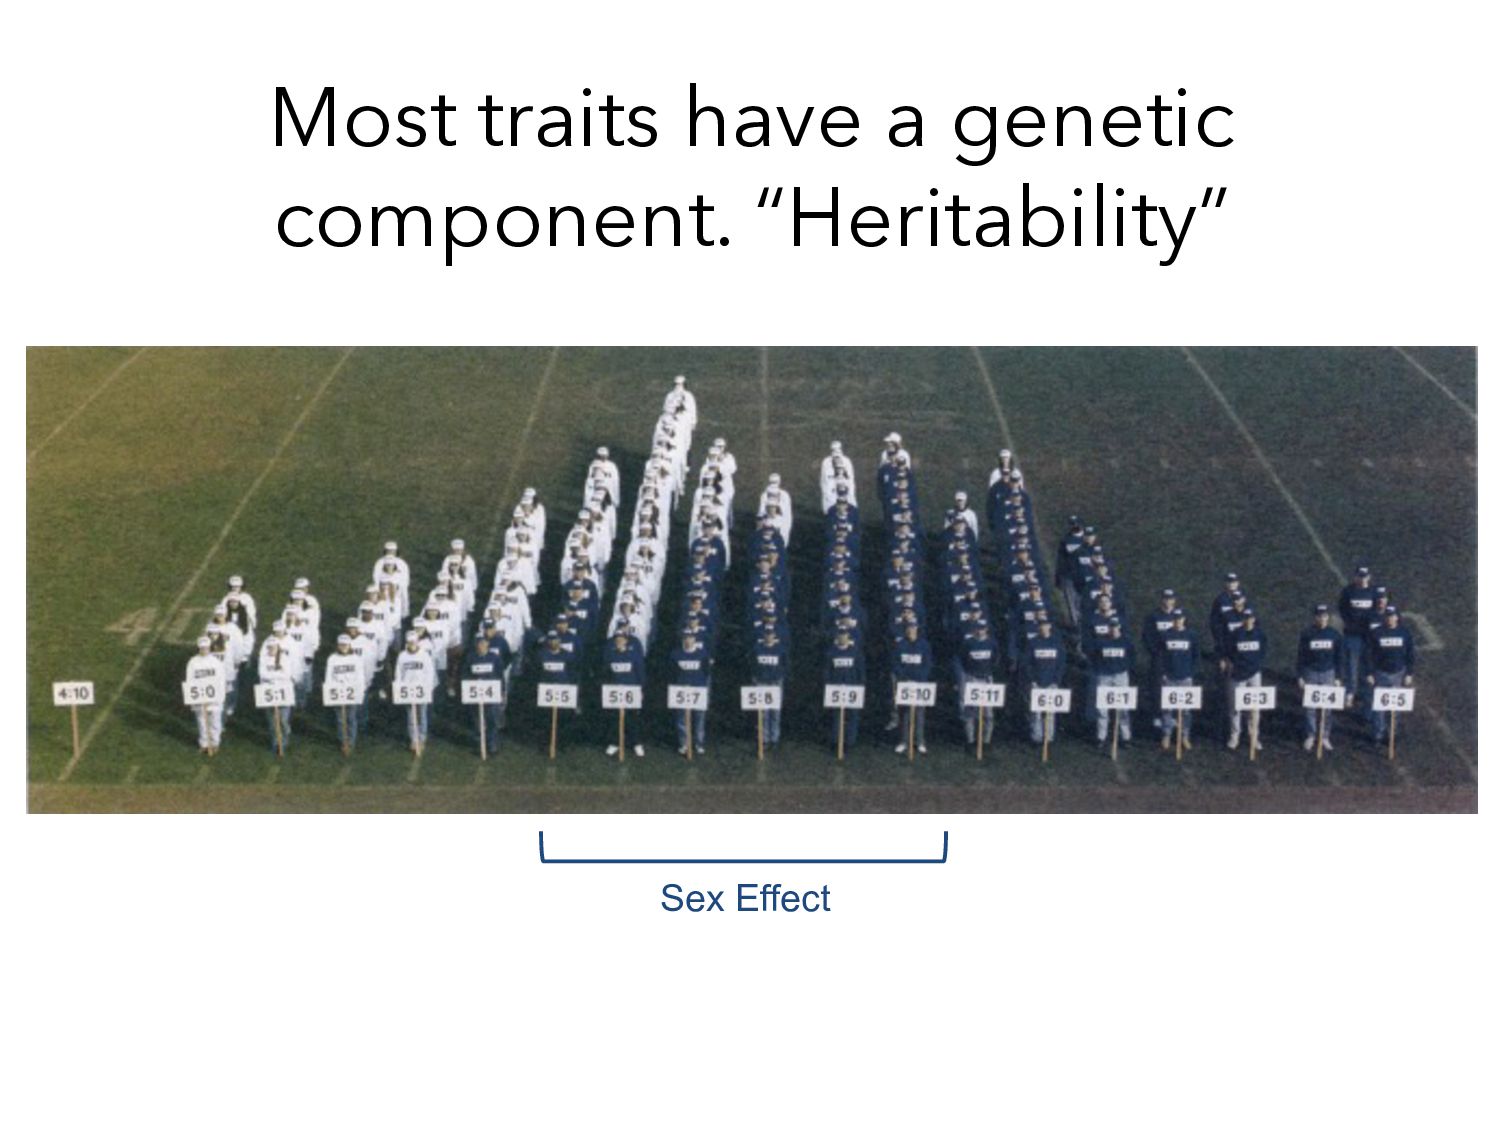
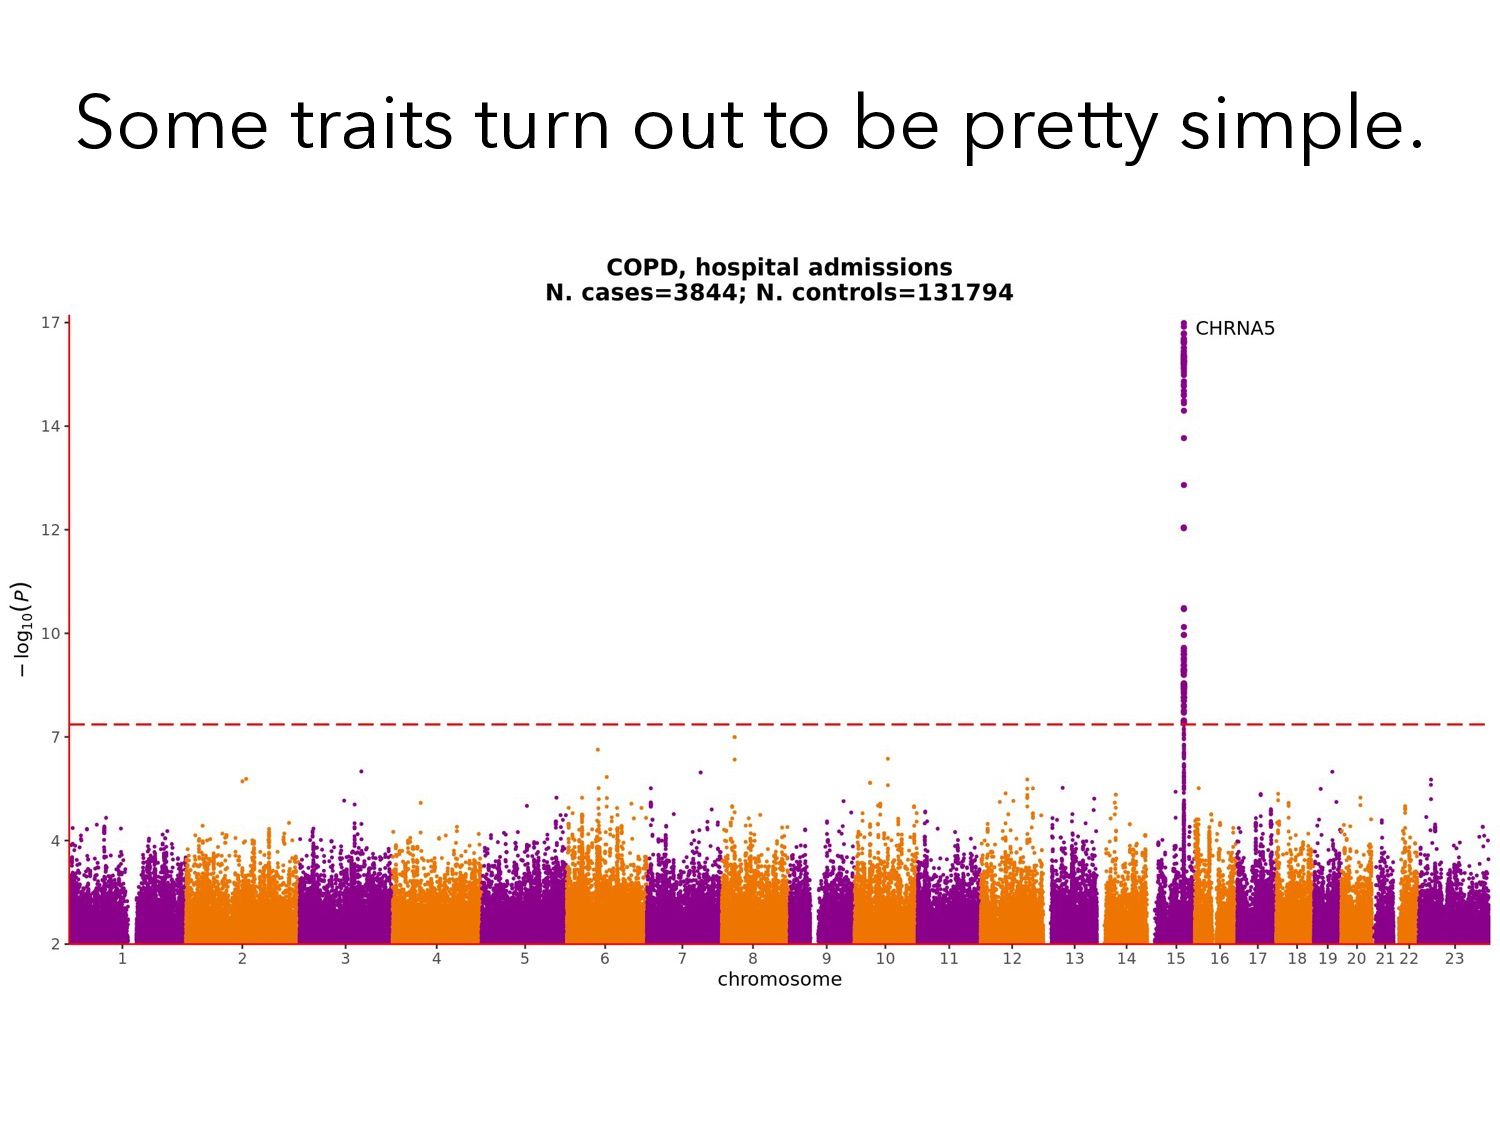
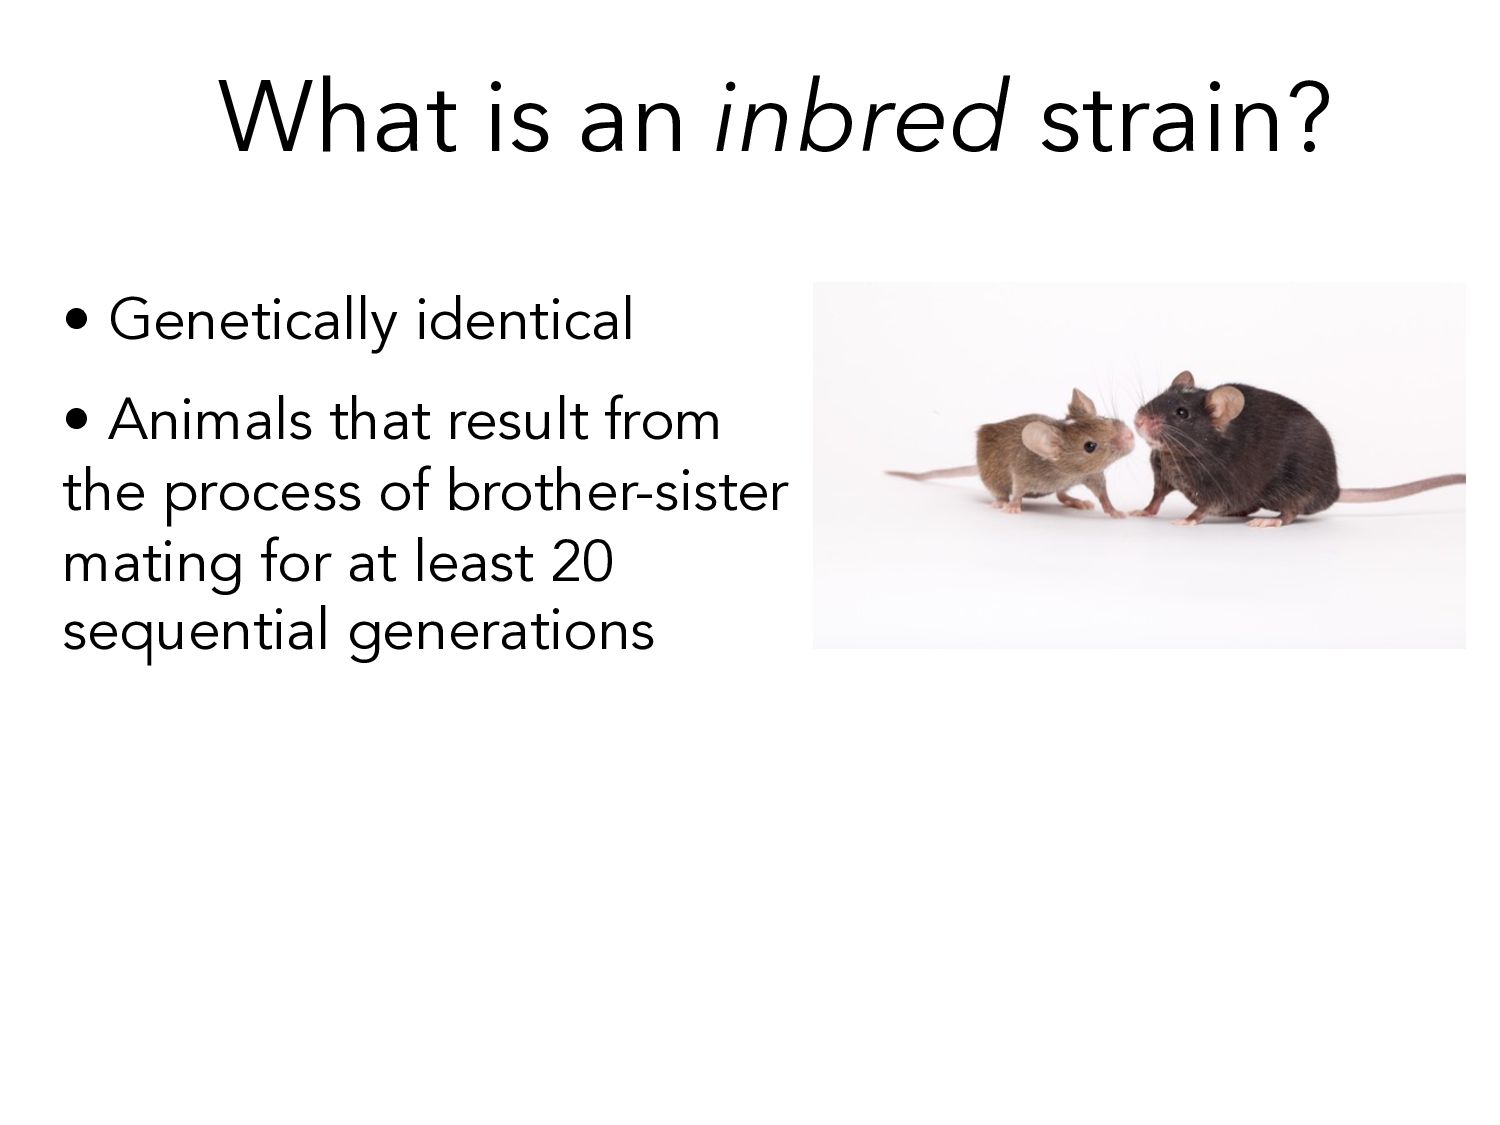
of your personal nature. In science, trait refers to a characteristic that is caused by genetics. A disease can be considered a trait. Traits can be classified by their inheritance pattern. Simple trait – Arises from mutations in a single gene. = “Mendelian” trait = “Binary” trait Complex trait – Affected by many genes. = “Quantitative” trait = “Multifactorial” trait
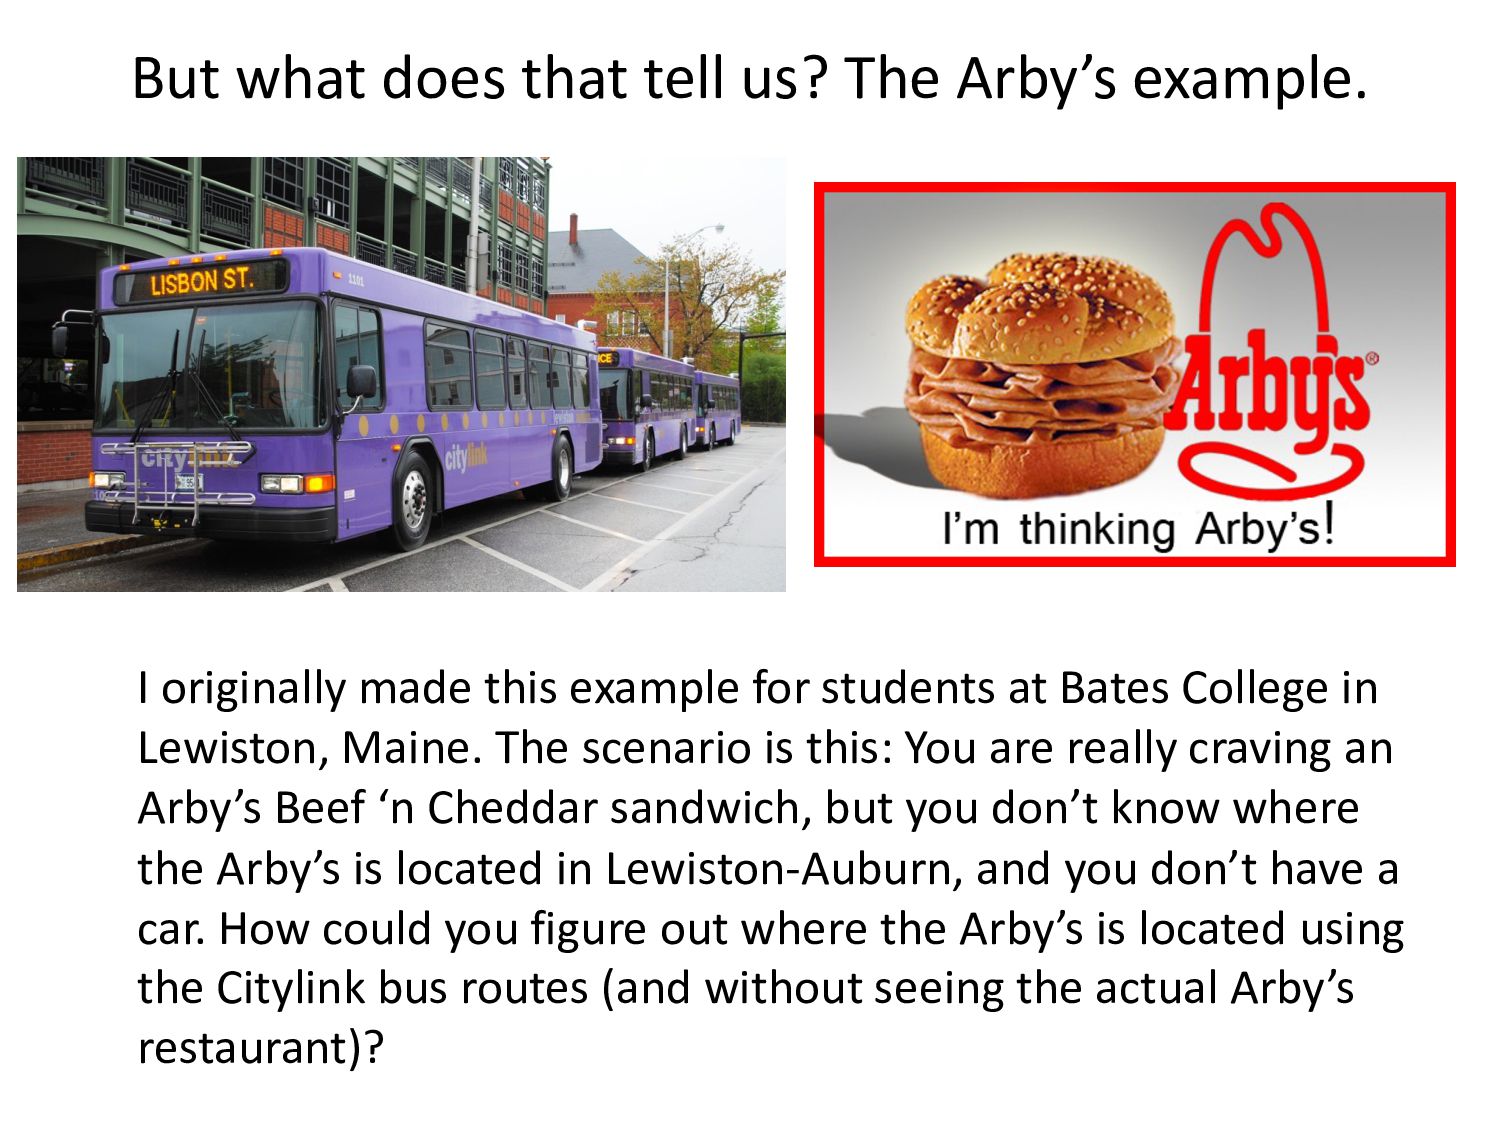
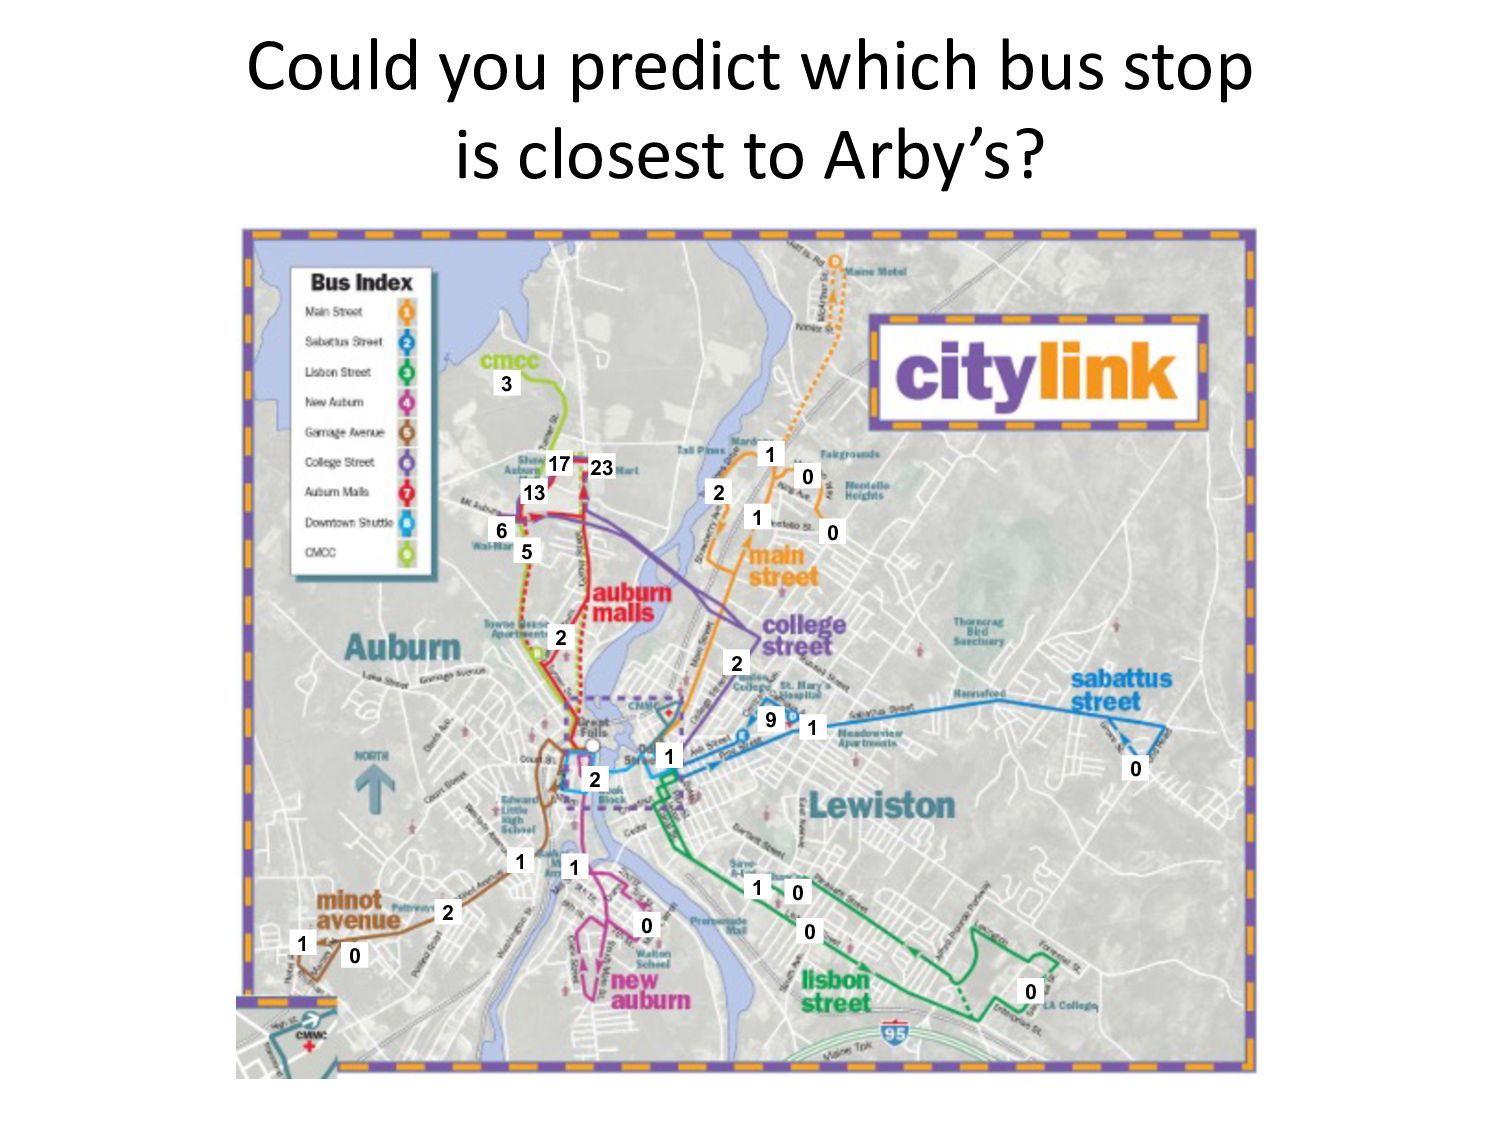
originally made this example for students at Bates College in Lewiston, Maine. The scenario is this: You are really craving an Arby’s Beef ‘n Cheddar sandwich, but you don’t know where the Arby’s is located in Lewiston-Auburn, and you don’t have a car. How could you figure out where the Arby’s is located using the Citylink bus routes (and without seeing the actual Arby’s restaurant)?
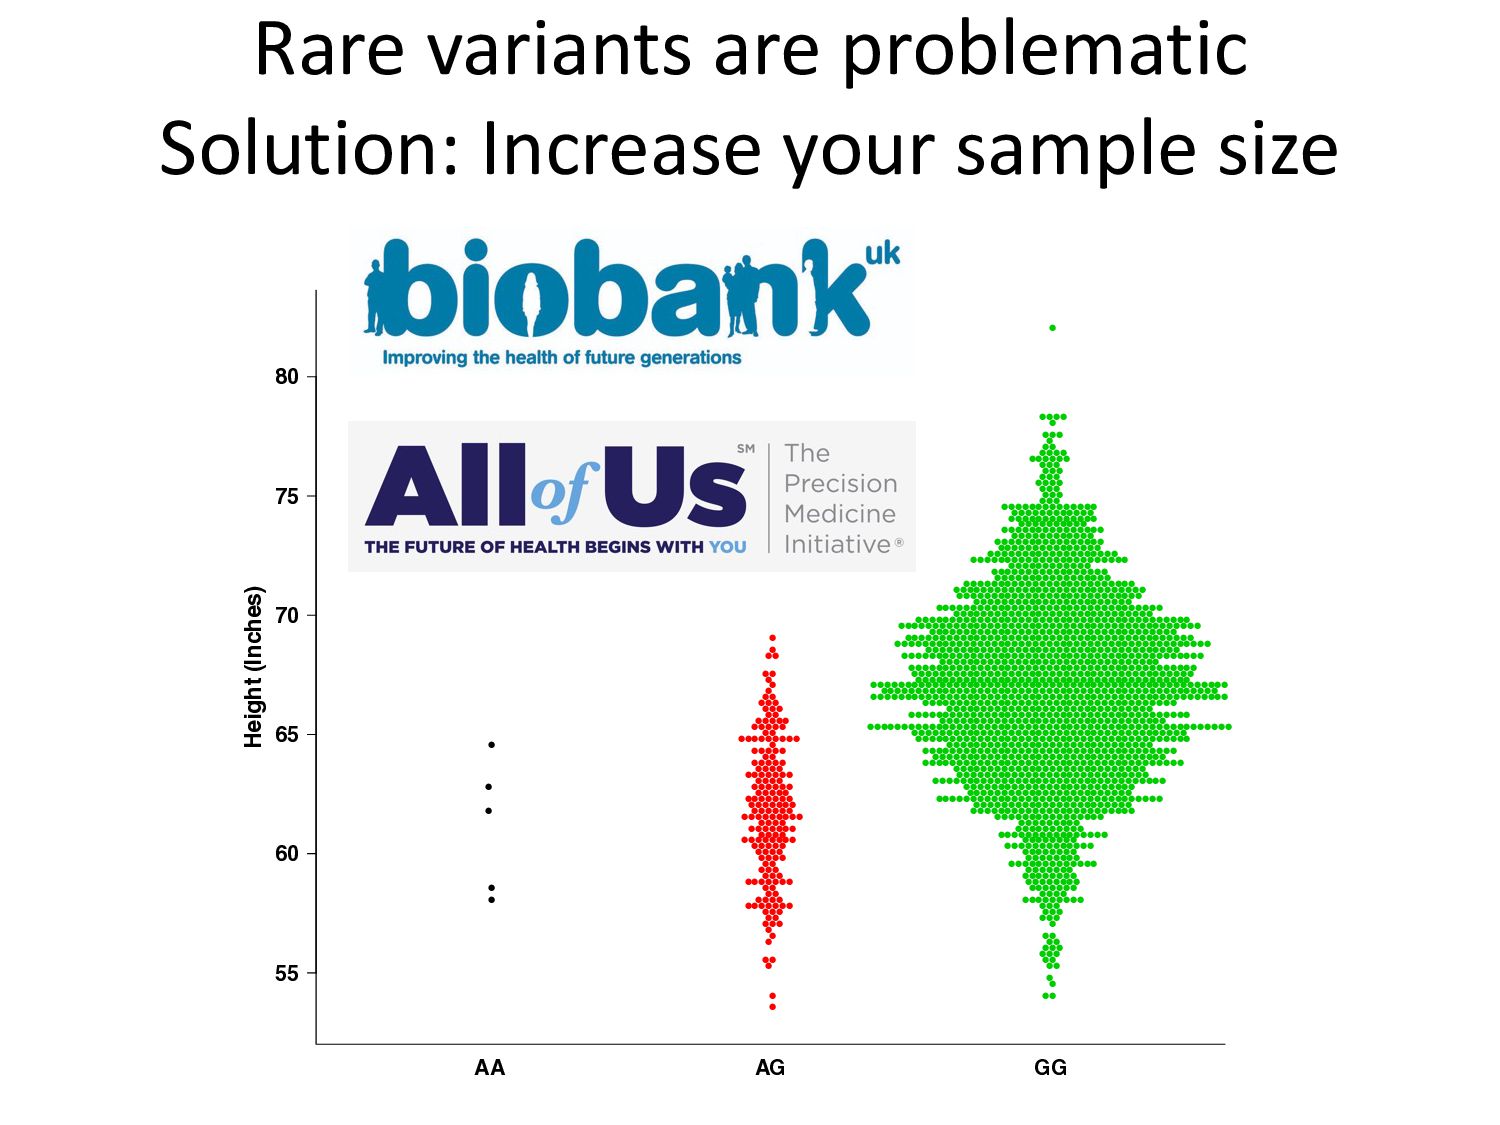
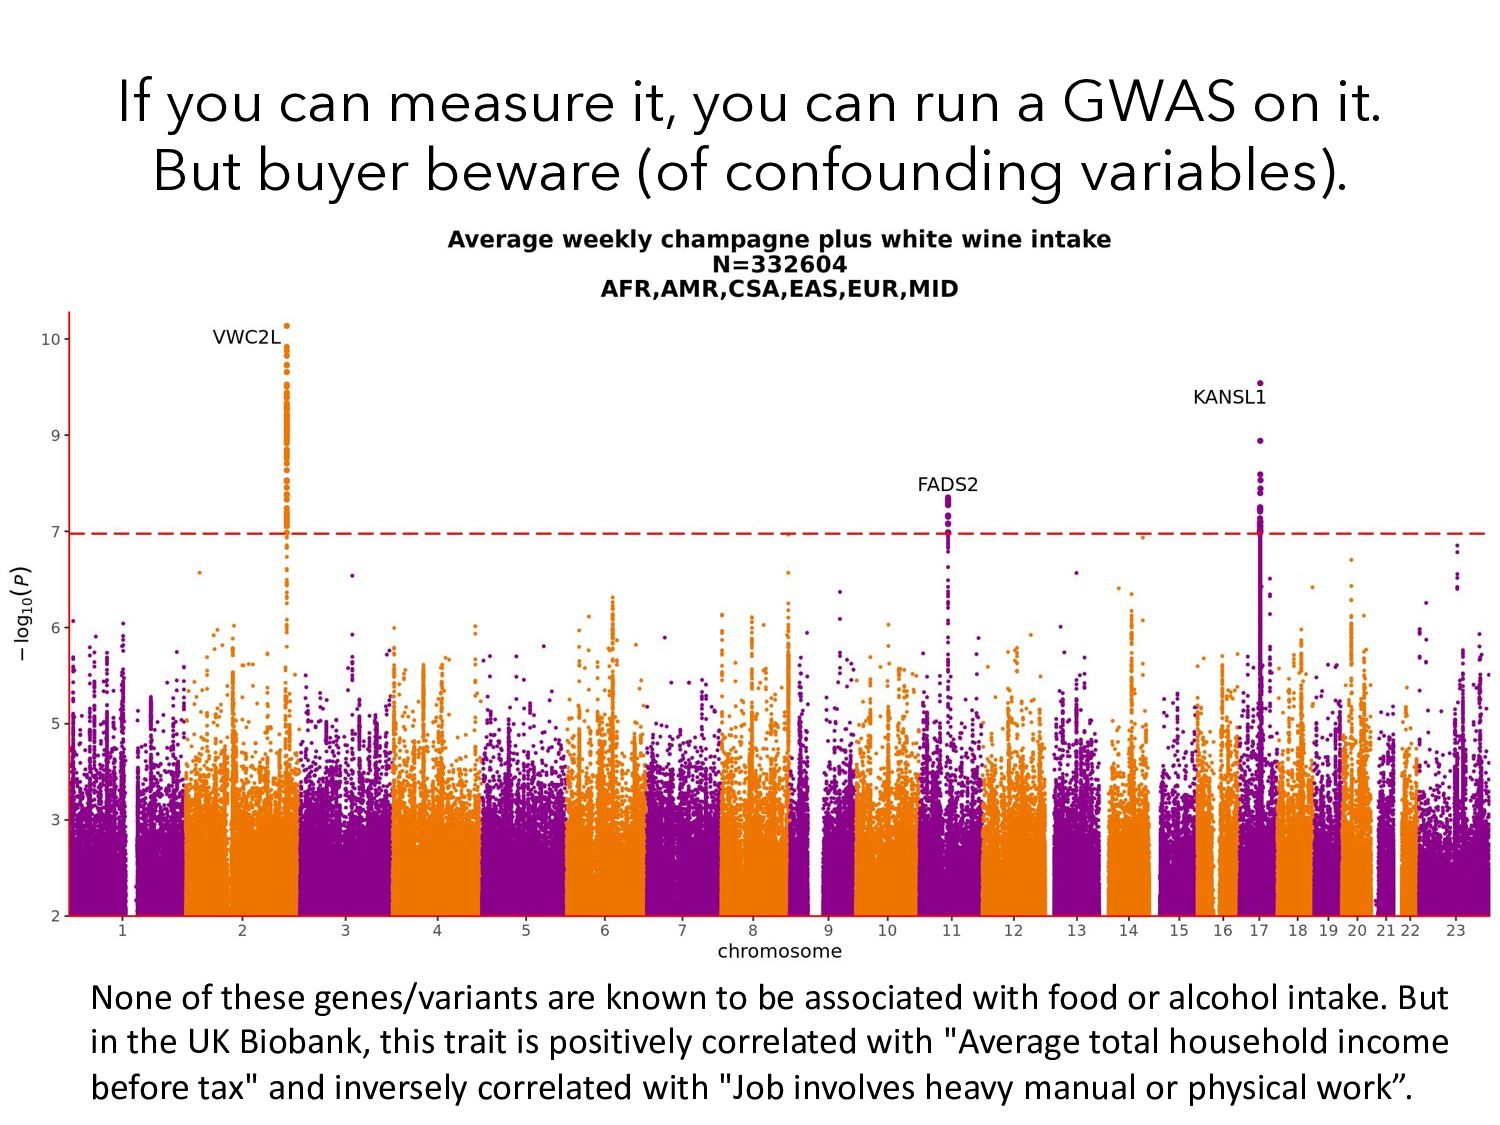
on it. But buyer beware (of confounding variables). None of these genes/variants are known to be associated with food or alcohol intake. But in the UK Biobank, this trait is positively correlated with "Average total household income before tax" and inversely correlated with "Job involves heavy manual or physical work”.
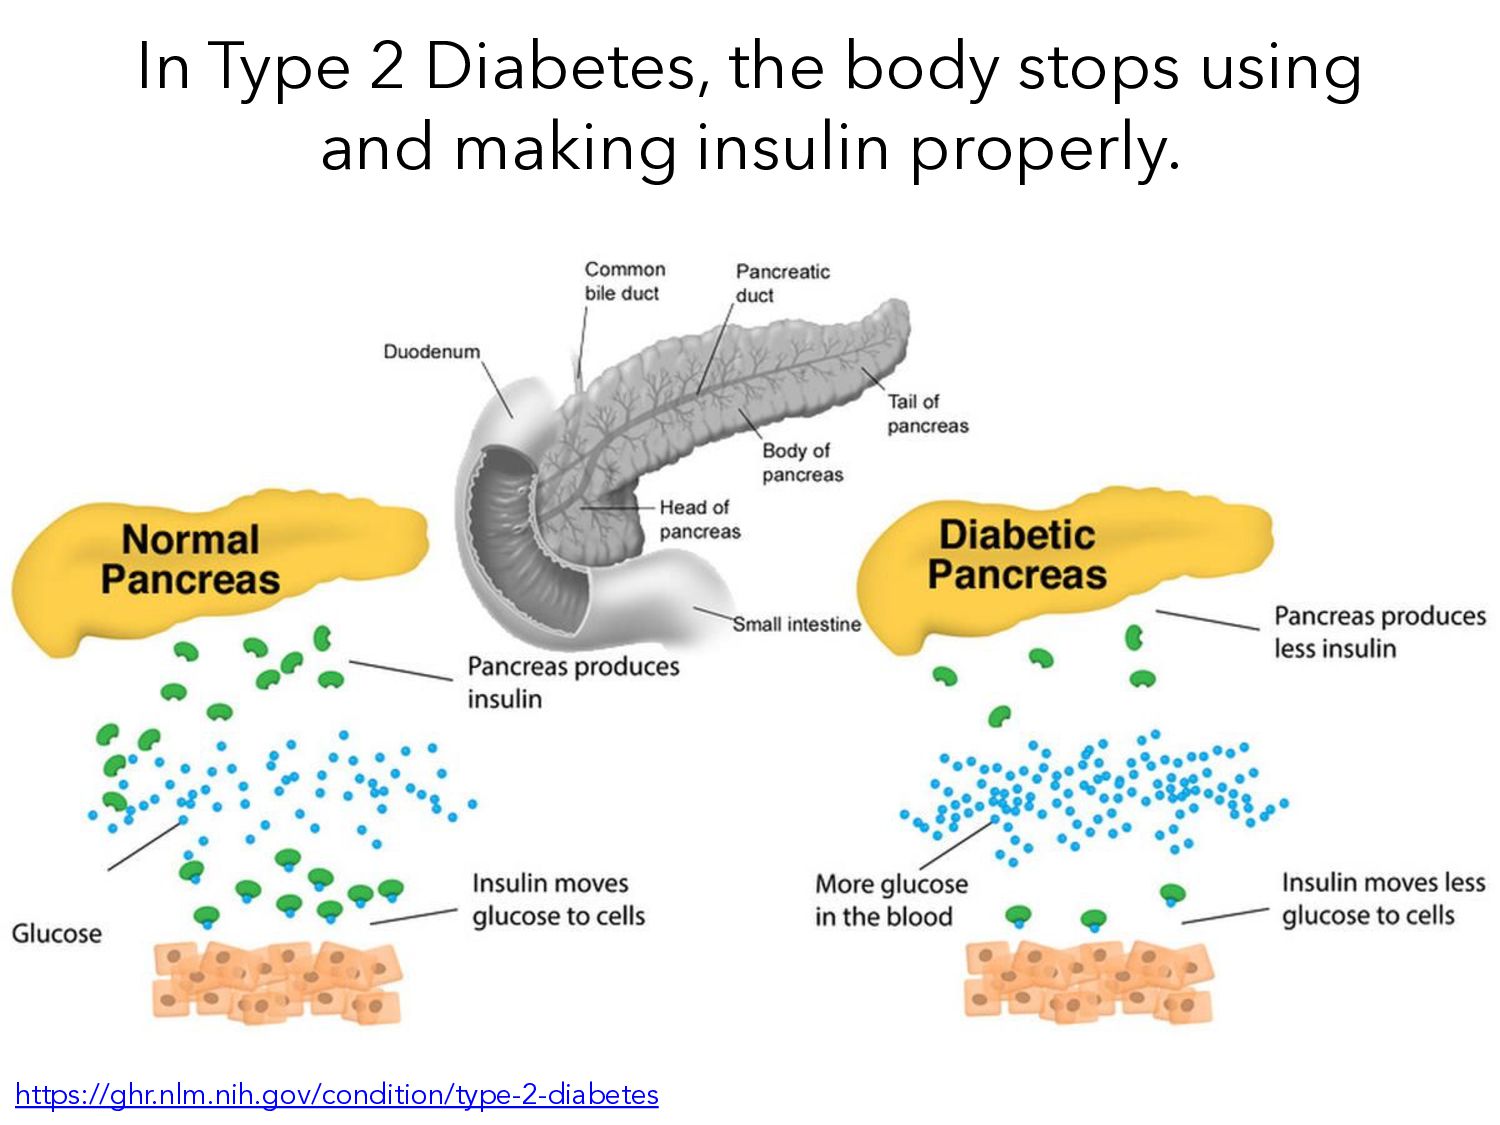
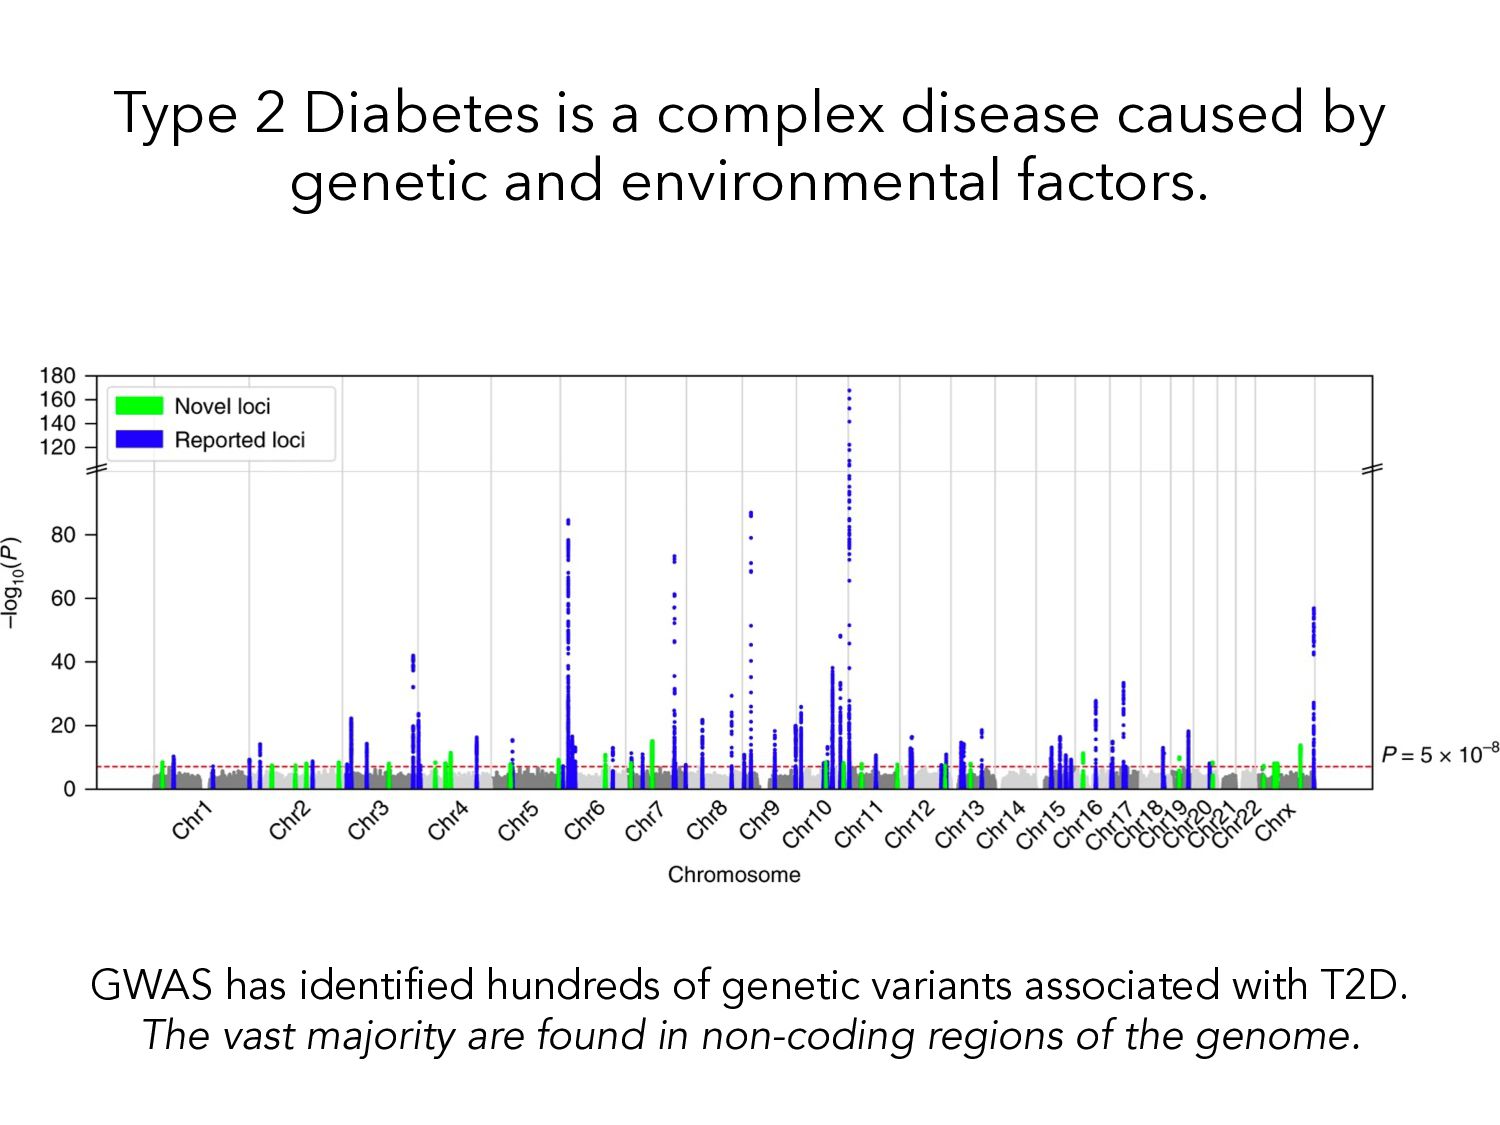
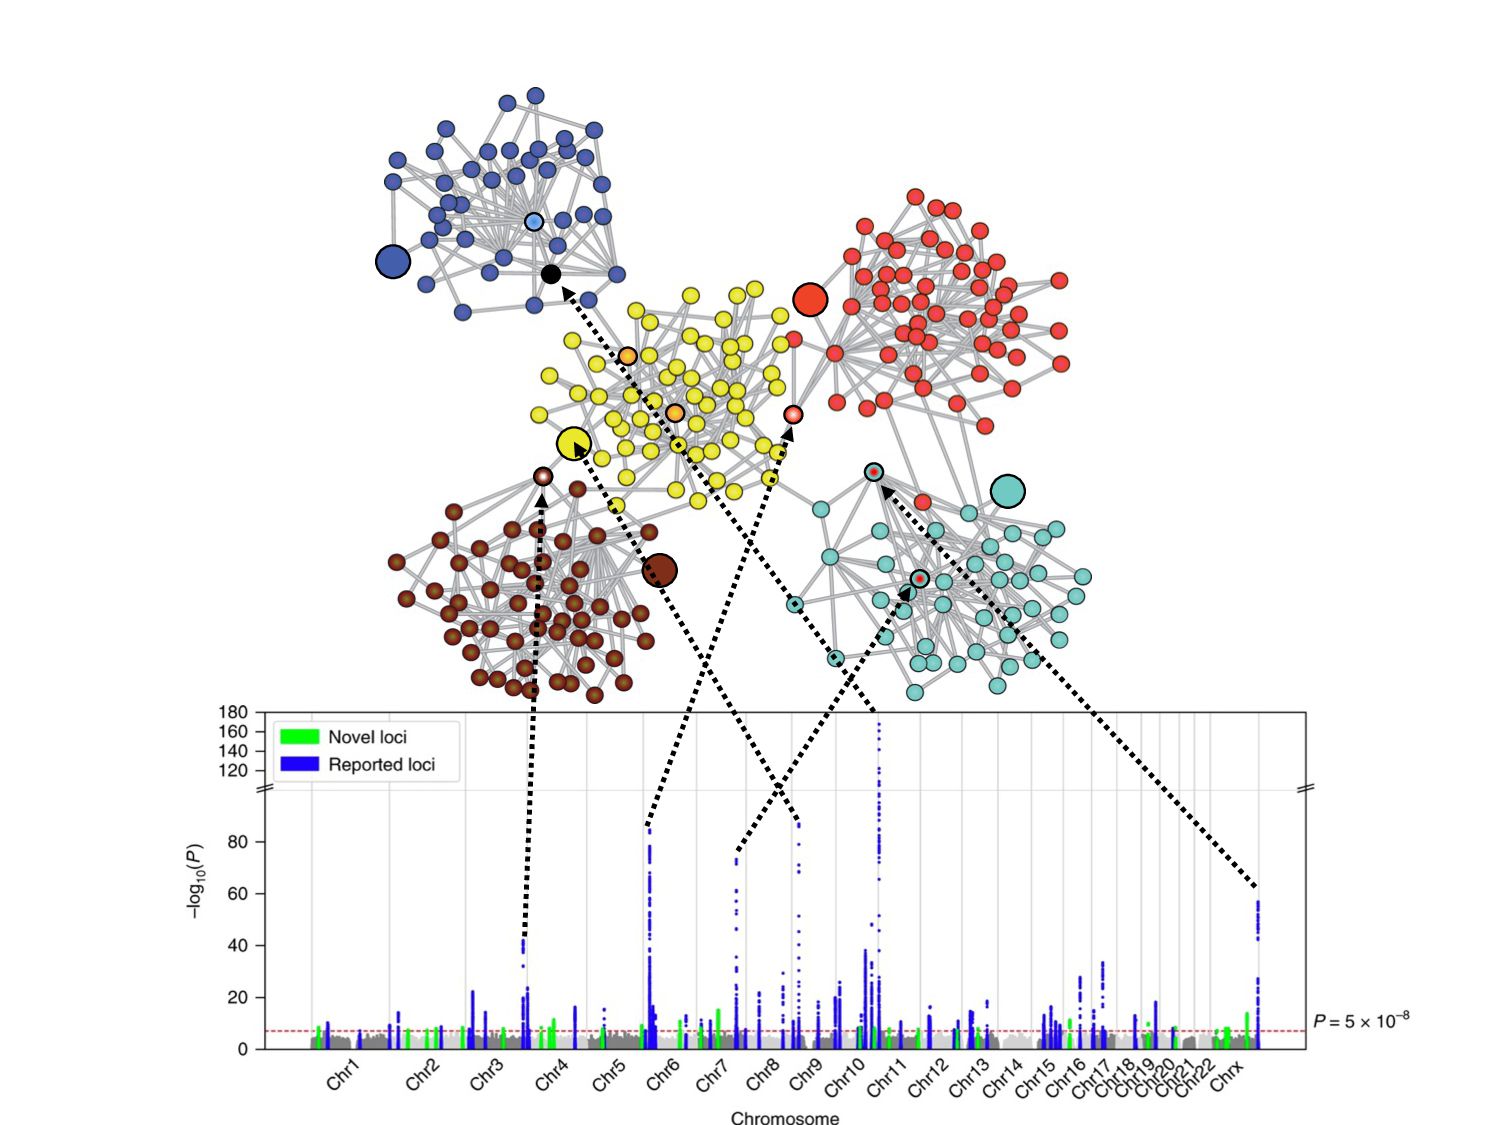
and environmental factors. GWAS has identified hundreds of genetic variants associated with T2D. The vast majority are found in non-coding regions of the genome.
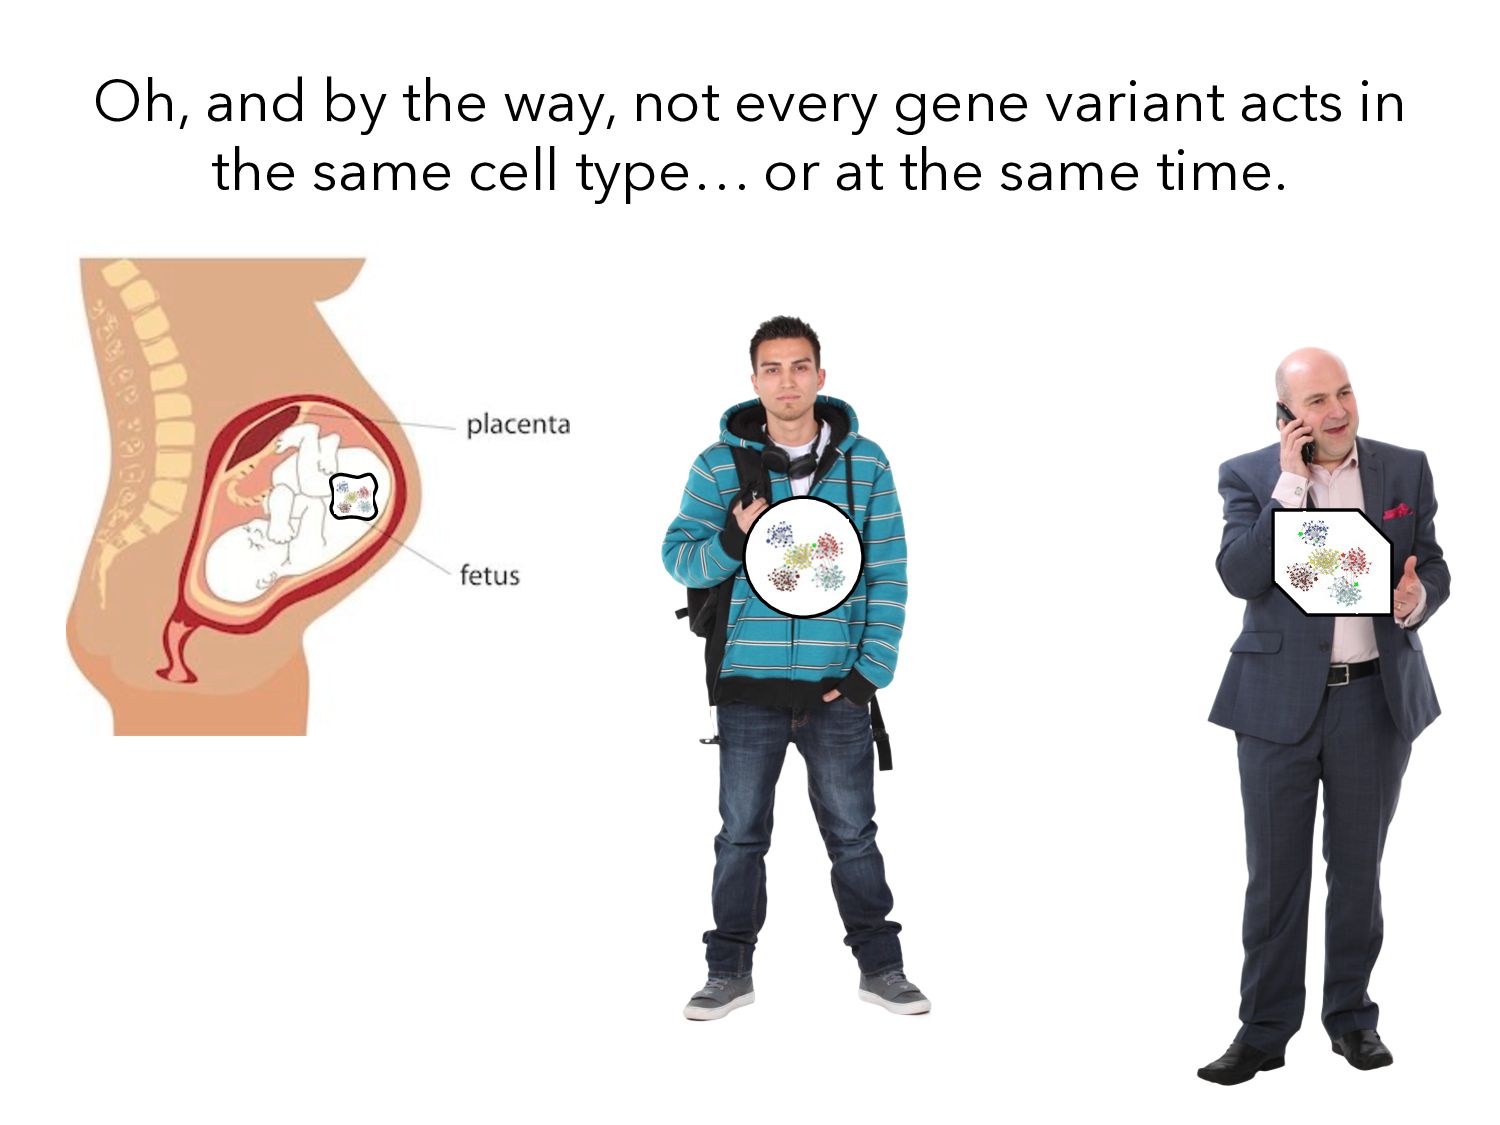
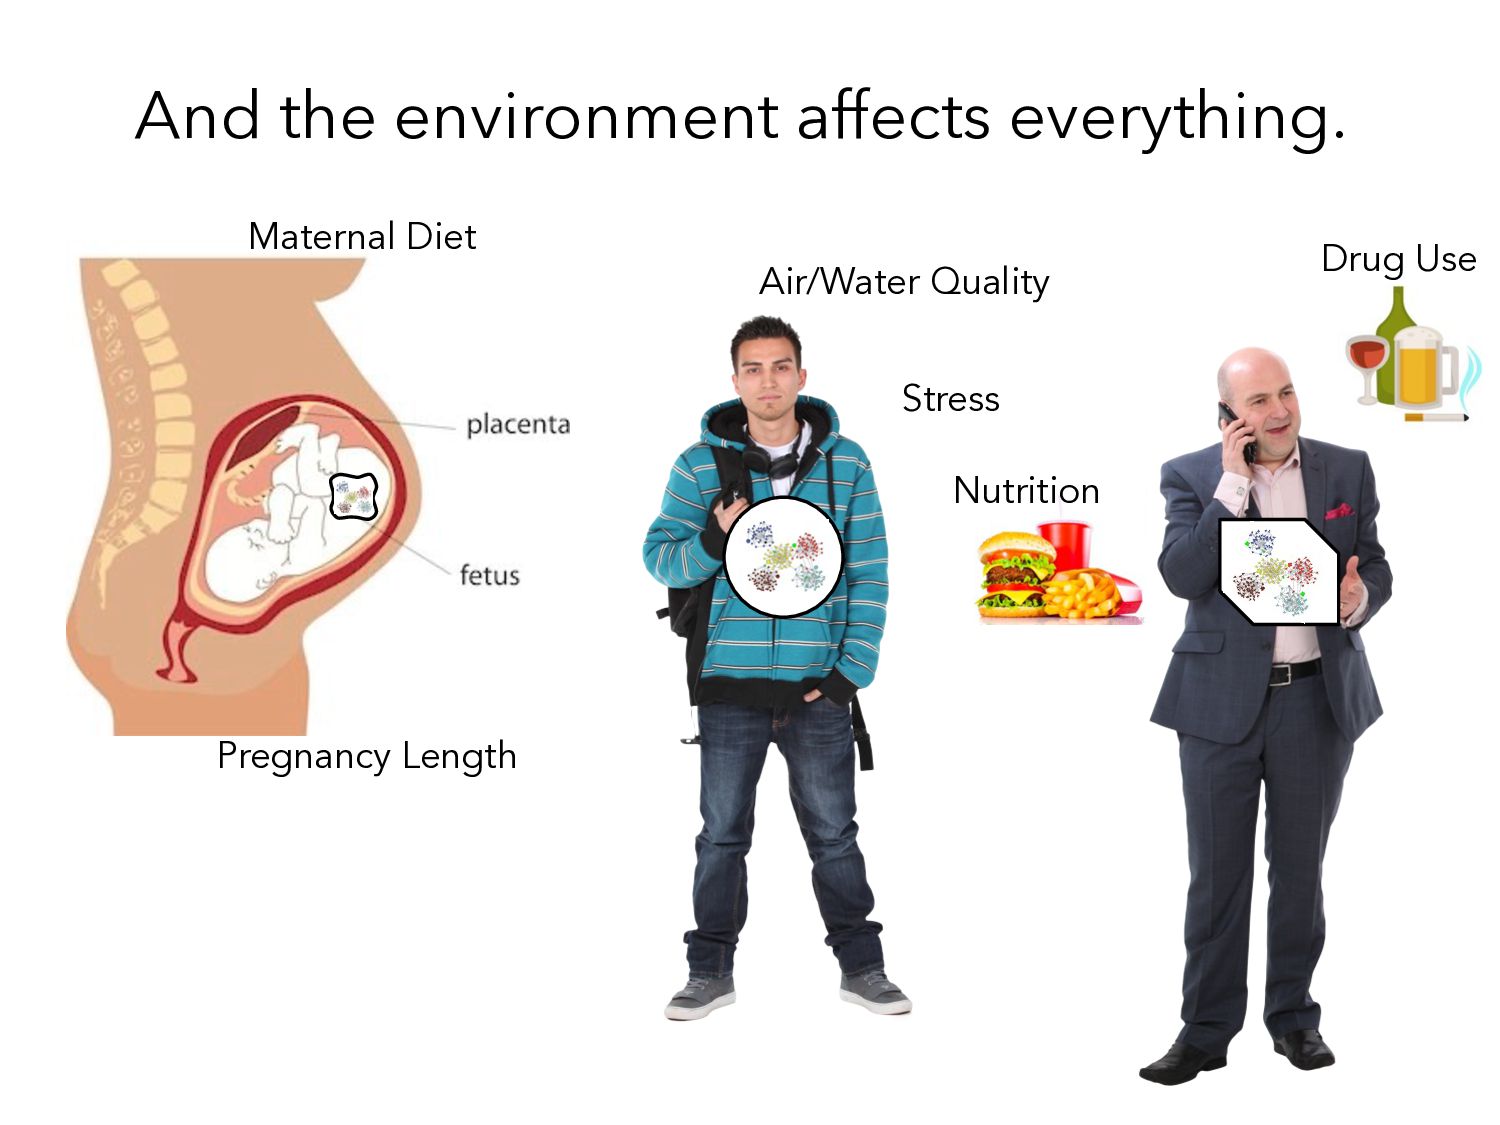
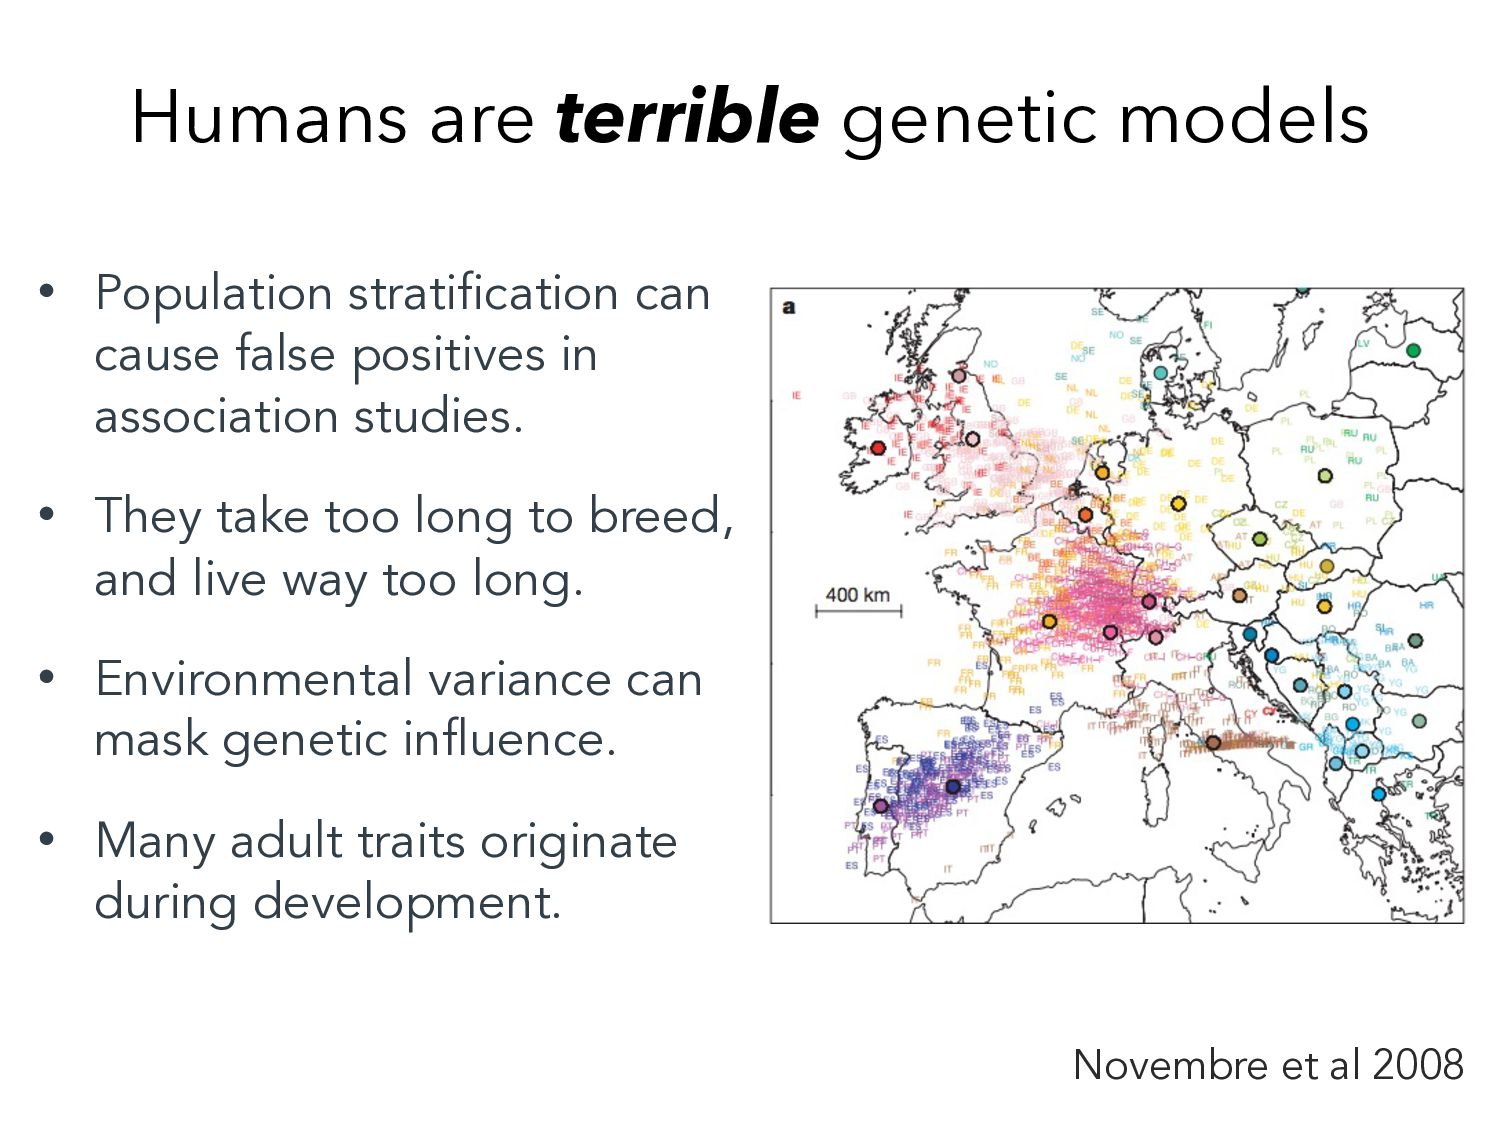
Population stratification can cause false positives in association studies. • They take too long to breed, and live way too long. • Environmental variance can mask genetic influence. • Many adult traits originate during development.
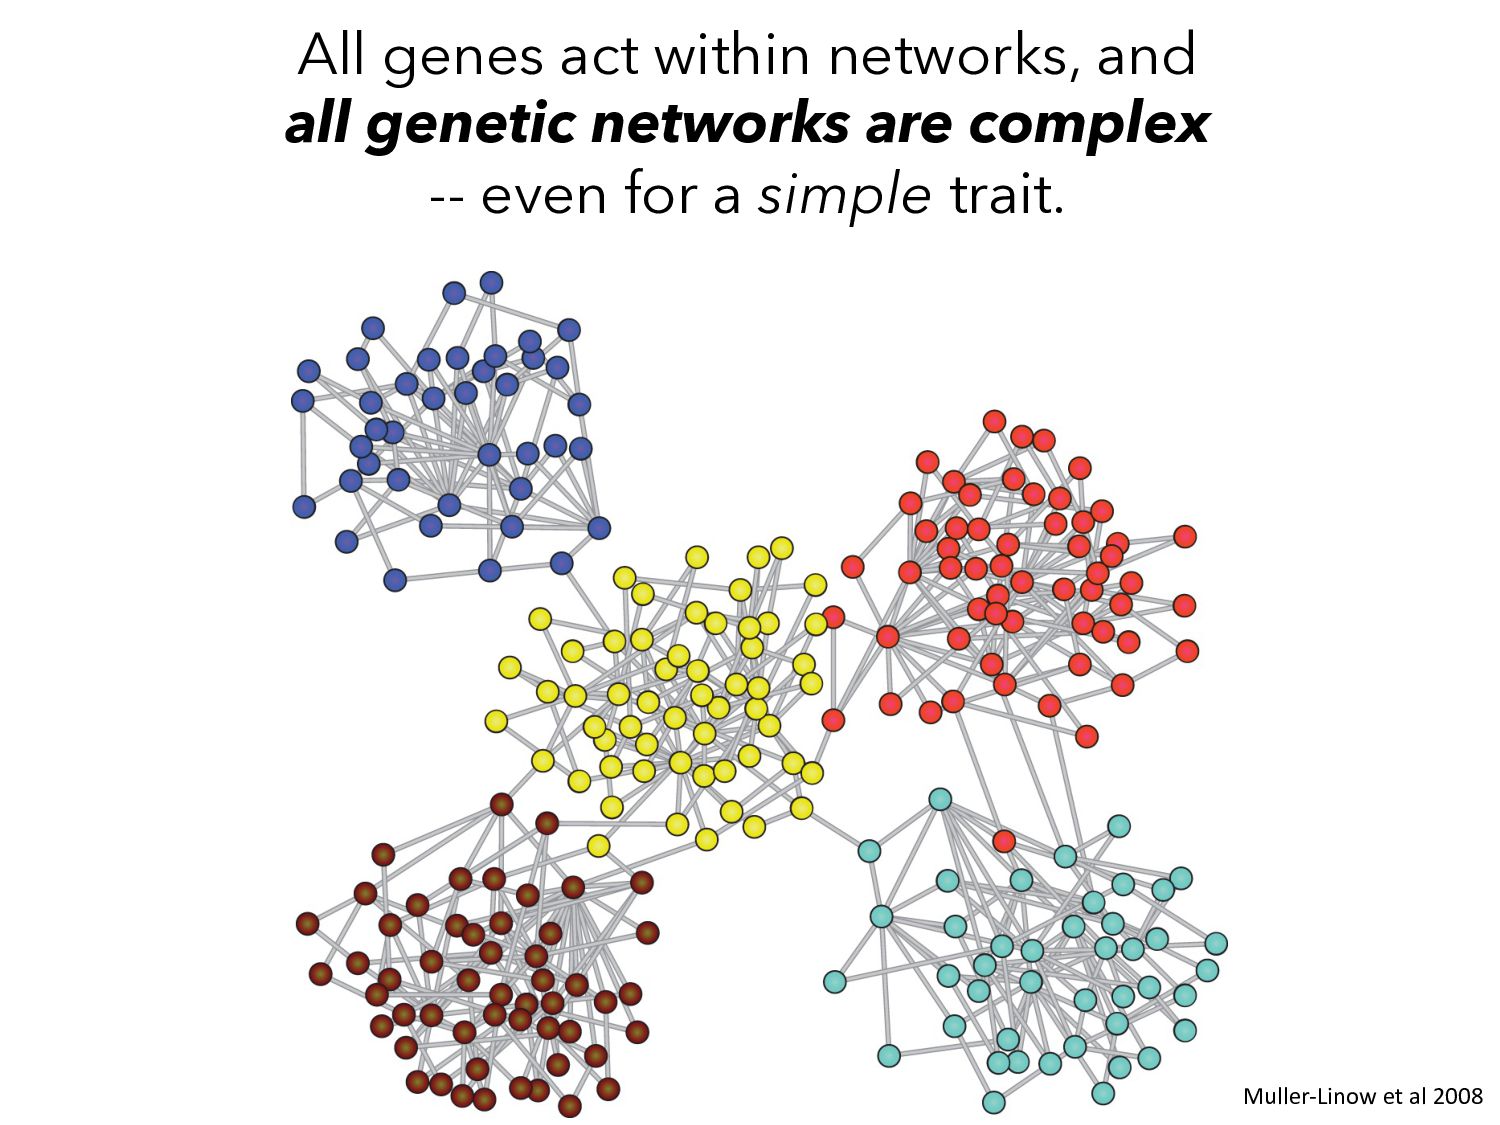
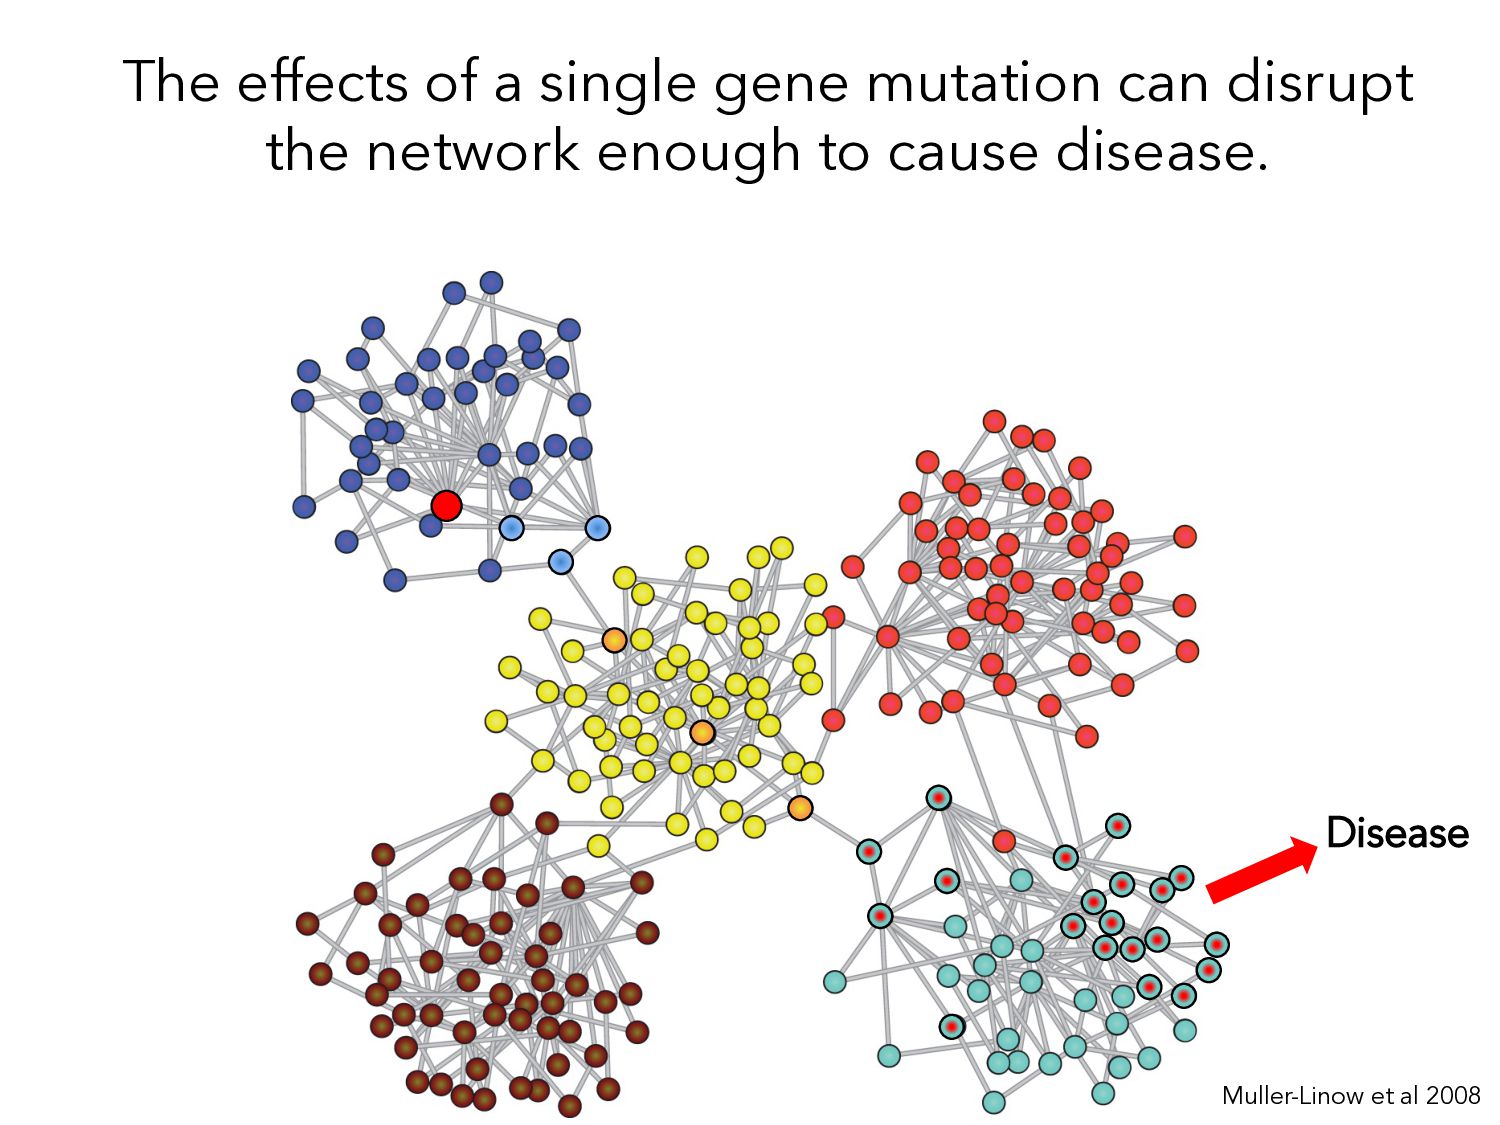
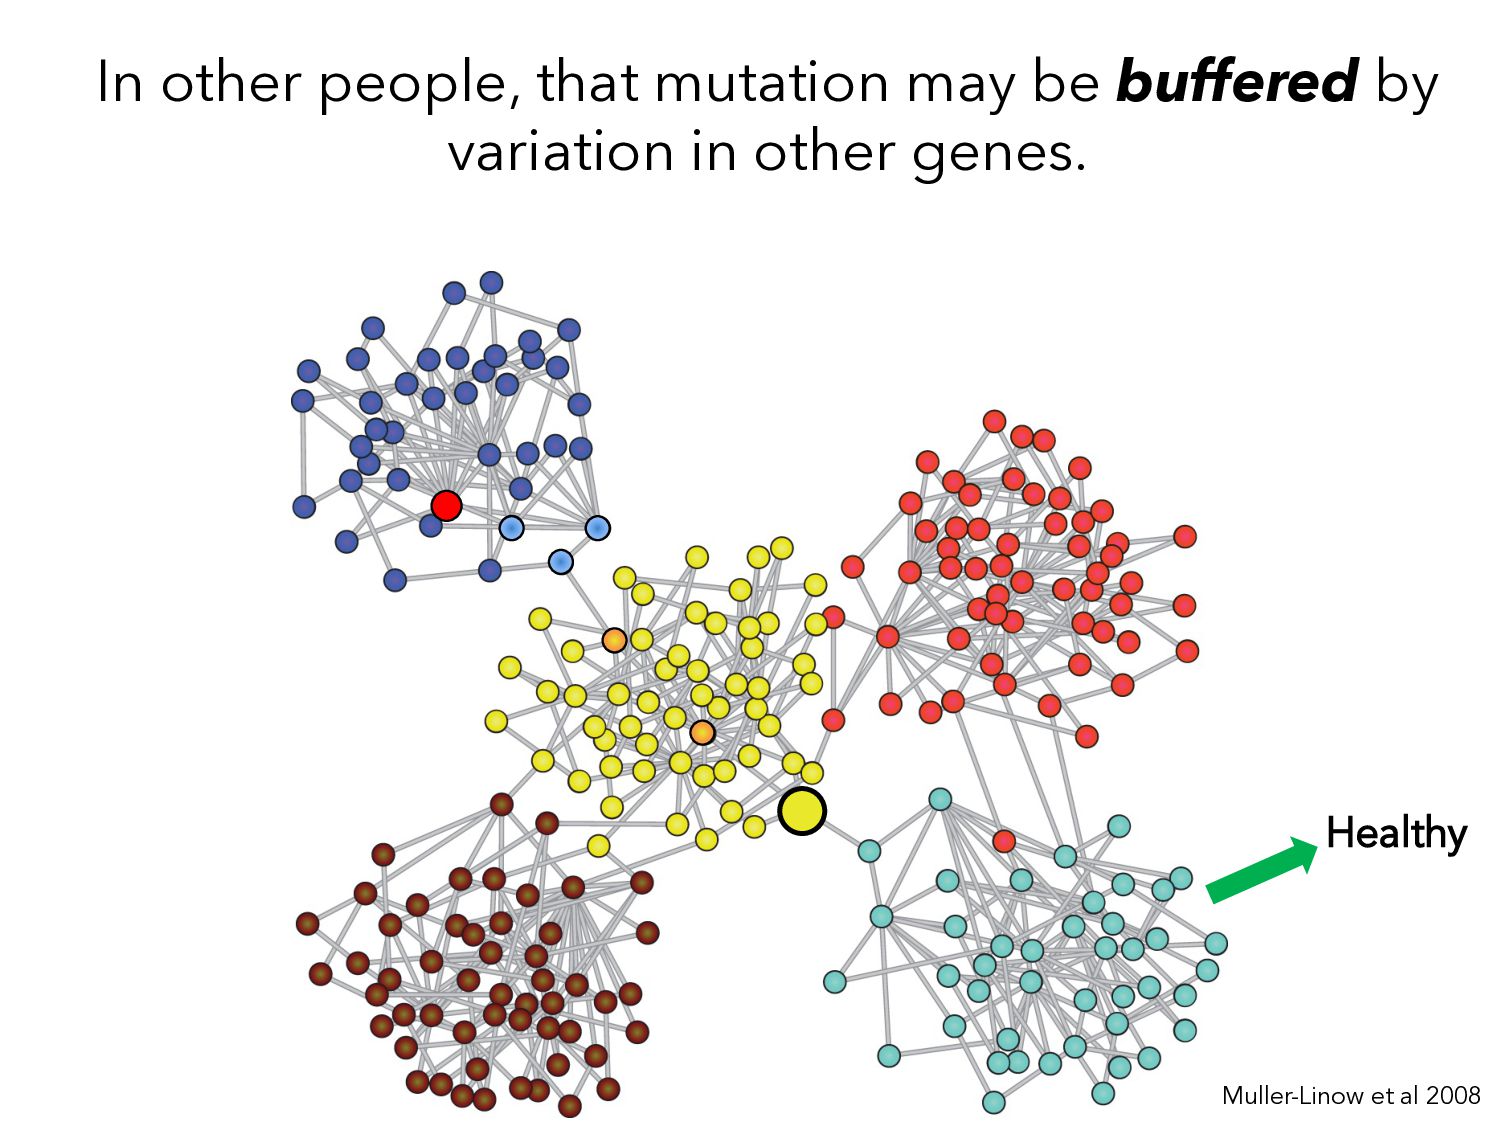
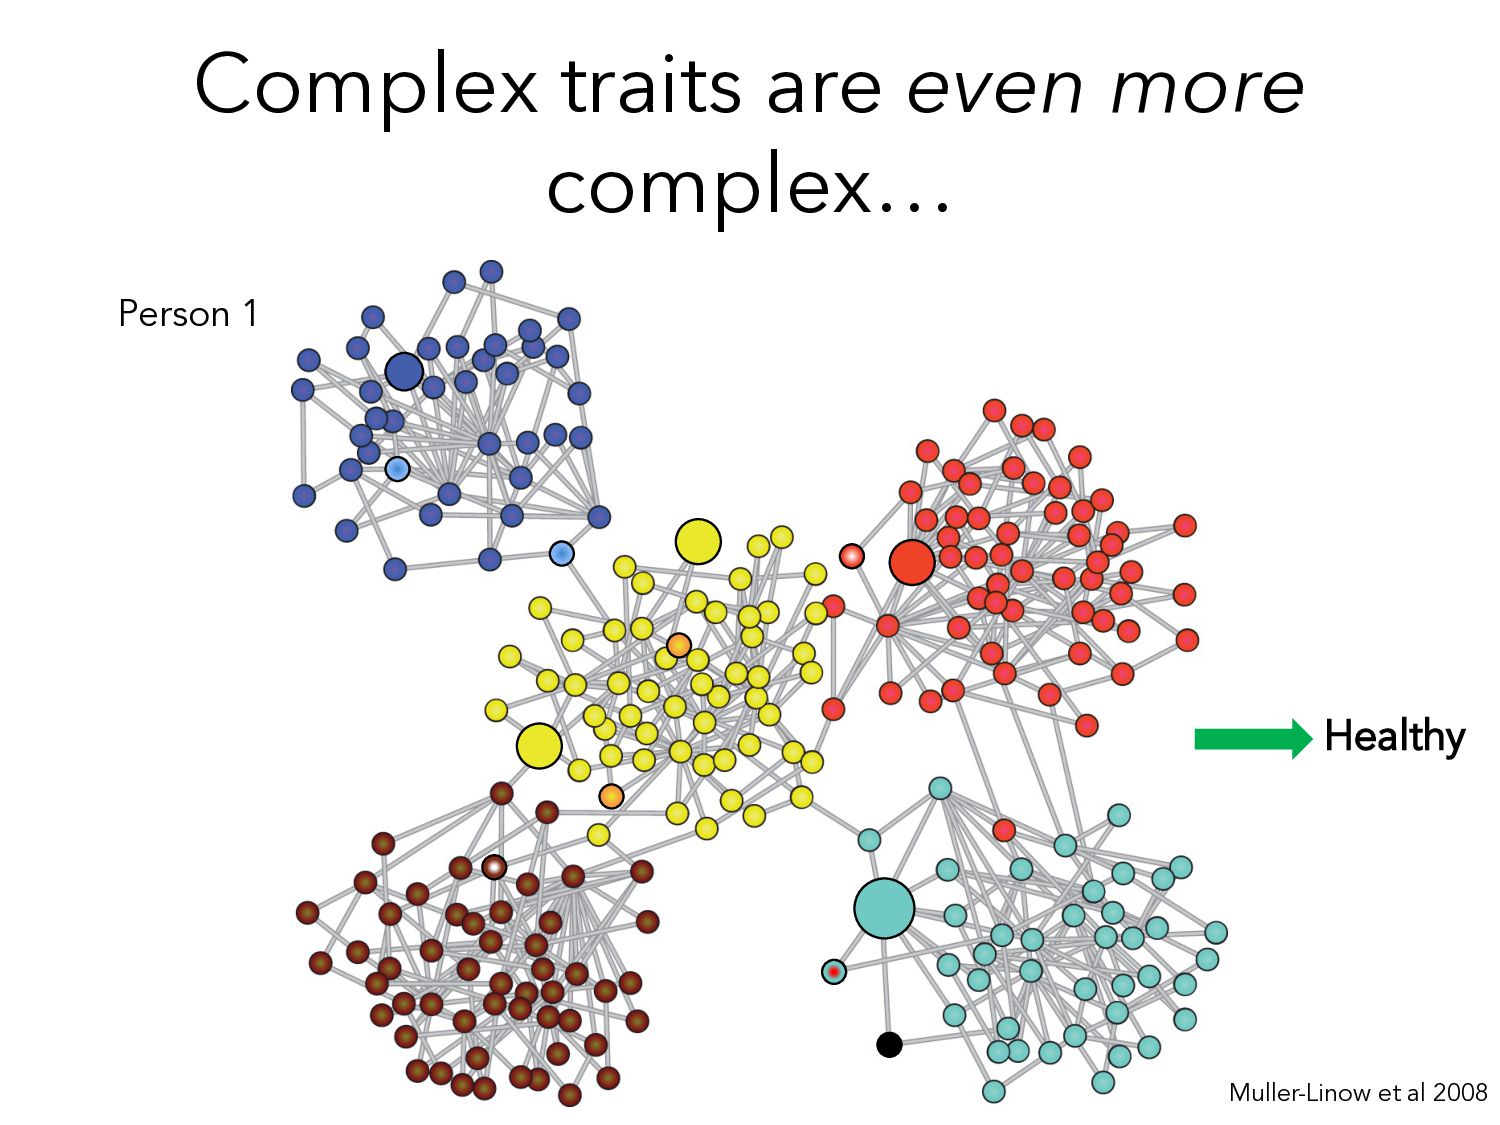
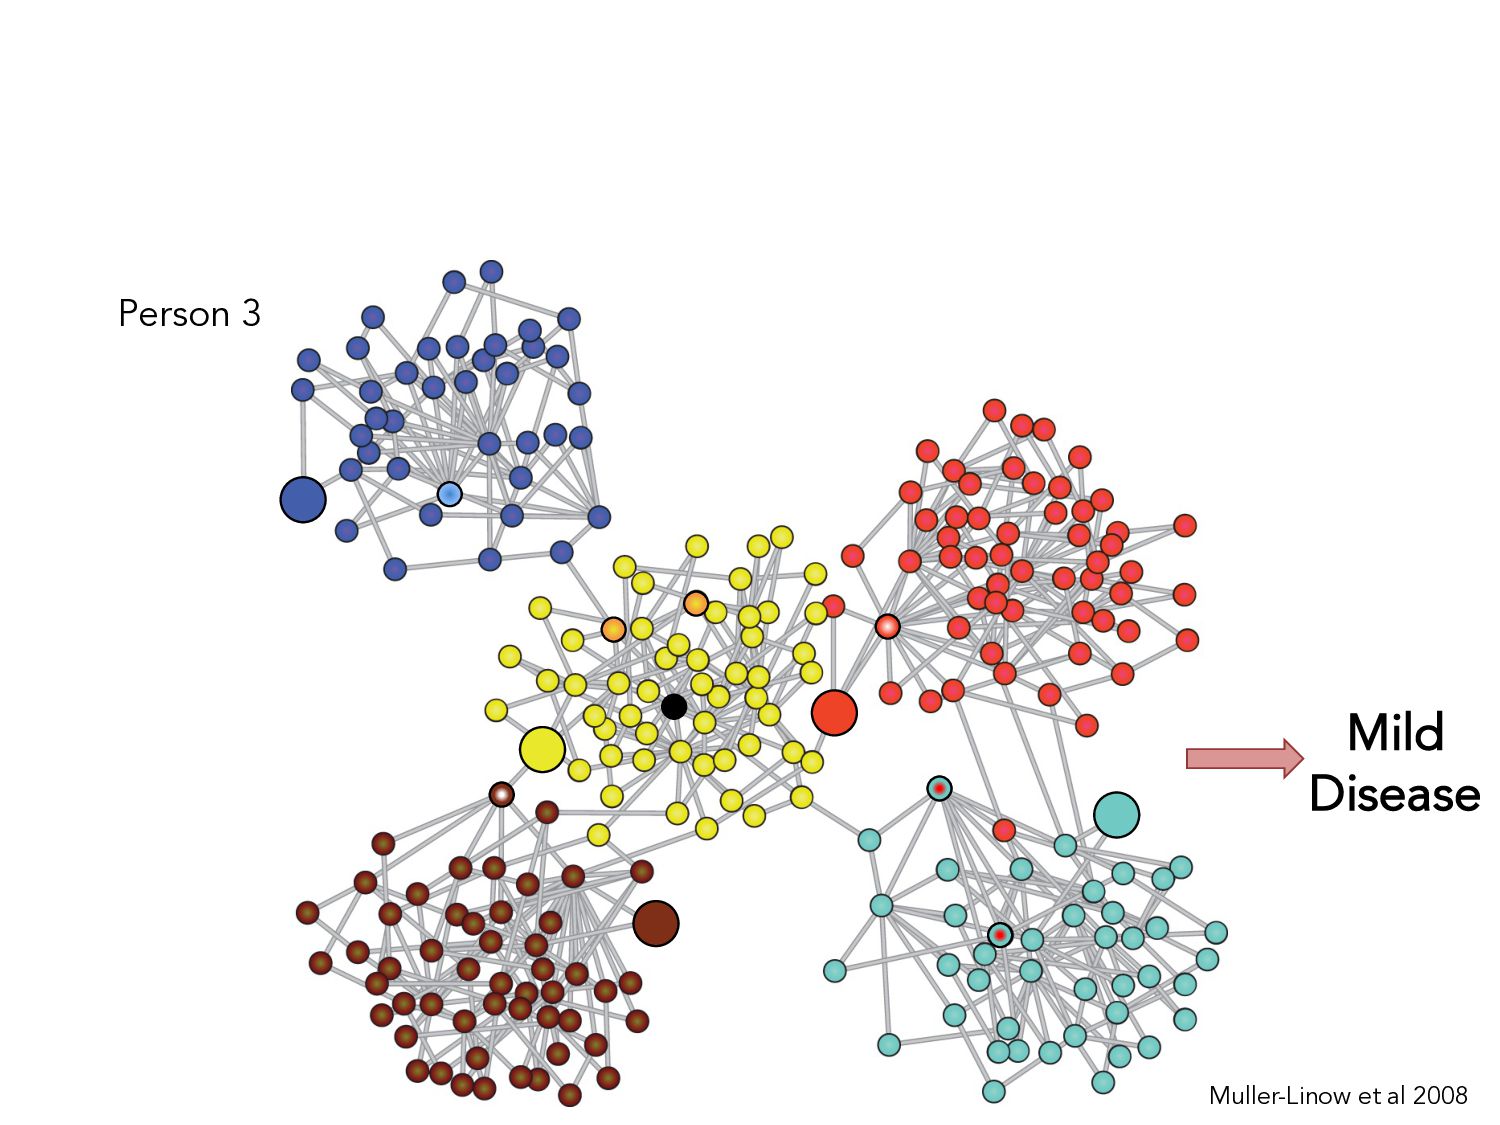
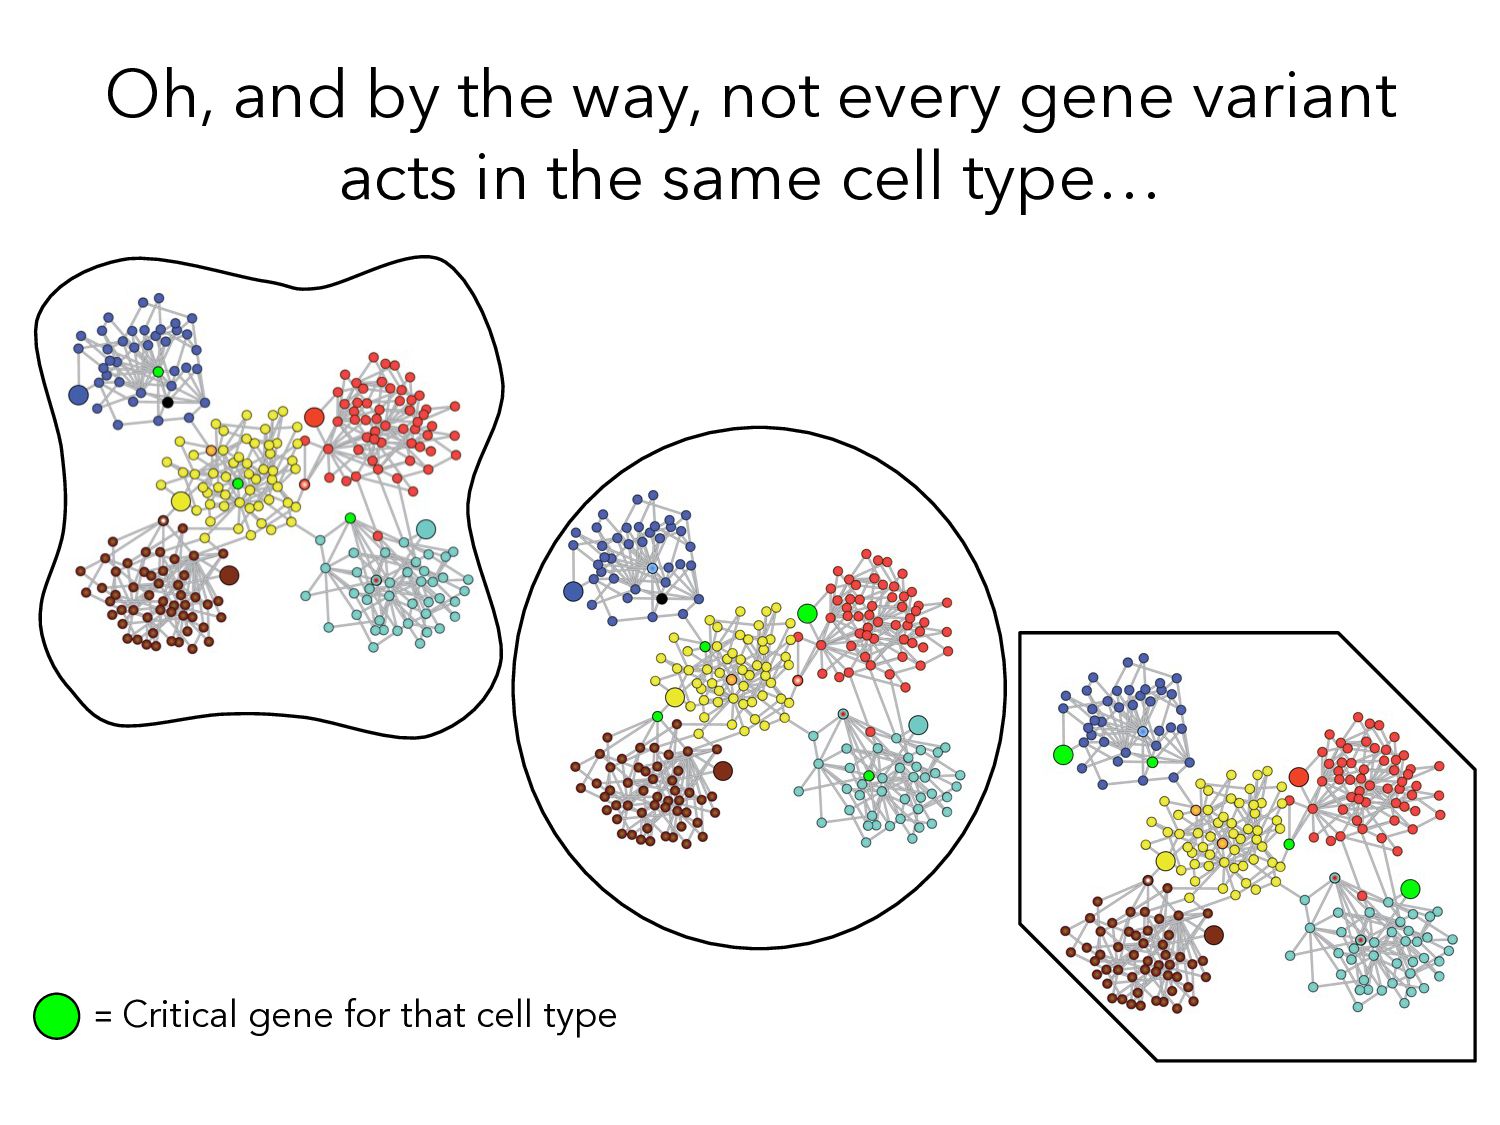
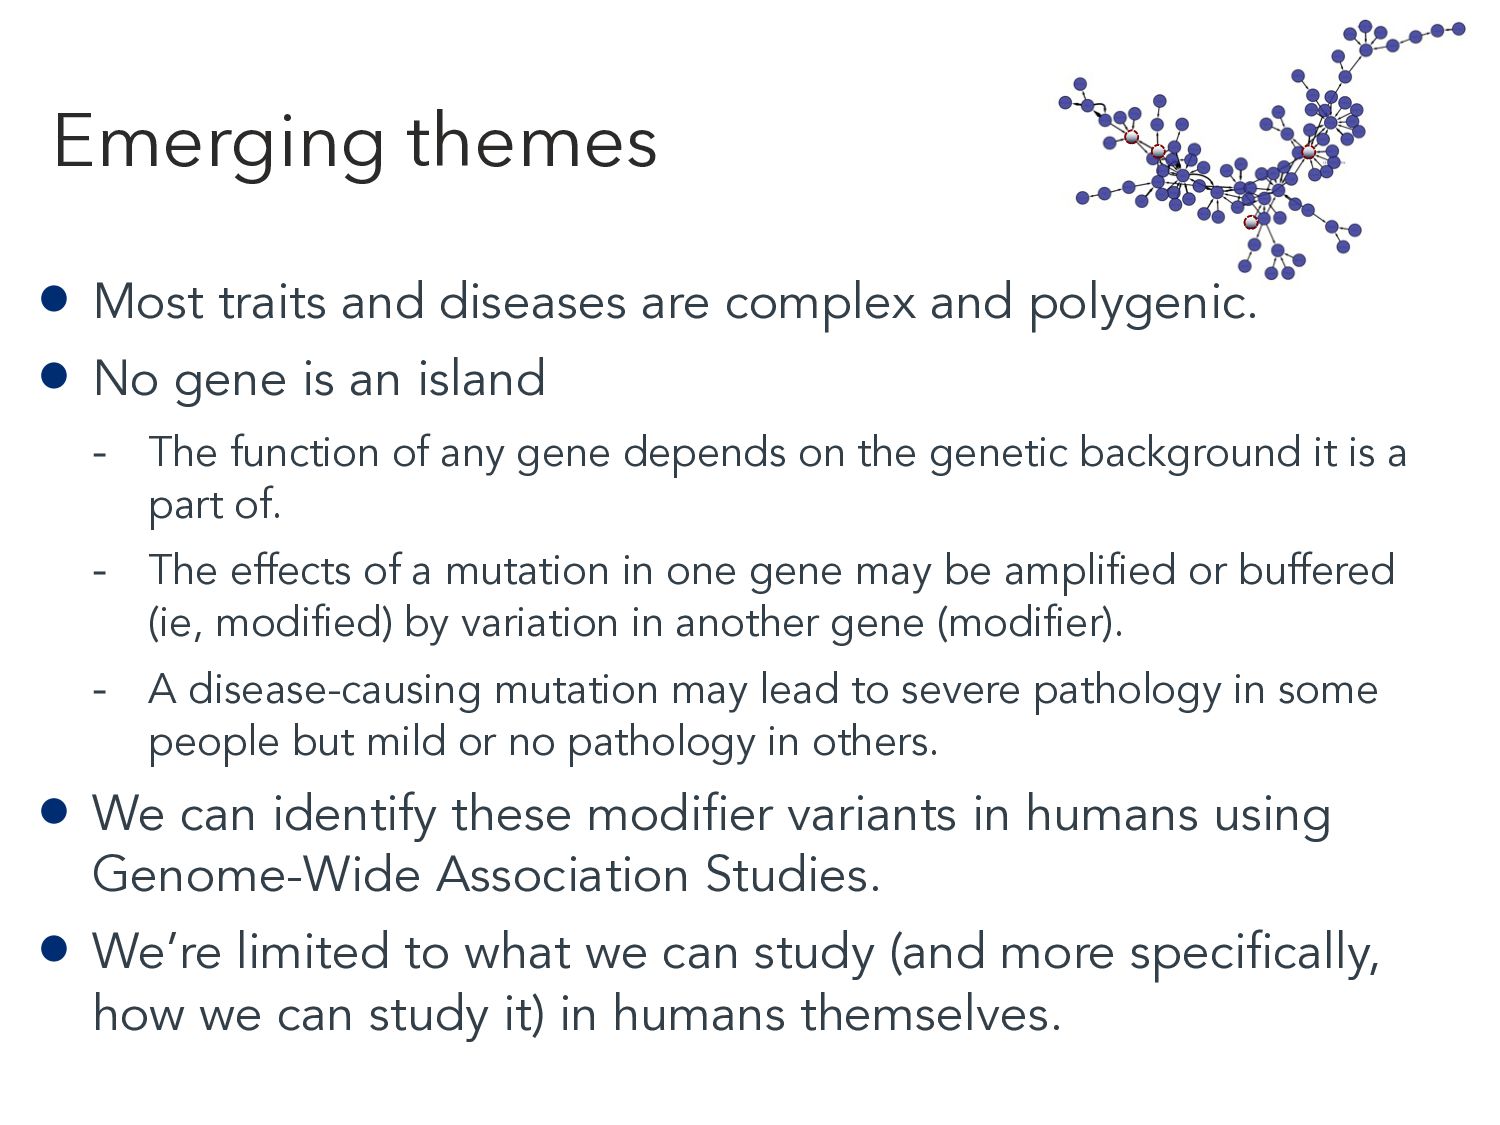
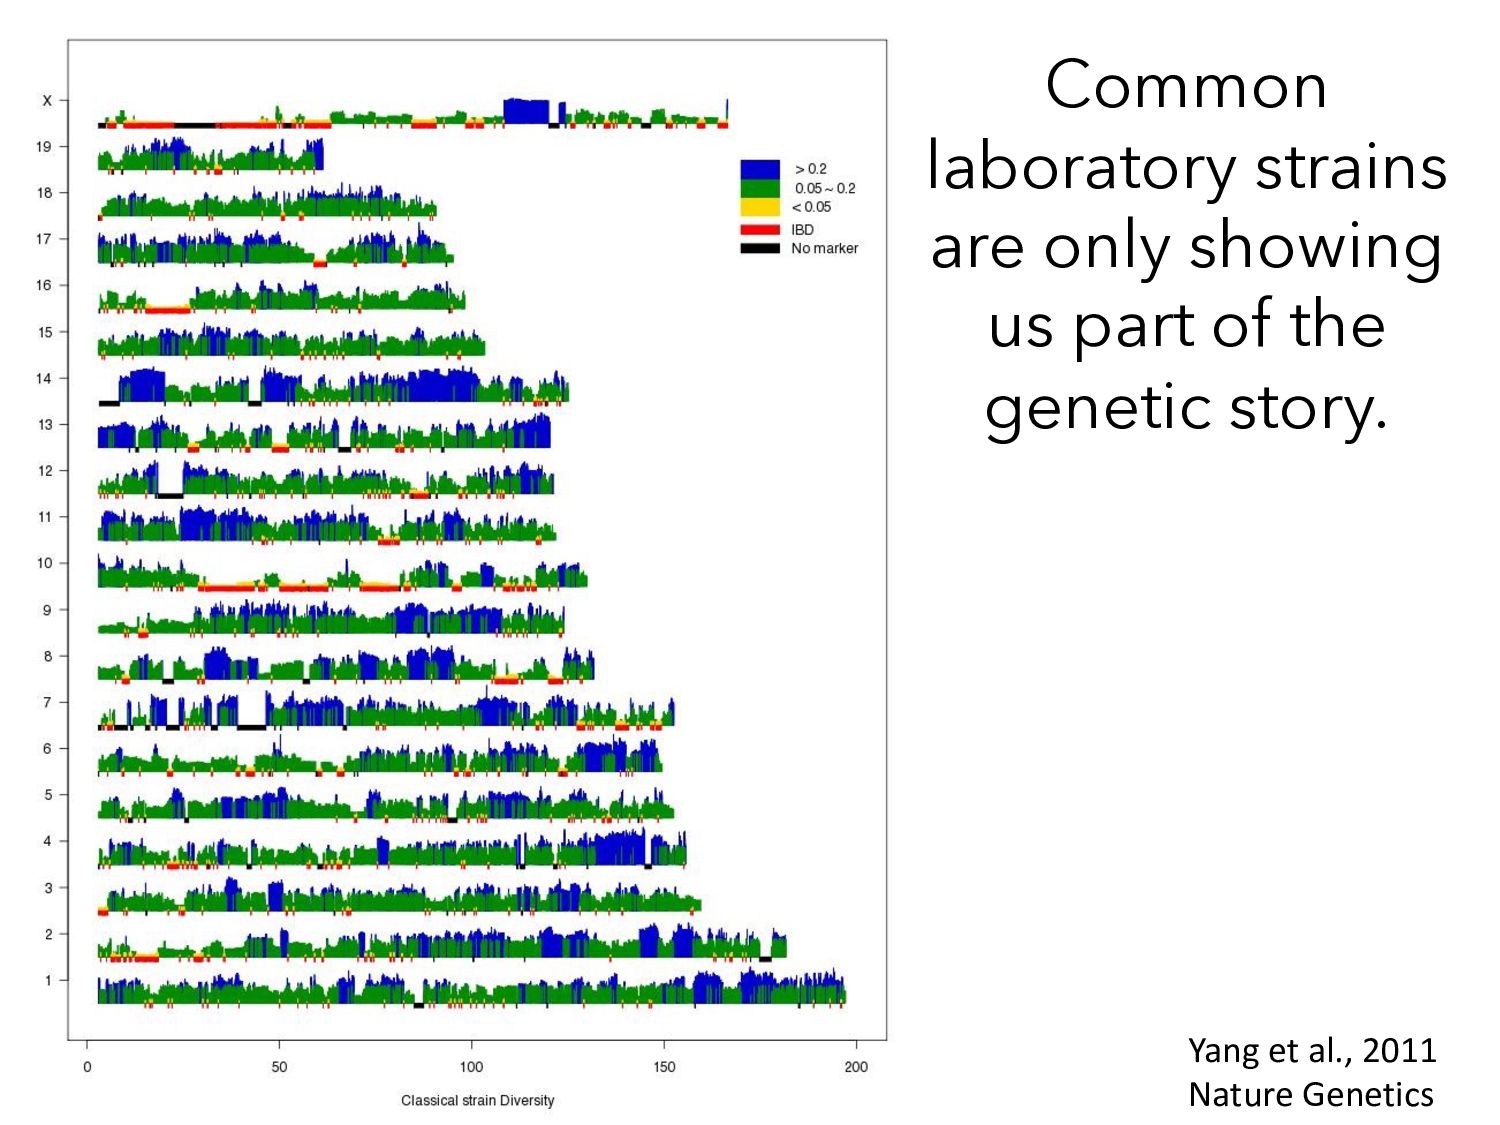
No gene is an island - The function of any gene depends on the genetic background it is a part of. - The effects of a mutation in one gene may be amplified or buffered (ie, modified) by variation in another gene (modifier). - A disease-causing mutation may lead to severe pathology in some people but mild or no pathology in others. We can identify these modifier variants in humans using Genome-Wide Association Studies. We’re limited to what we can study (and more specifically, how we can study it) in humans themselves.
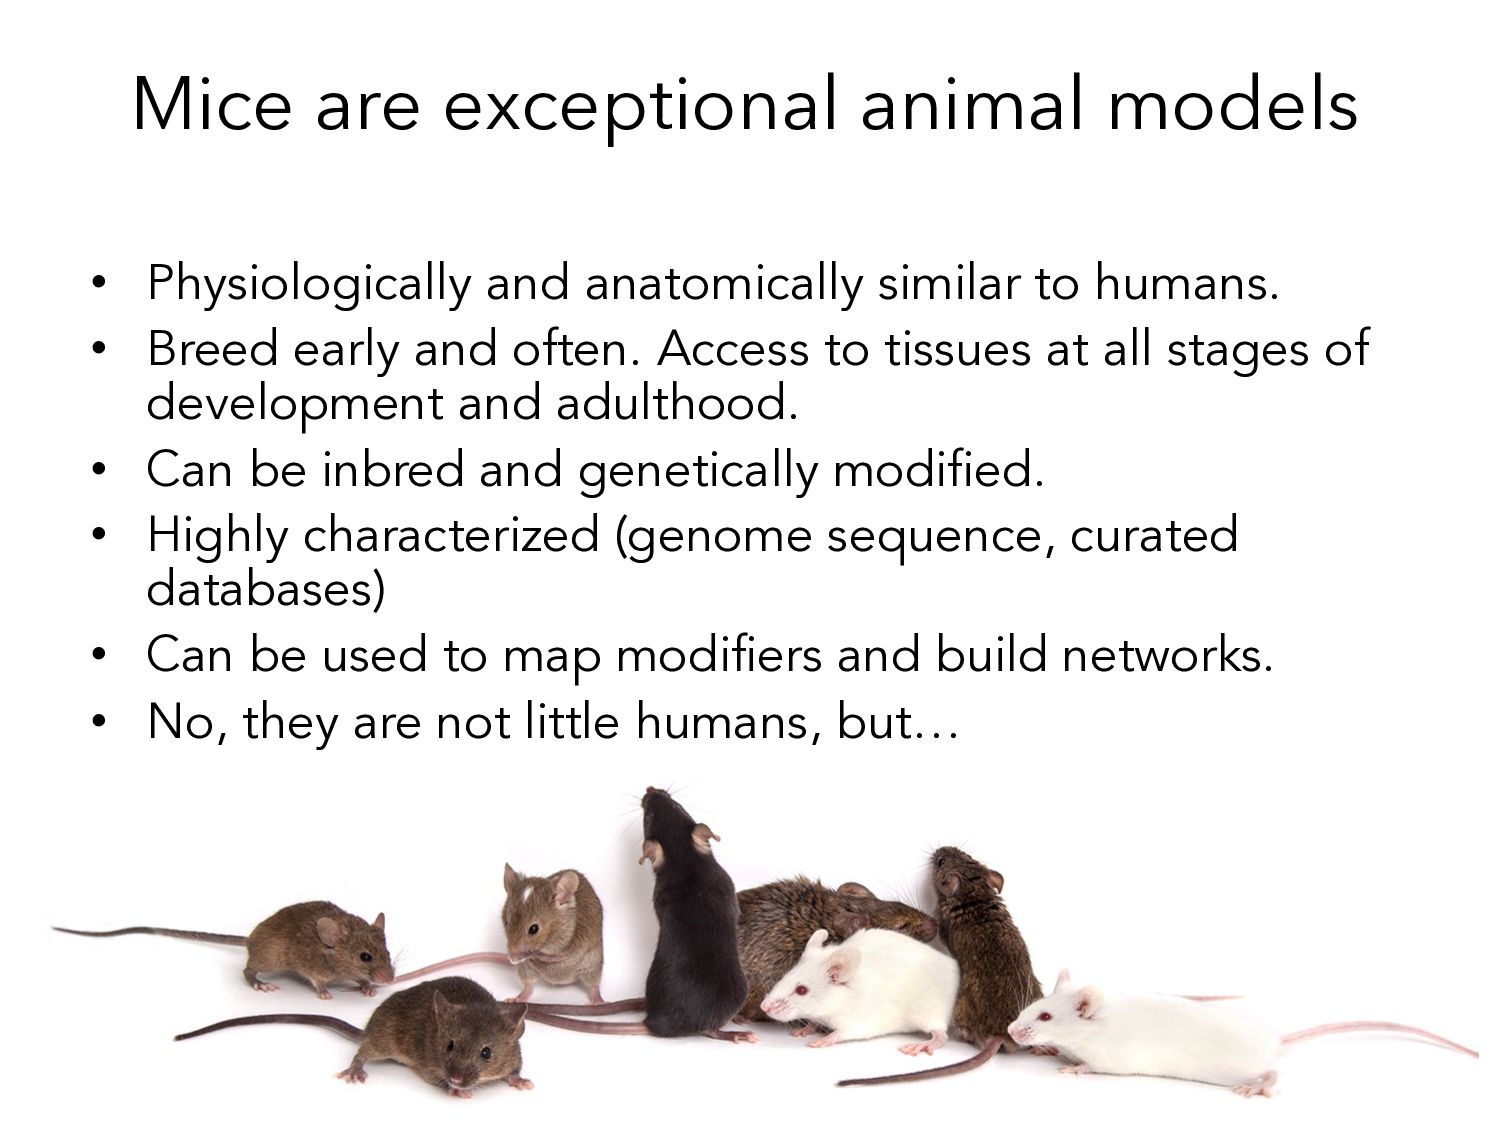
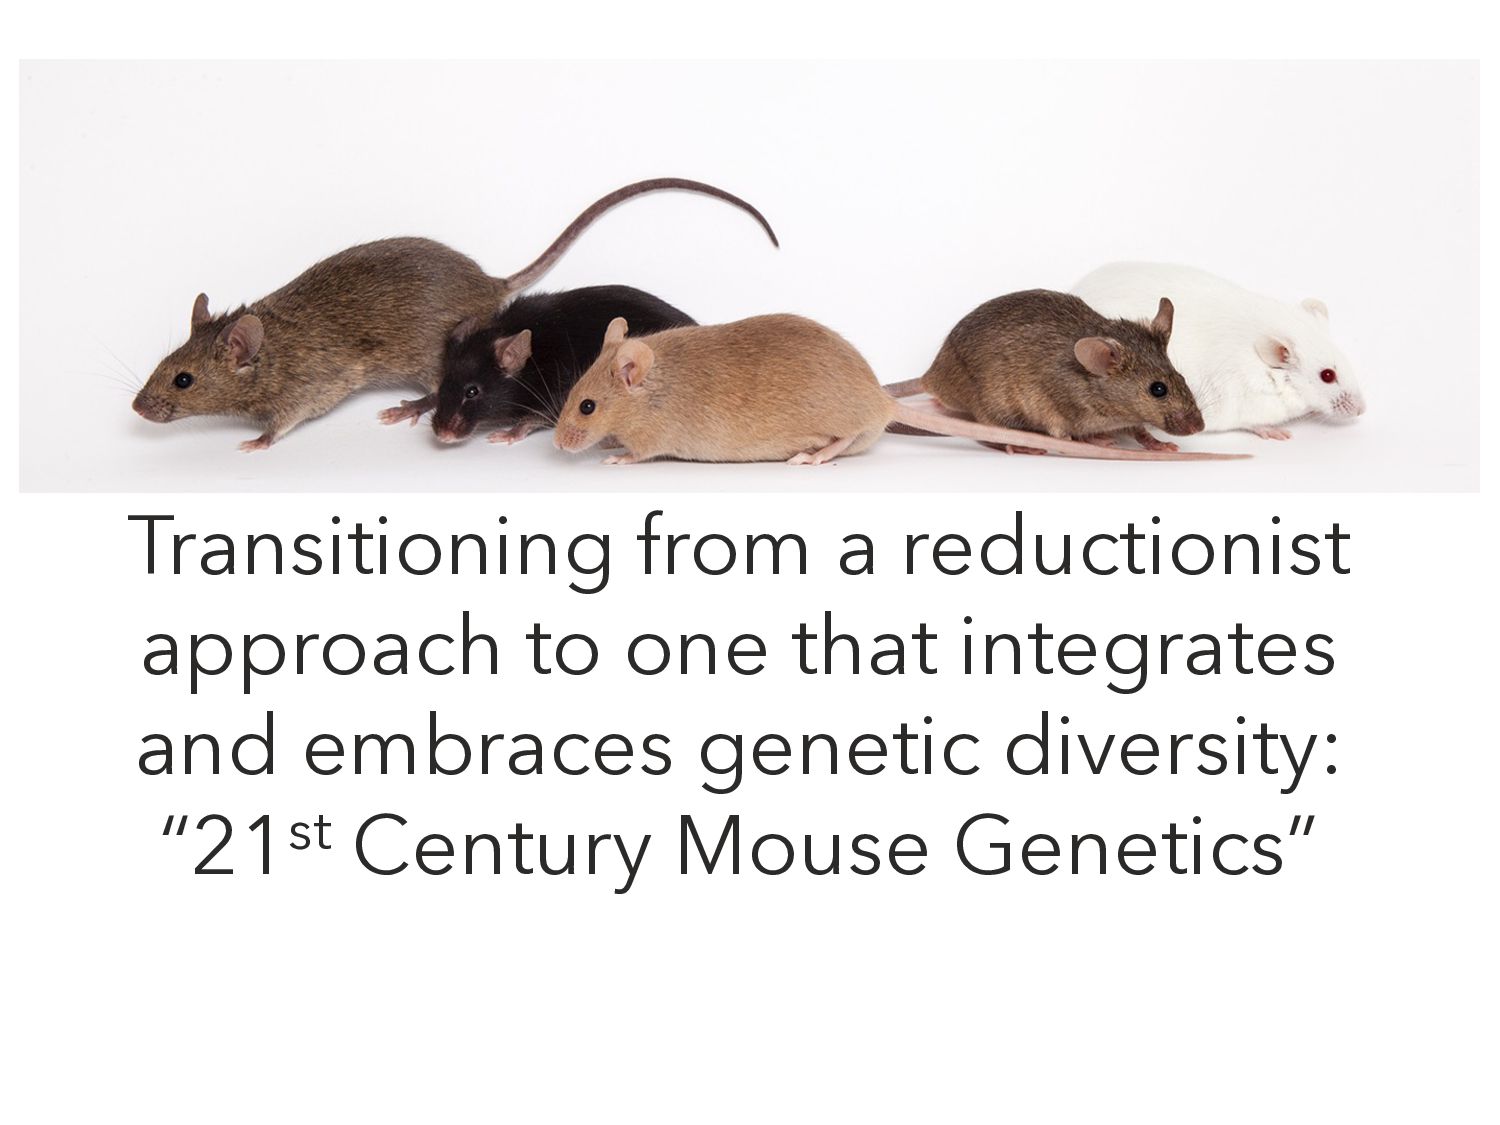
to humans. • Breed early and often. Access to tissues at all stages of development and adulthood. • Can be inbred and genetically modified. • Highly characterized (genome sequence, curated databases) • Can be used to map modifiers and build networks. • No, they are not little humans, but…
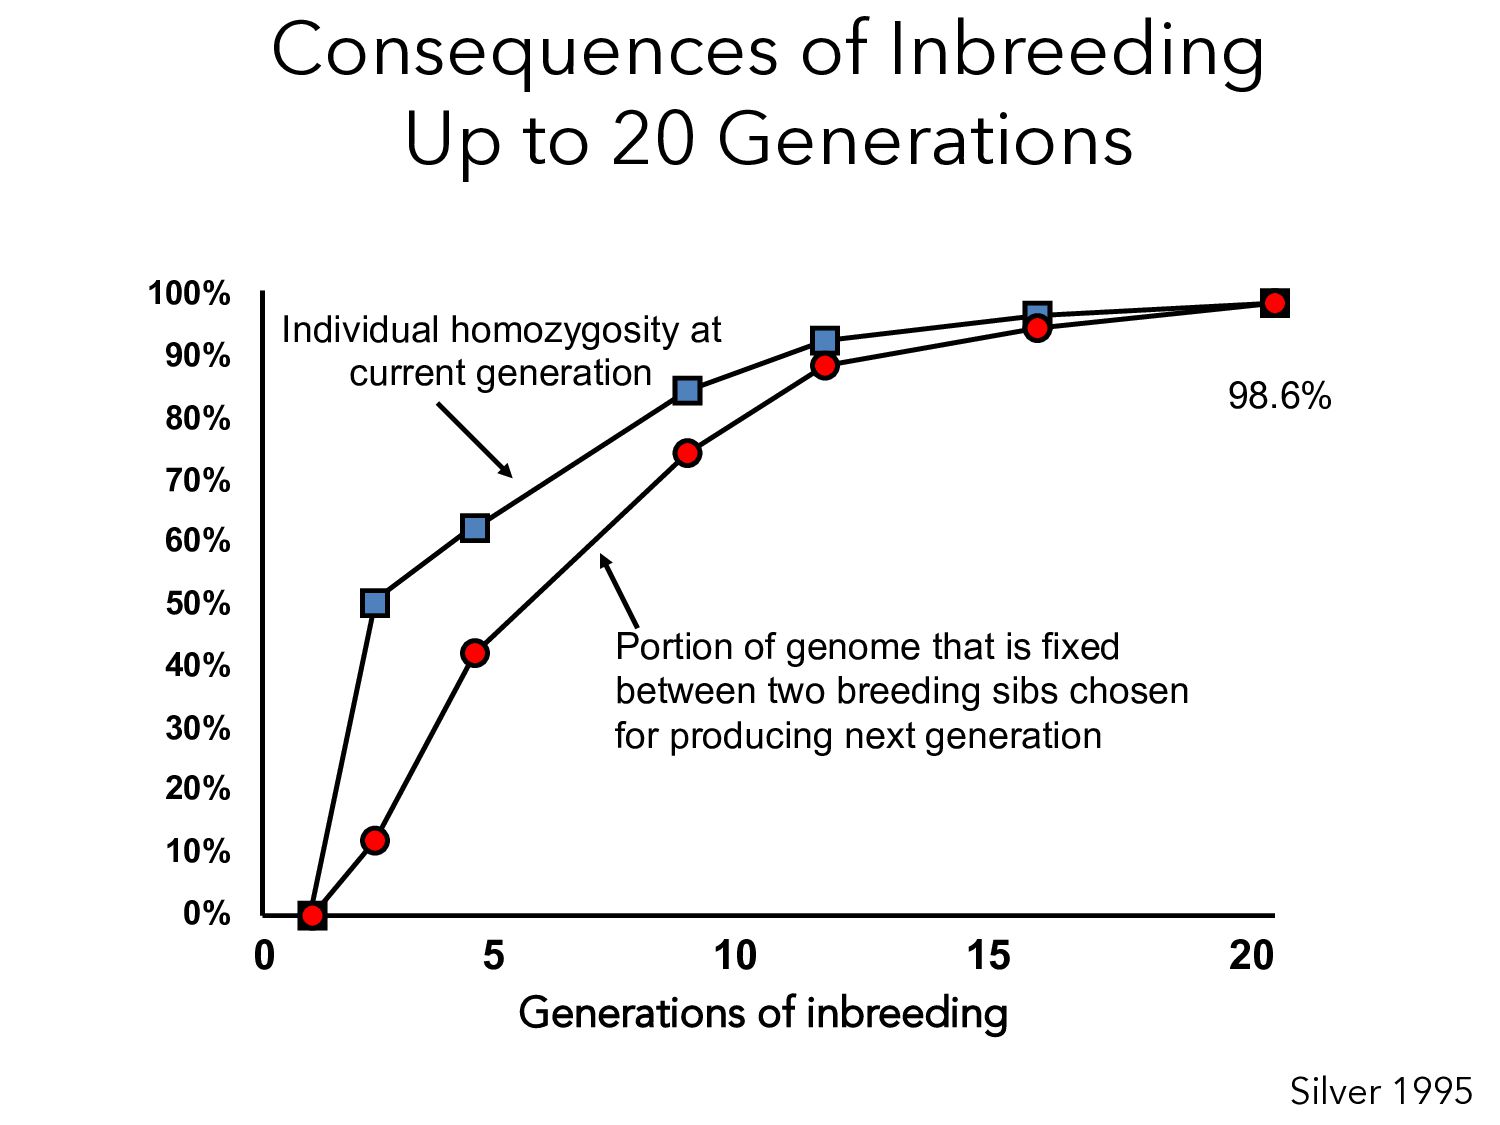
90% 80% 70% 60% 50% 40% 30% 20% 10% 0% 0 5 10 15 20 Generations of inbreeding Individual homozygosity at current generation Portion of genome that is fixed between two breeding sibs chosen for producing next generation 98.6%
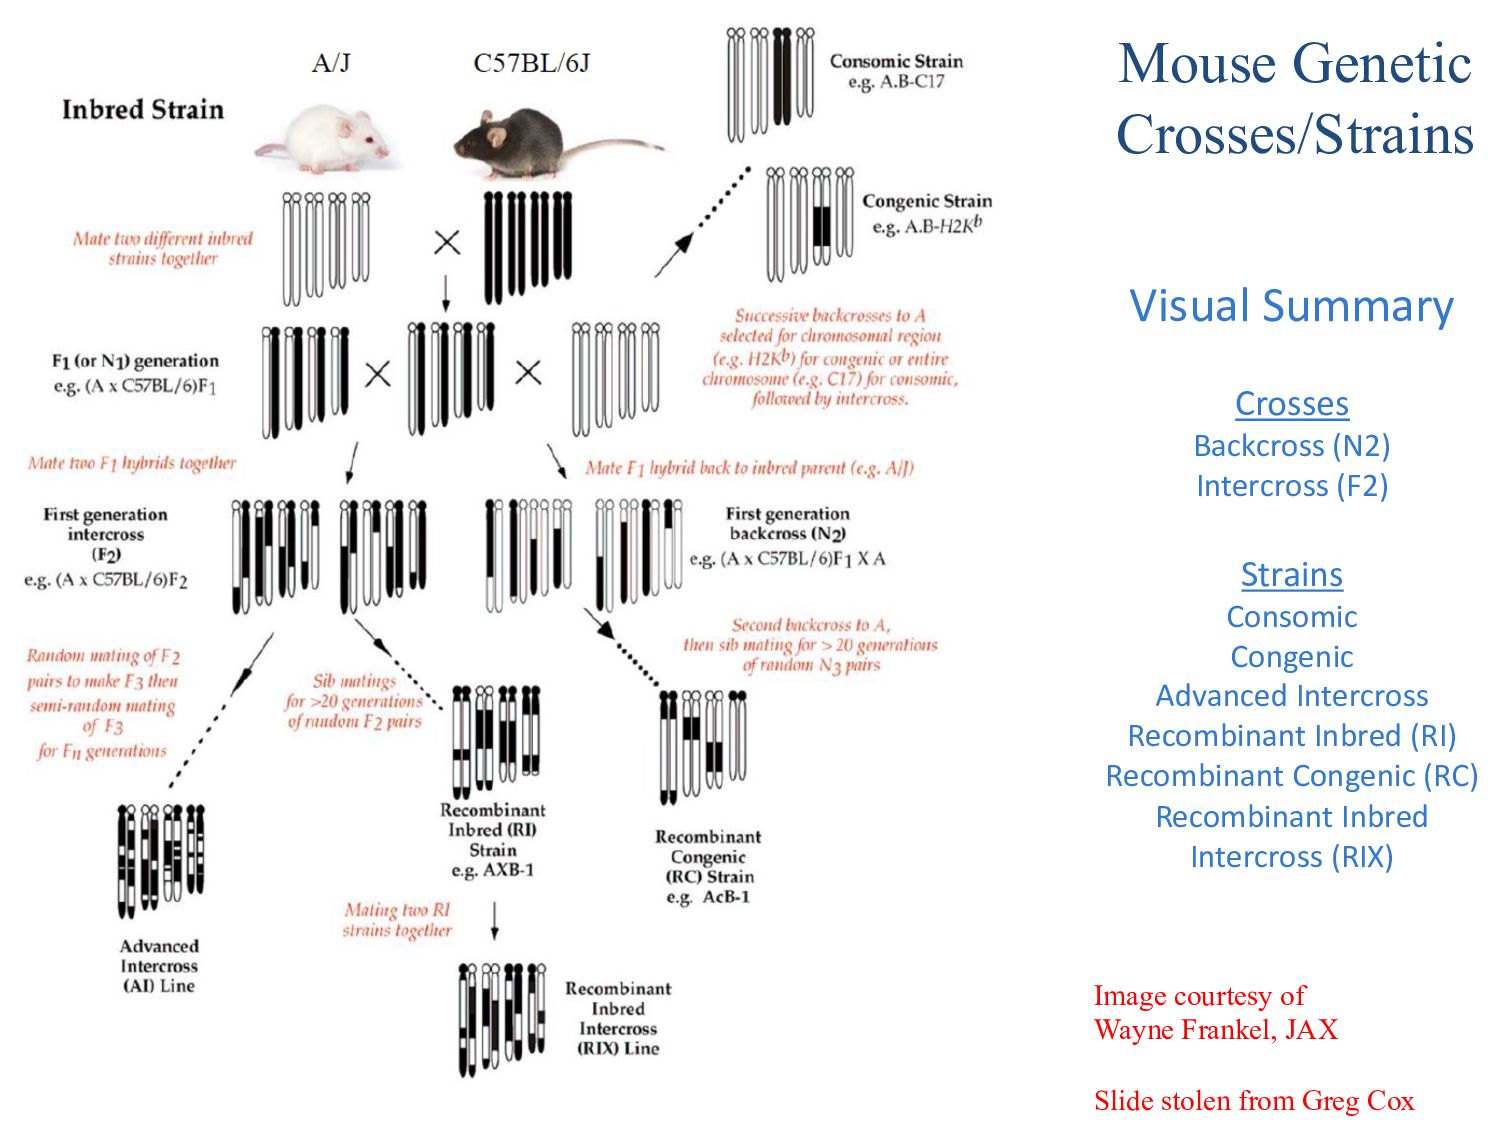
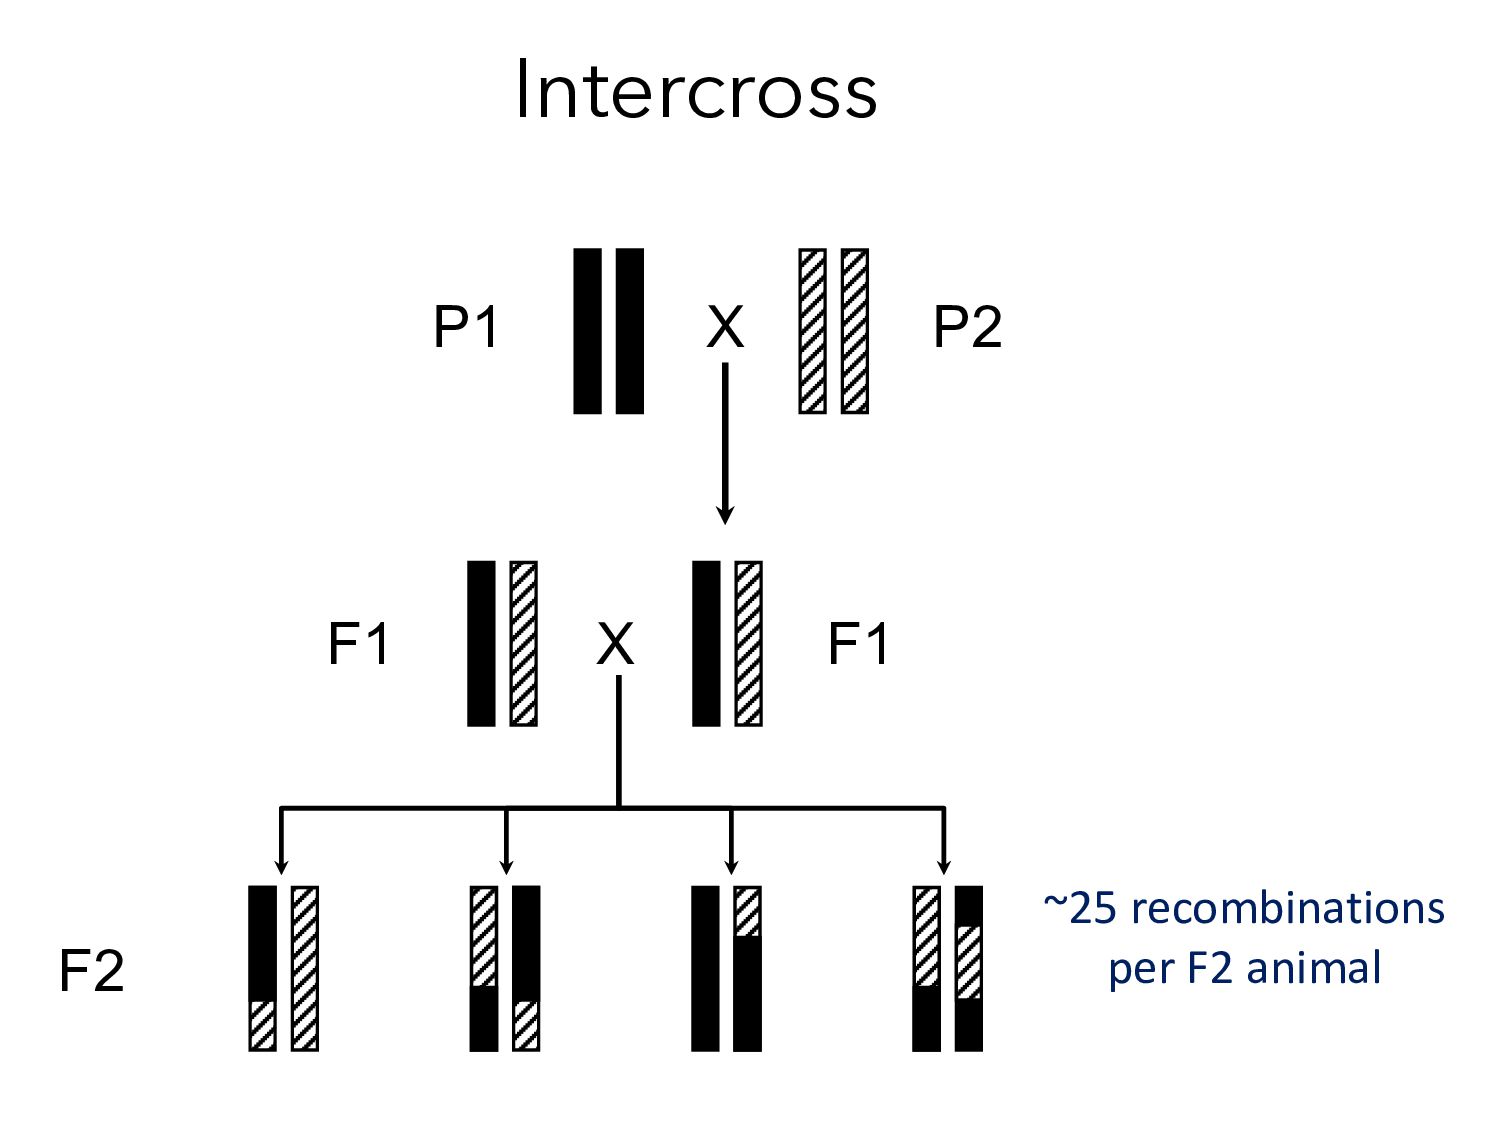
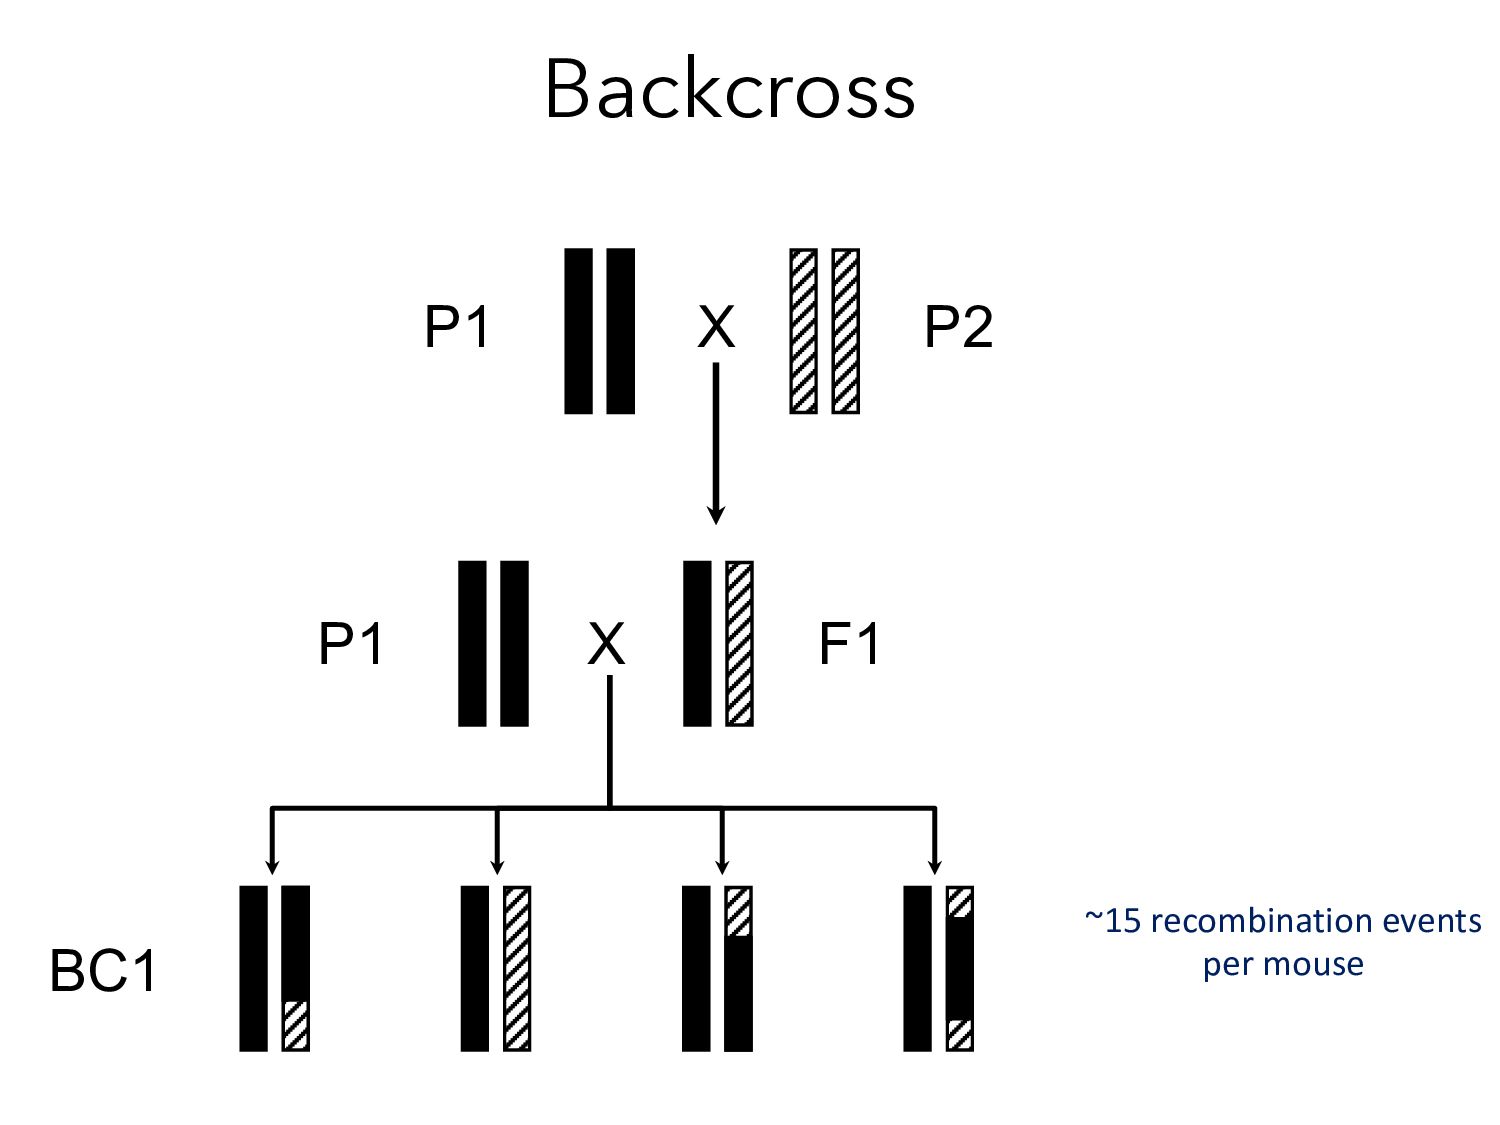
analysis. • Fewer mice required. – Even recessive alleles will be homozygous in ¼ of progeny. • All mice need to be genotyped ($). • Number of recombination events per mouse is low. Less recombination = lower mapping resolution = more mice ($). • Confidence intervals tend to be broad and resolving the causative gene may require heroic follow-up experiments.
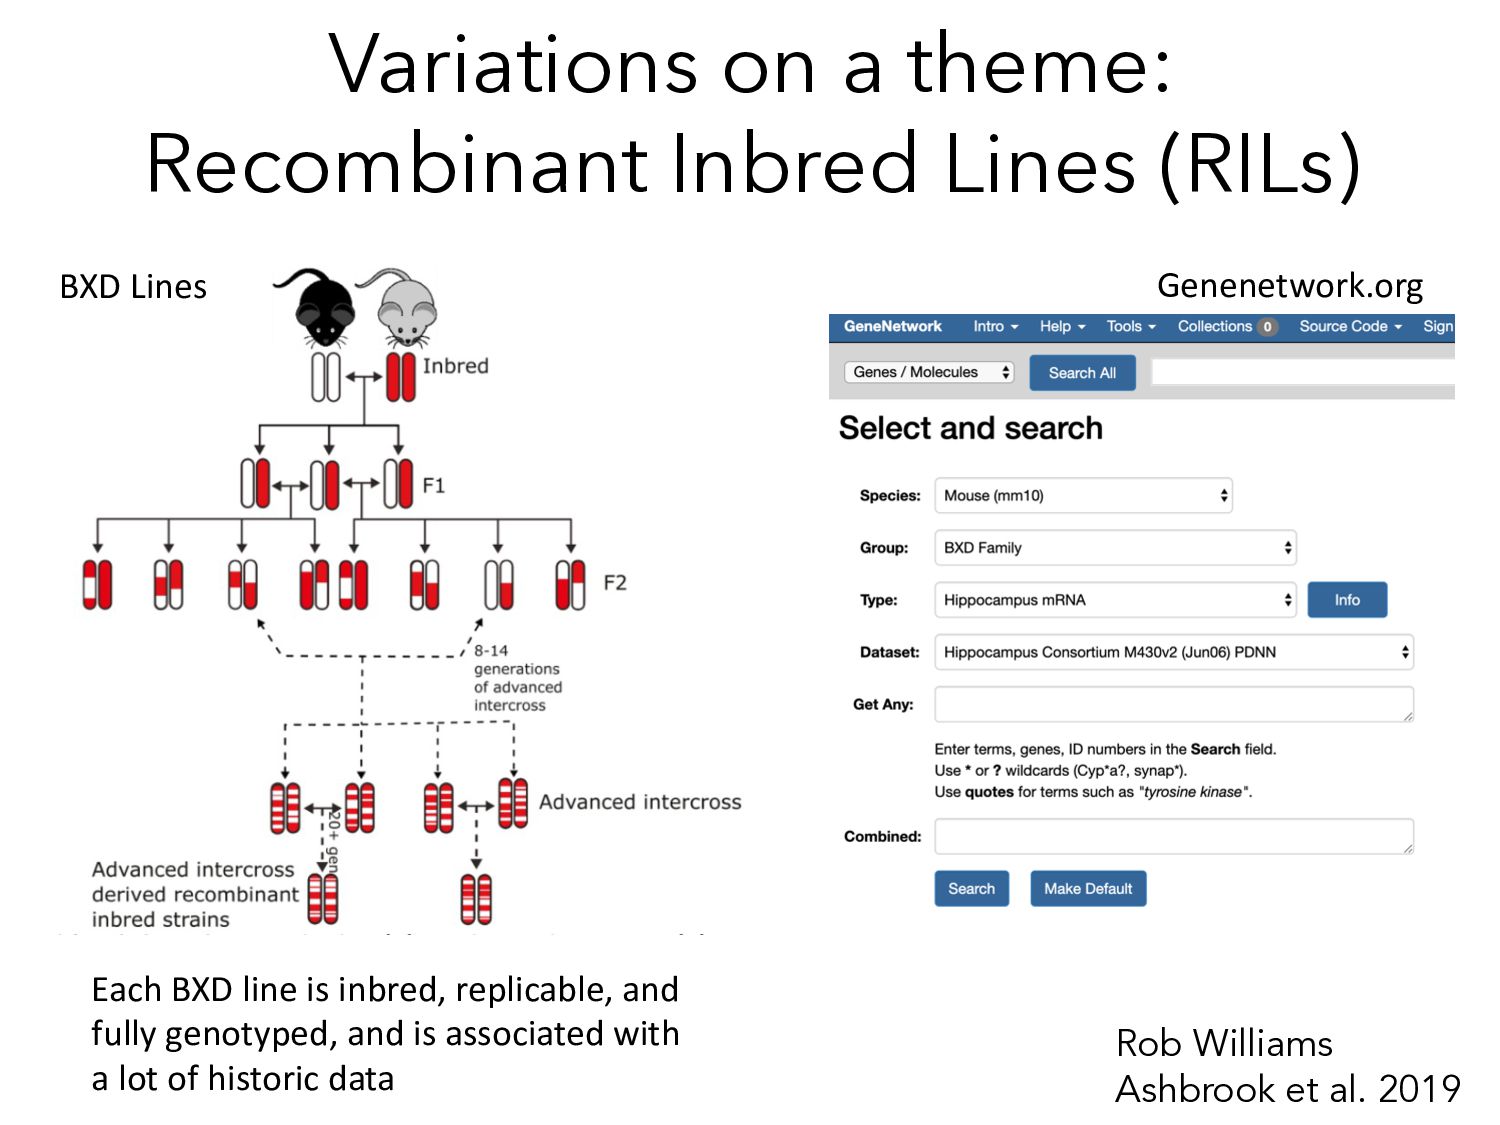
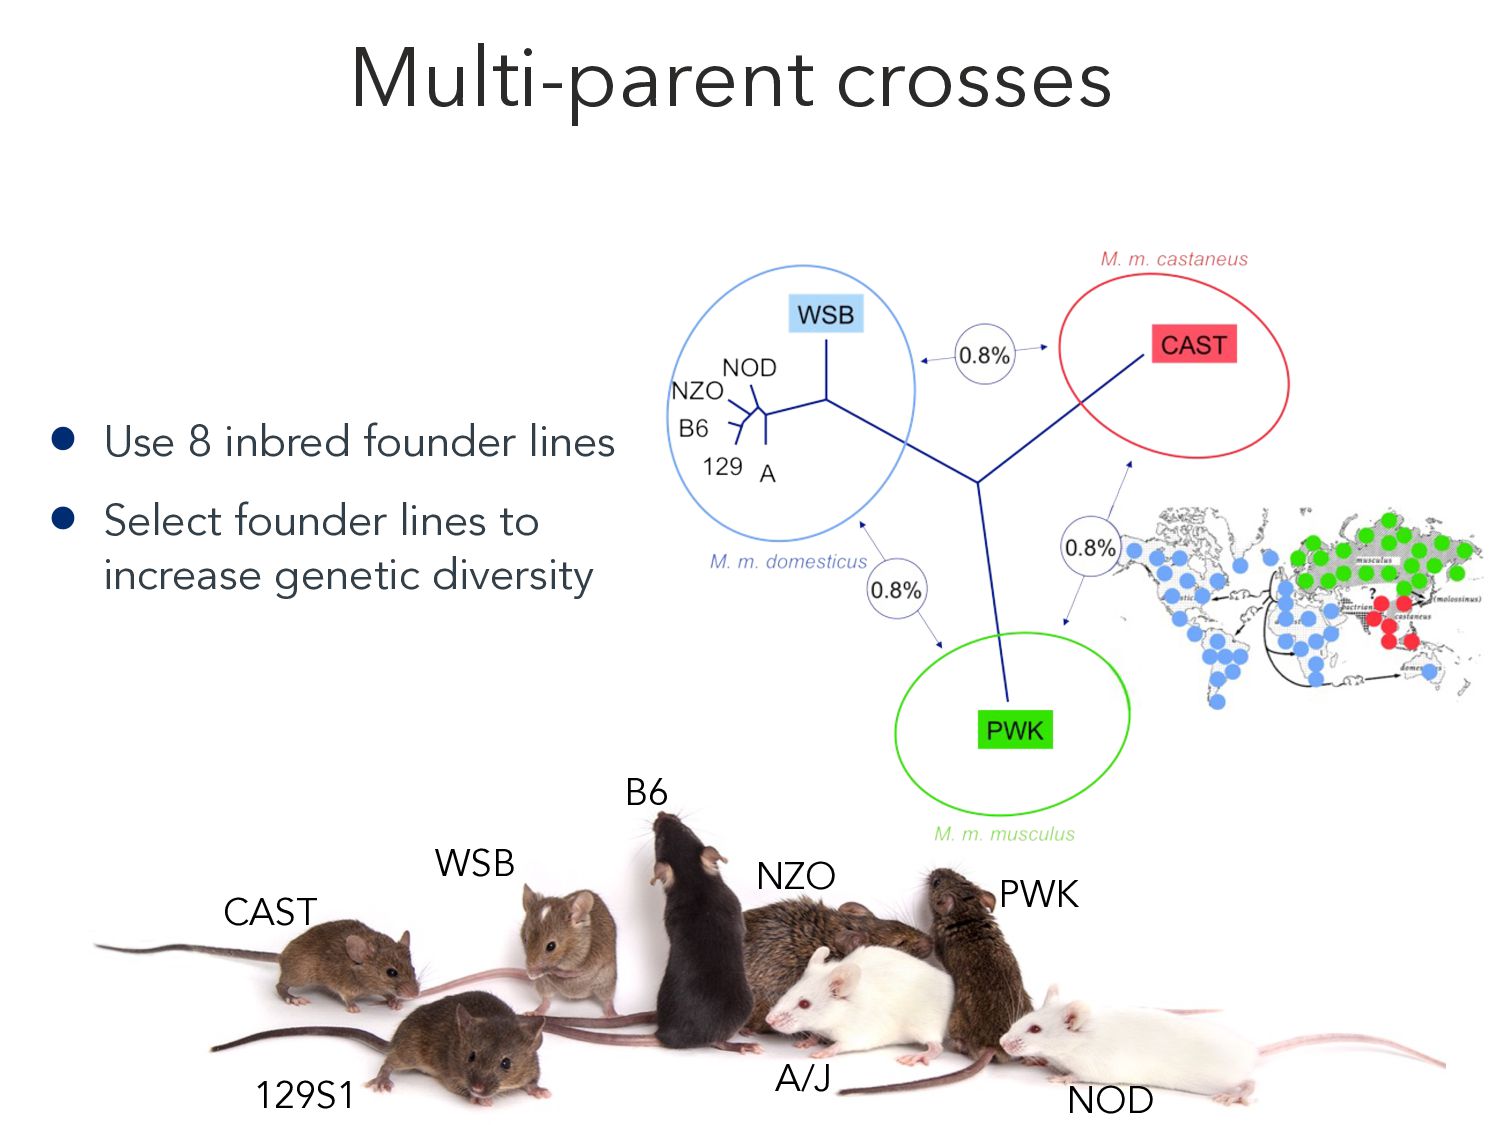
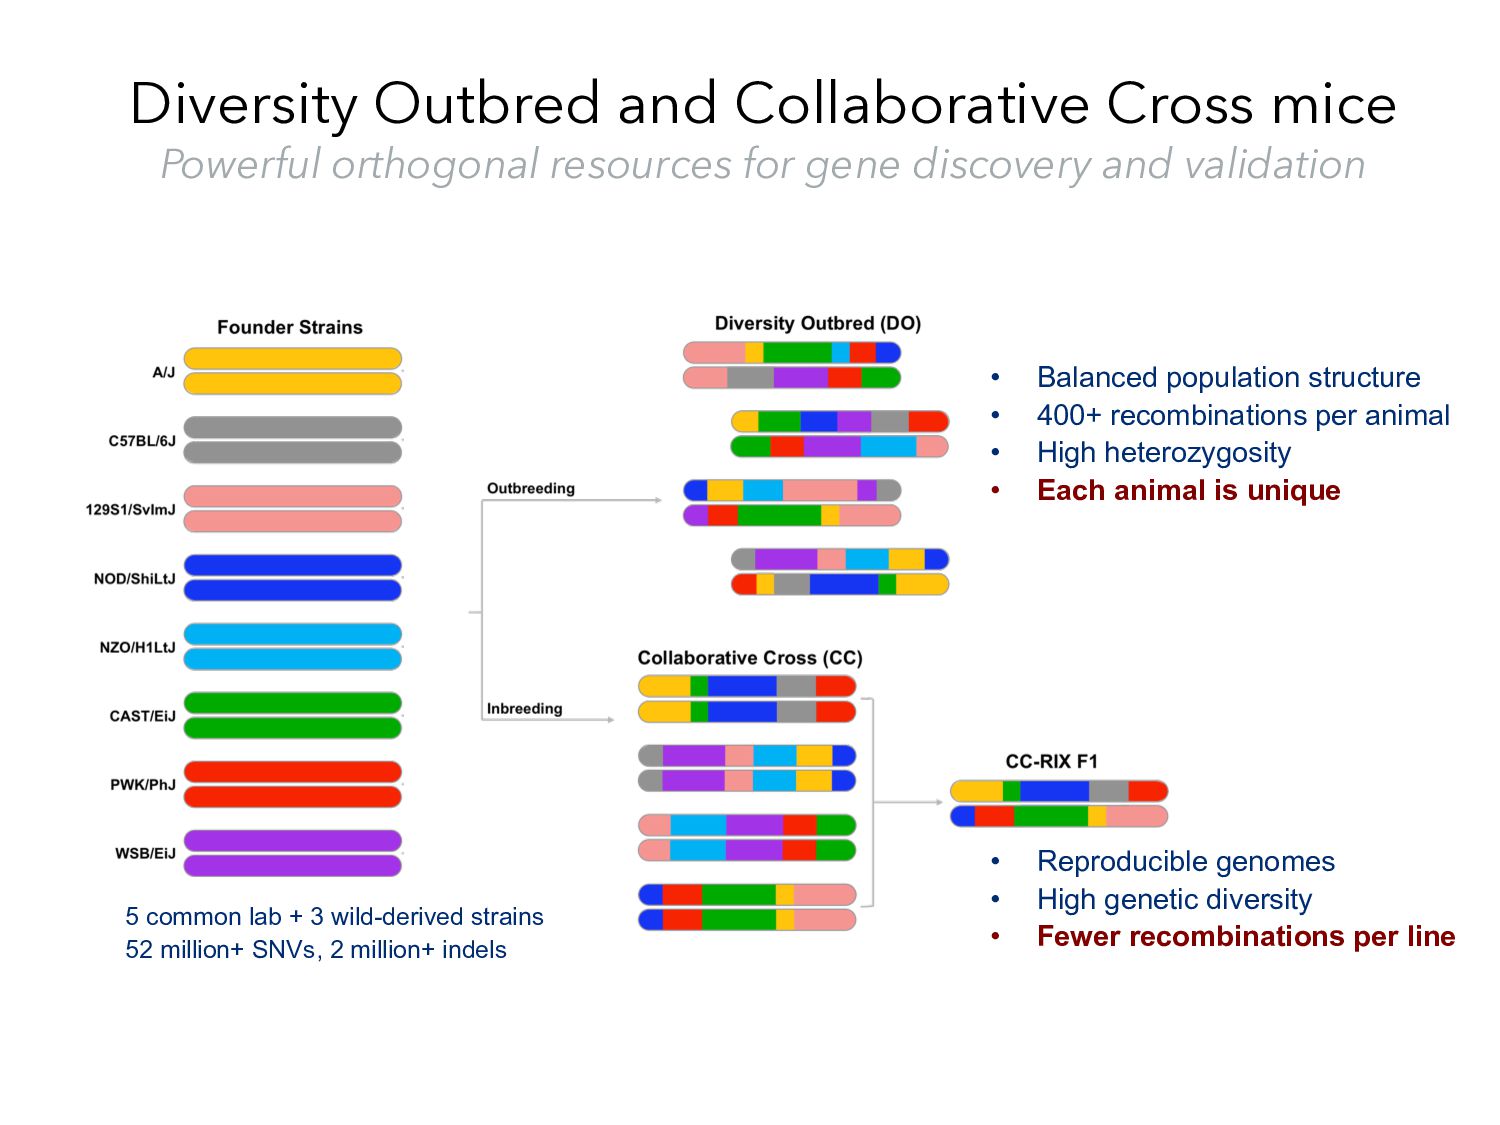
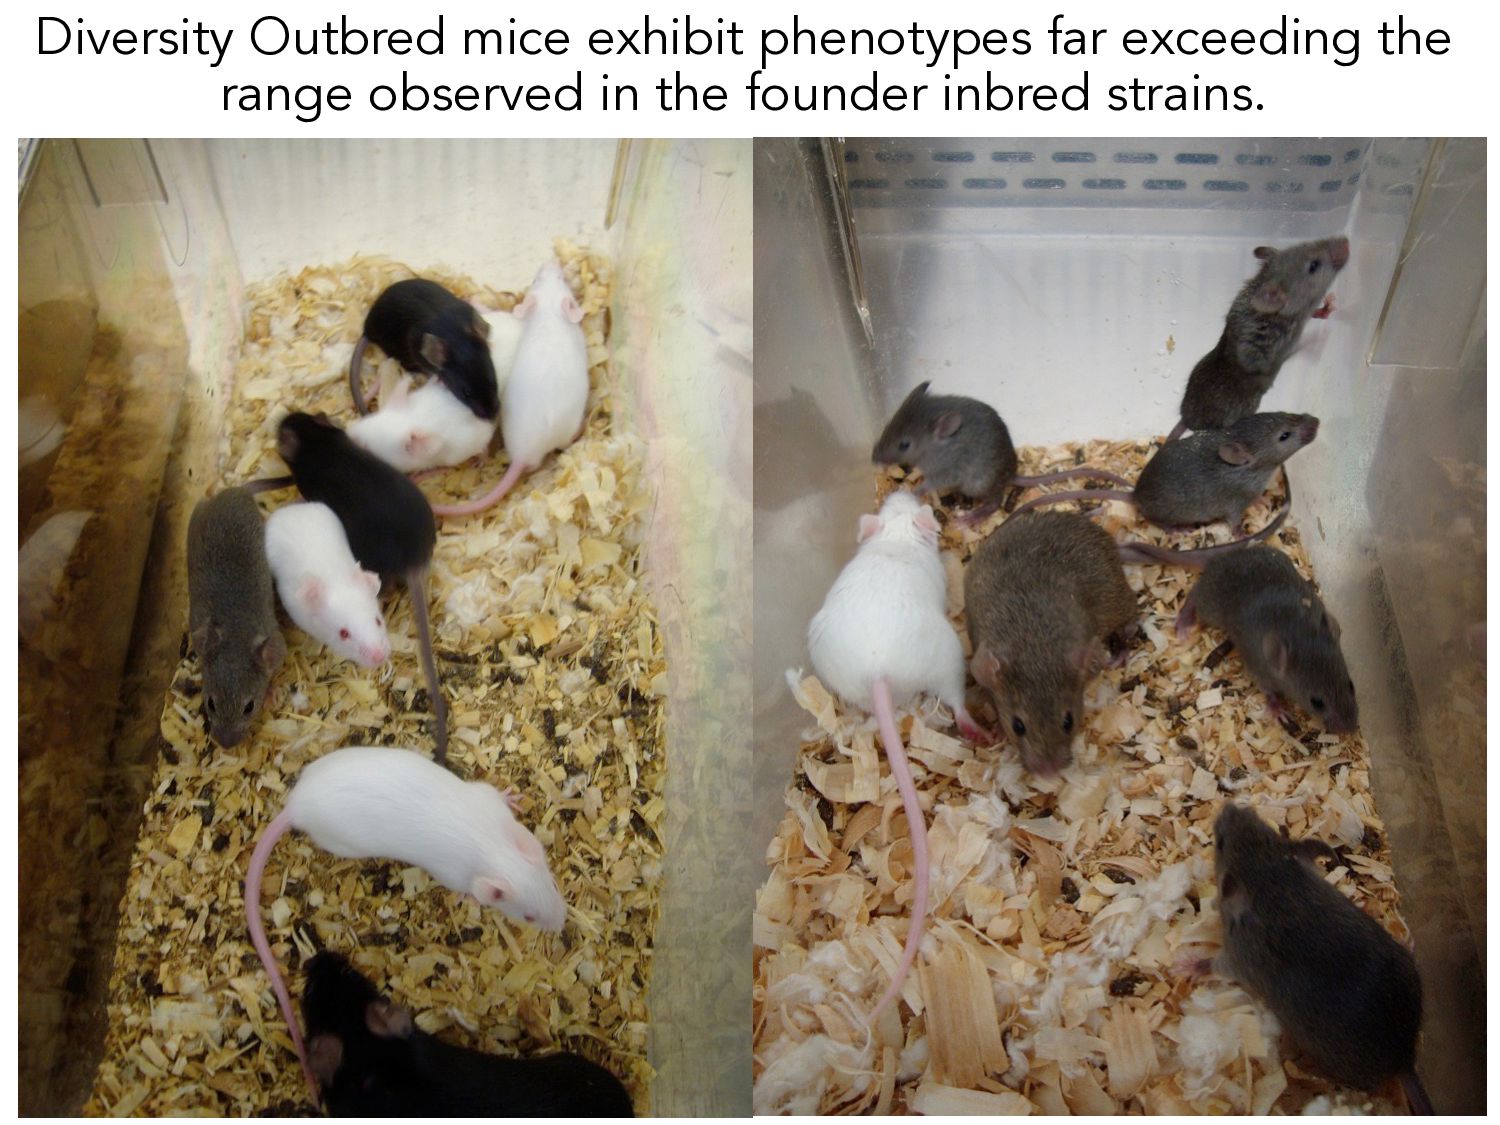
gene discovery and validation • Balanced population structure • 400+ recombinations per animal • High heterozygosity • Each animal is unique 5 common lab + 3 wild-derived strains 52 million+ SNVs, 2 million+ indels • Reproducible genomes • High genetic diversity • Fewer recombinations per line
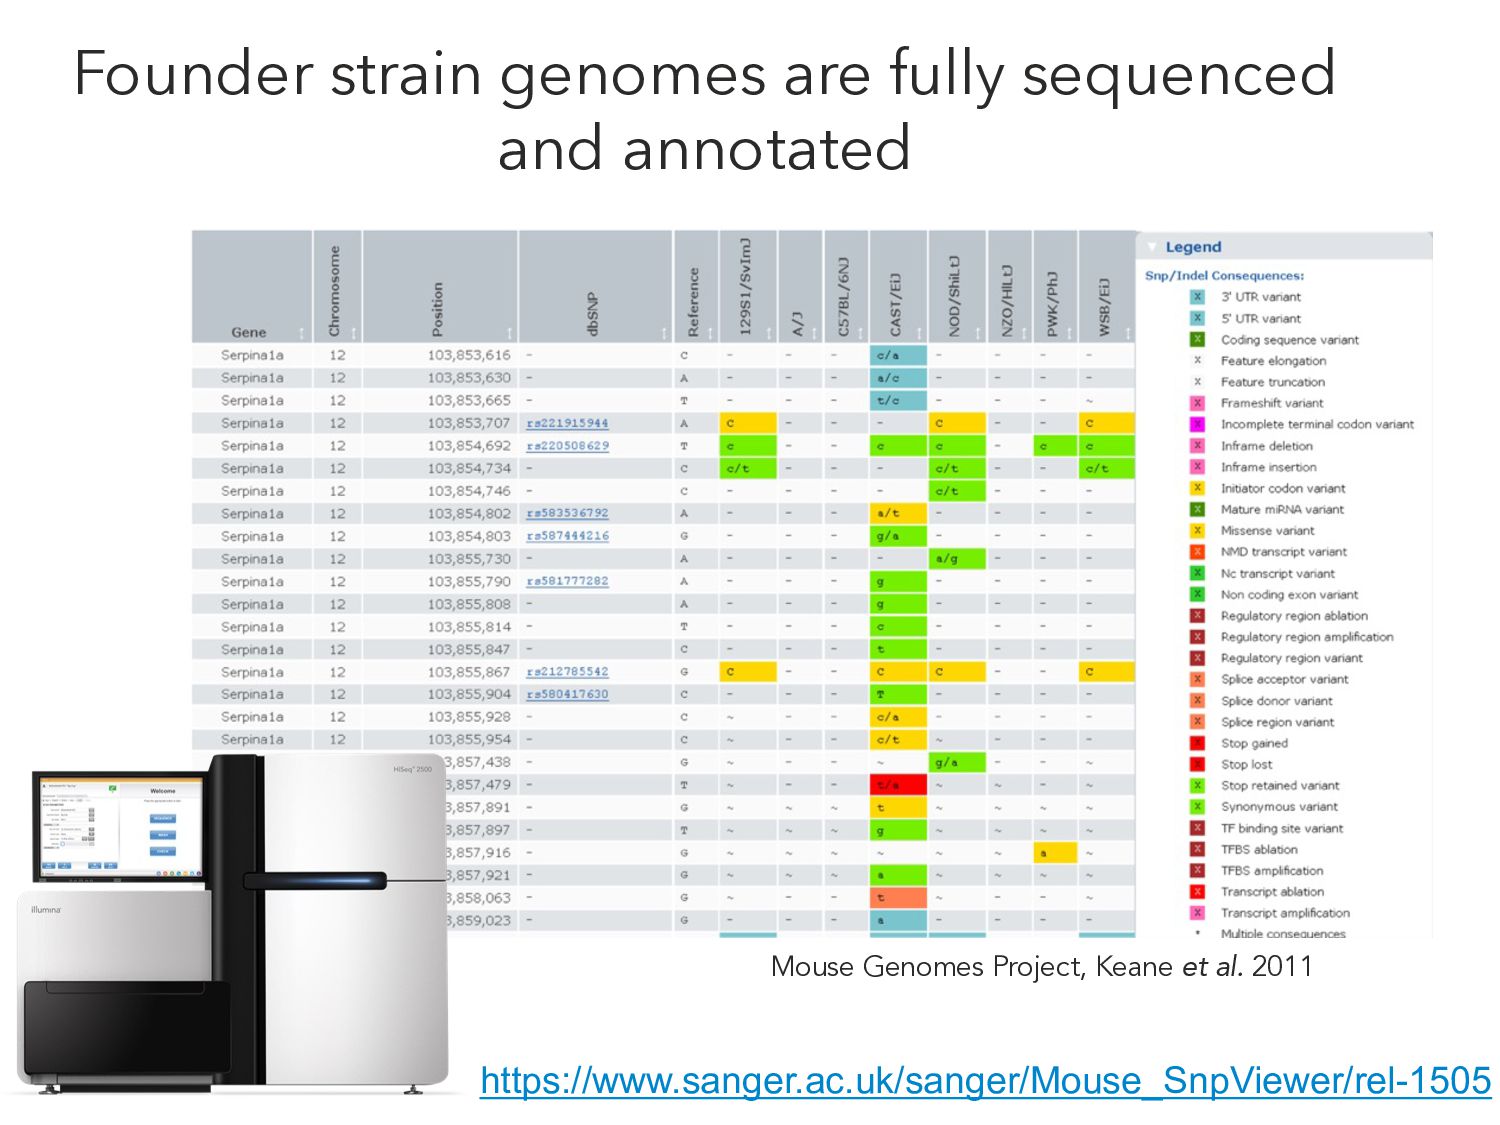
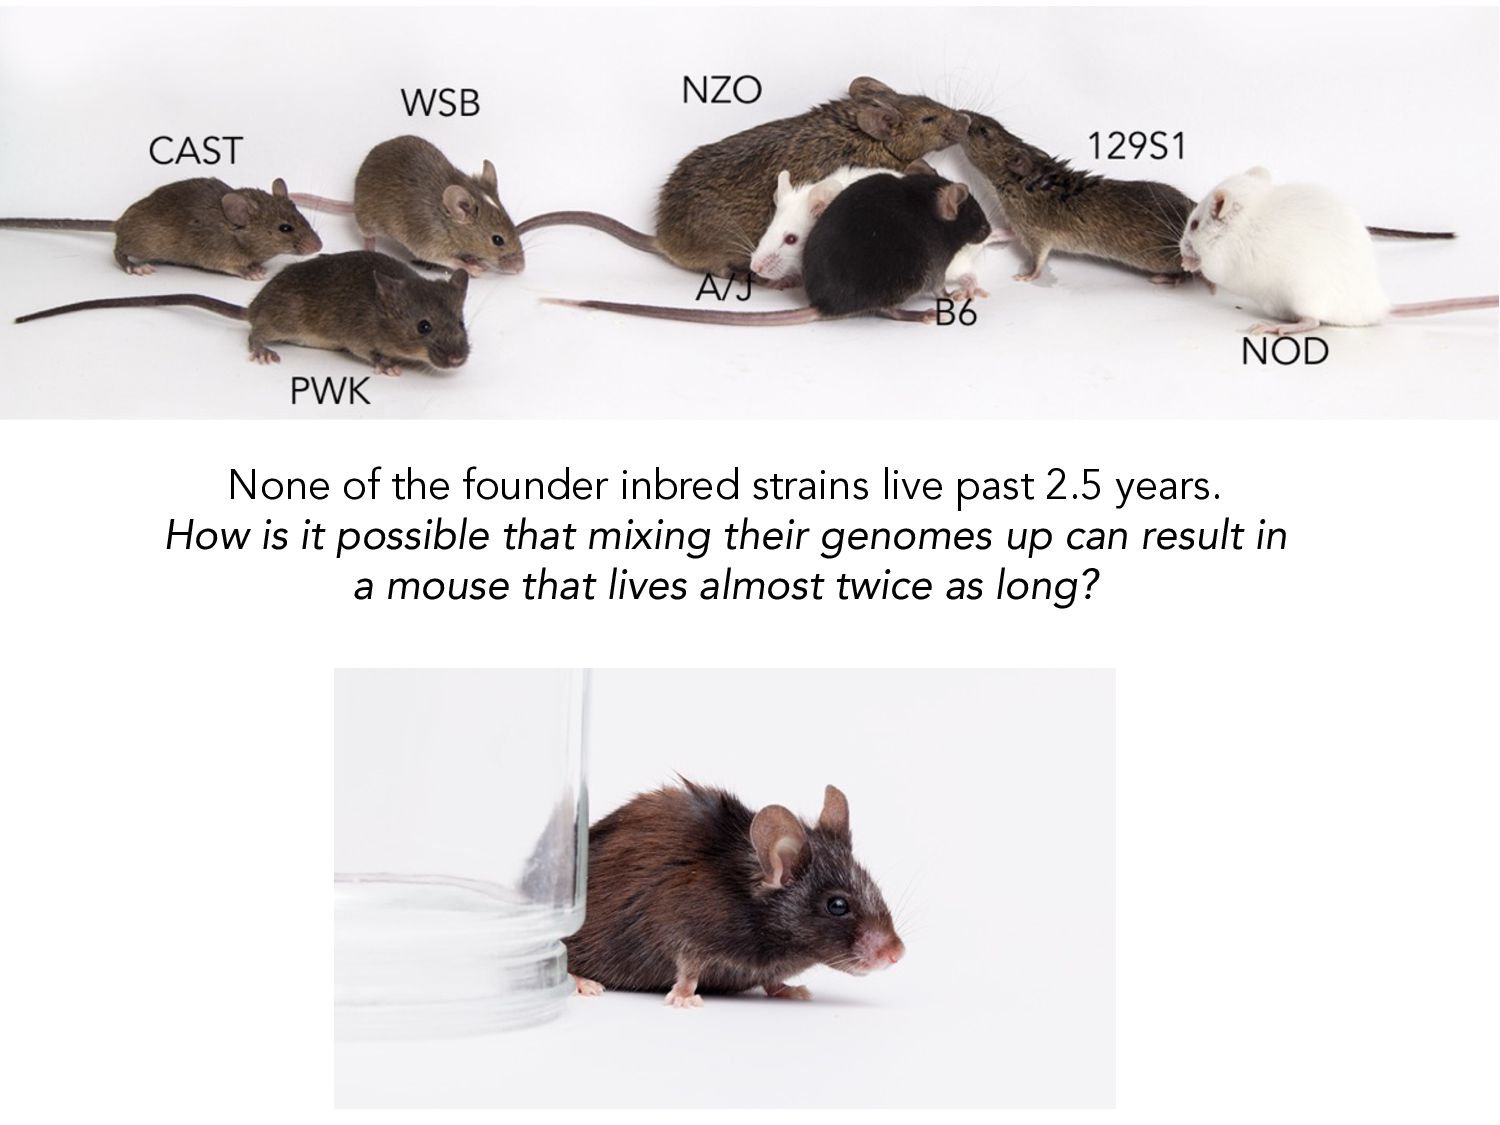
A/J C57BL/6J 129S1/SvImJ NOD/ShiLtJ NZO/LtJ CAST/EiJ PWK/PhJ WSB/EiJ *Nearly every gene in the genome has genetic variants segregating in the DO that are potentially functional
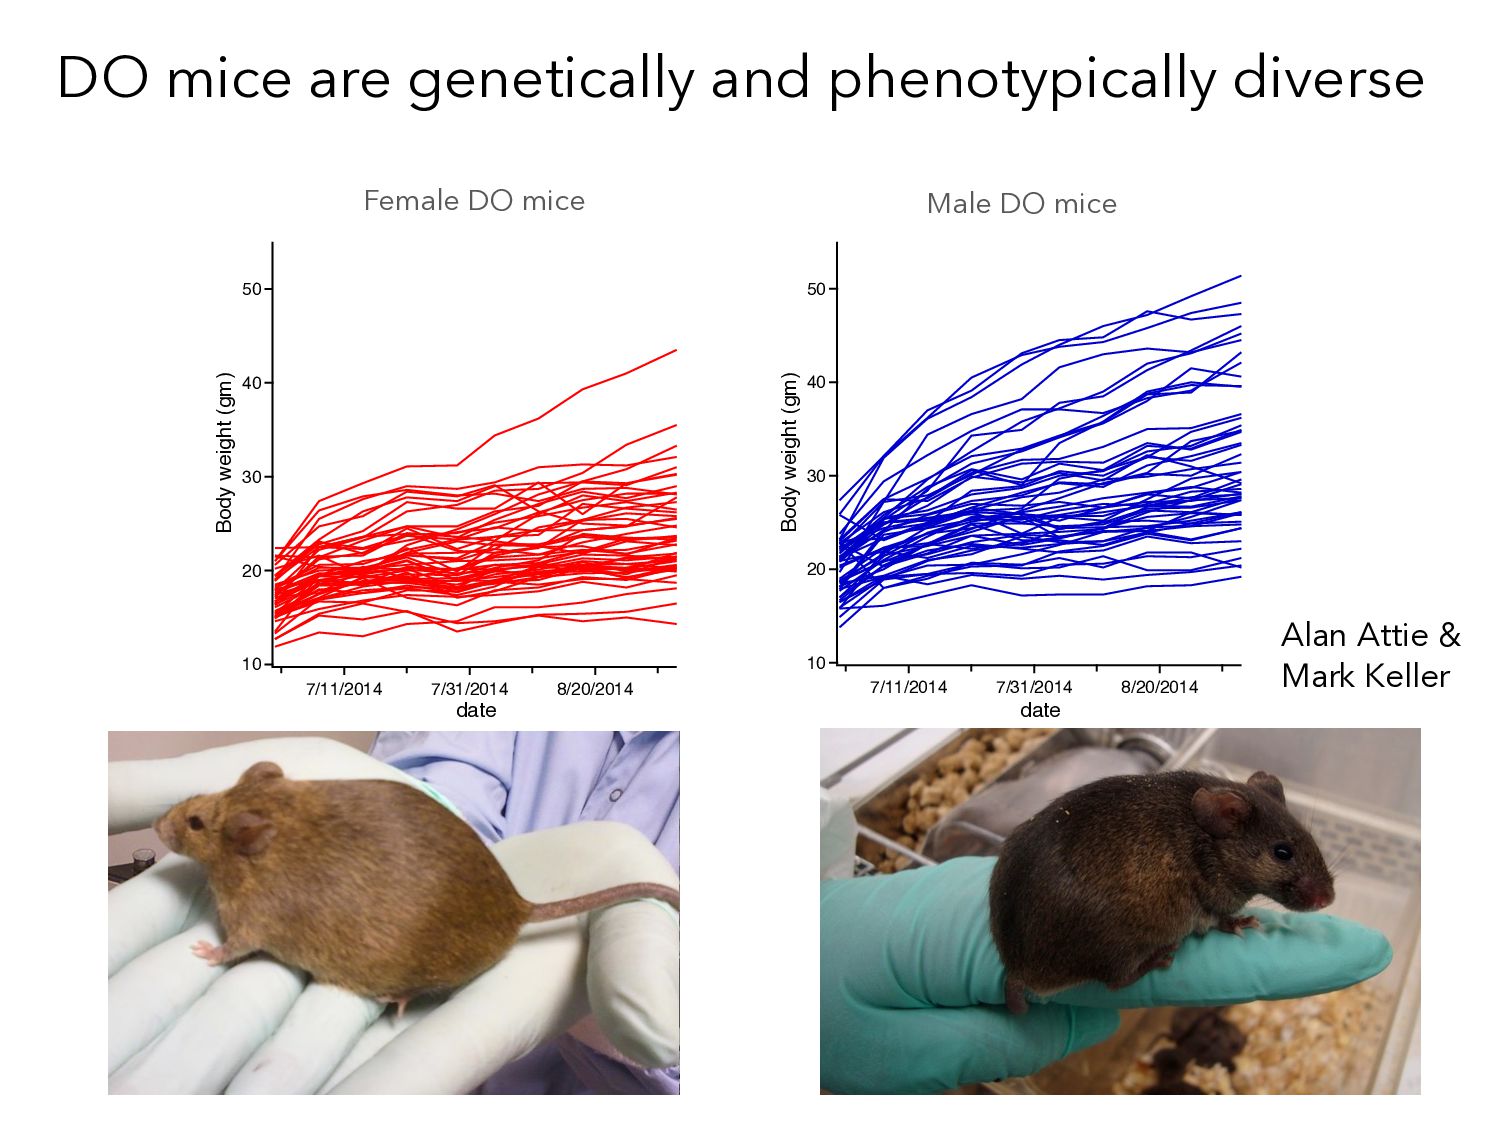
8/20/2014 date 50 40 30 20 10 Body weight (gm) 7/11/2014 7/31/2014 8/20/2014 date female DO mice male DO mice DO mice are genetically and phenotypically diverse Alan Attie & Mark Keller Female DO mice Male DO mice
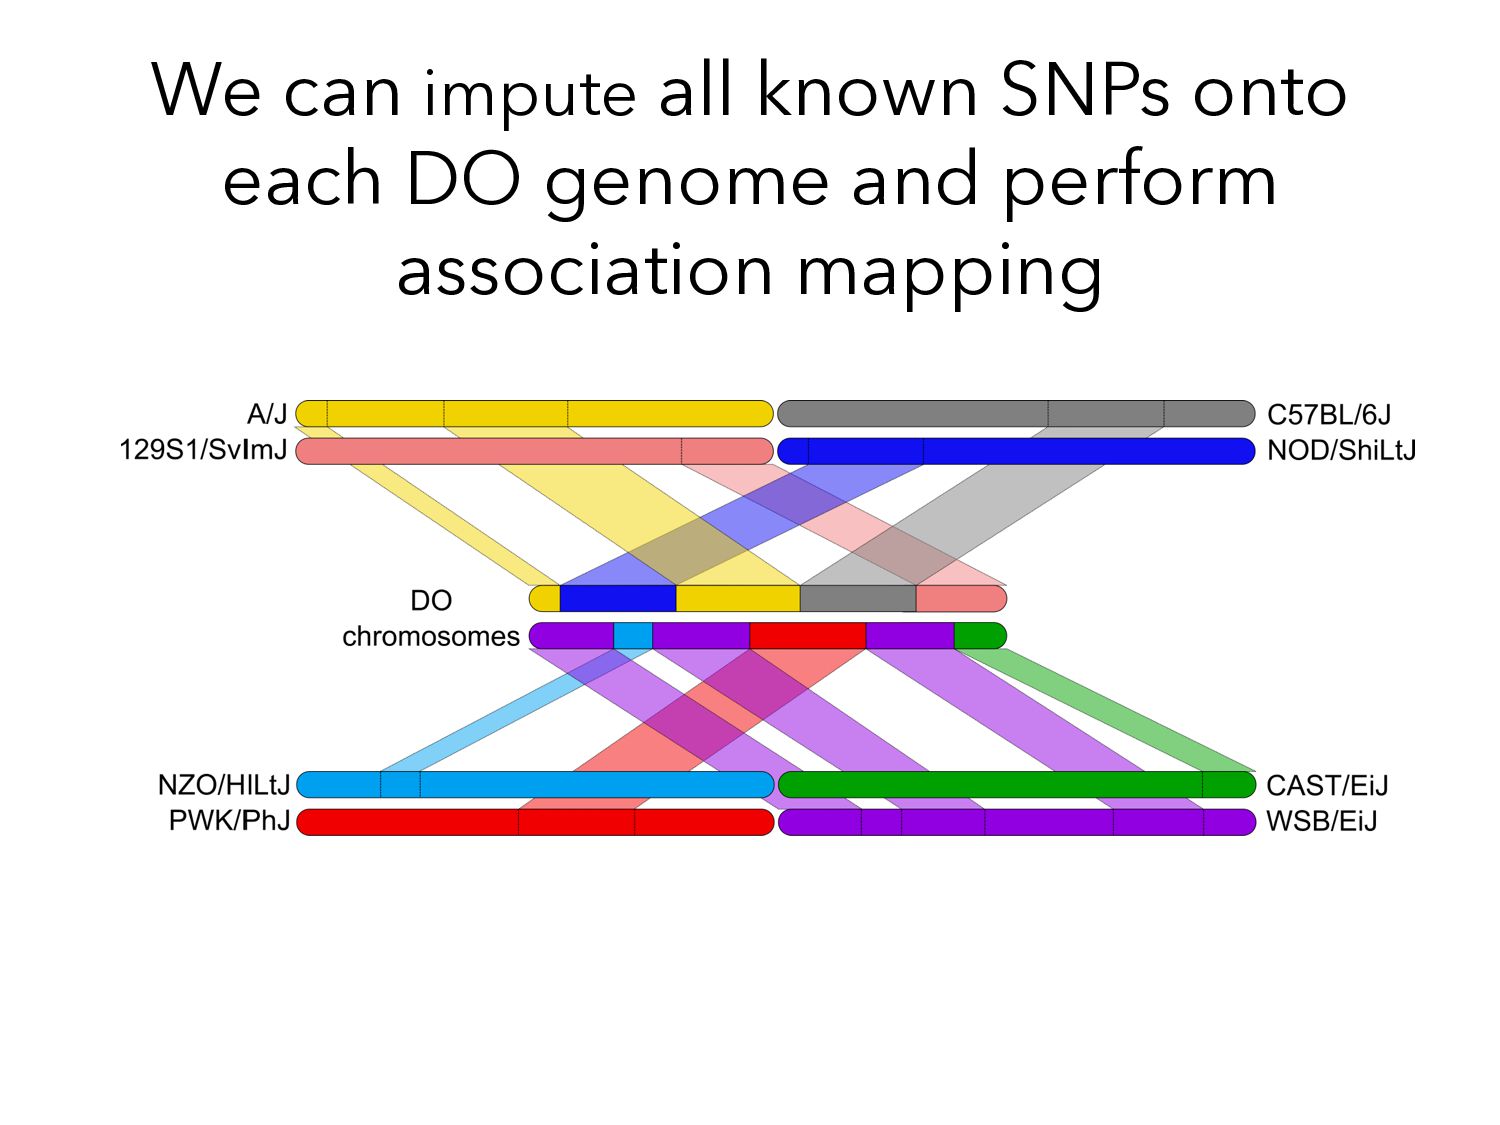
at every locus. A/J A BL6 B 129 C NOD D NZO E CAST F PWK G WSB H 1 2 3 4 5 6 7 8 9 10 11 12 13 14 15 16 17 18 19 20 21 22 23 24 25 26 27 28 29 30 31 32 33 34 35 36 A A A A A A A A B B B B B B B C C C C C C D D D D D E E E E F F F G G H A B C D E F G H B C D E F G H C D E F G H D E F G H E F G H F G H G H H Founder strains – 8 possible genotypes Diversity Outbred – 36 Possible Genotype states
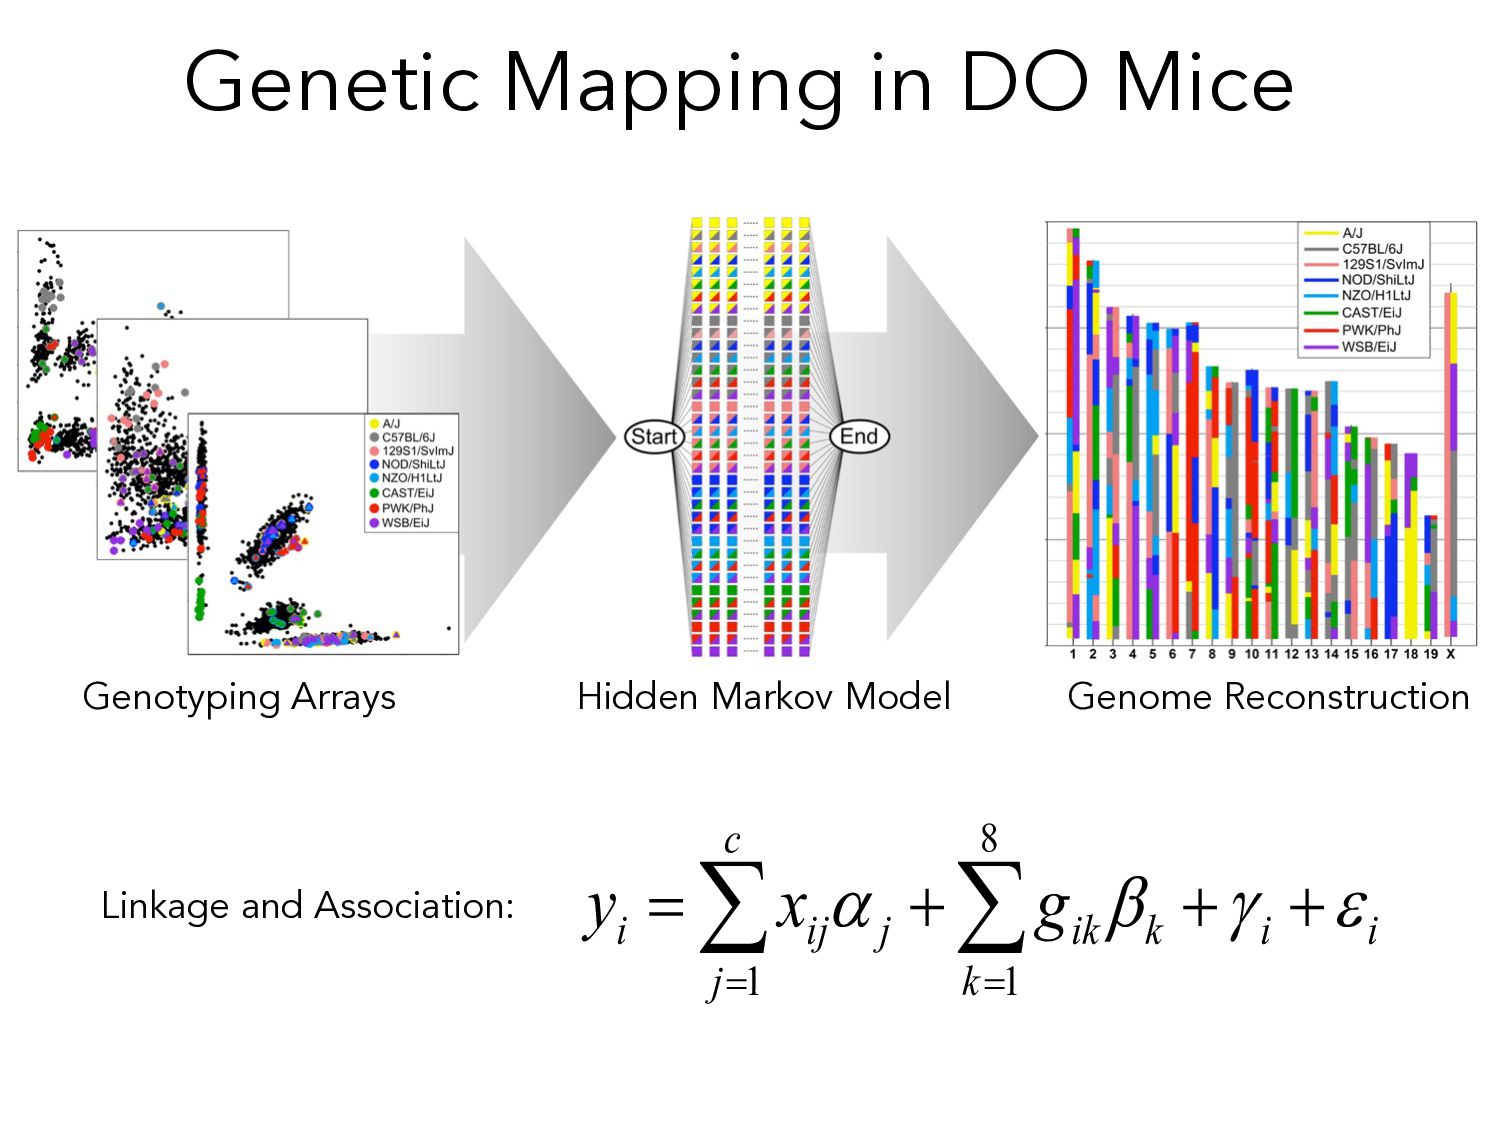
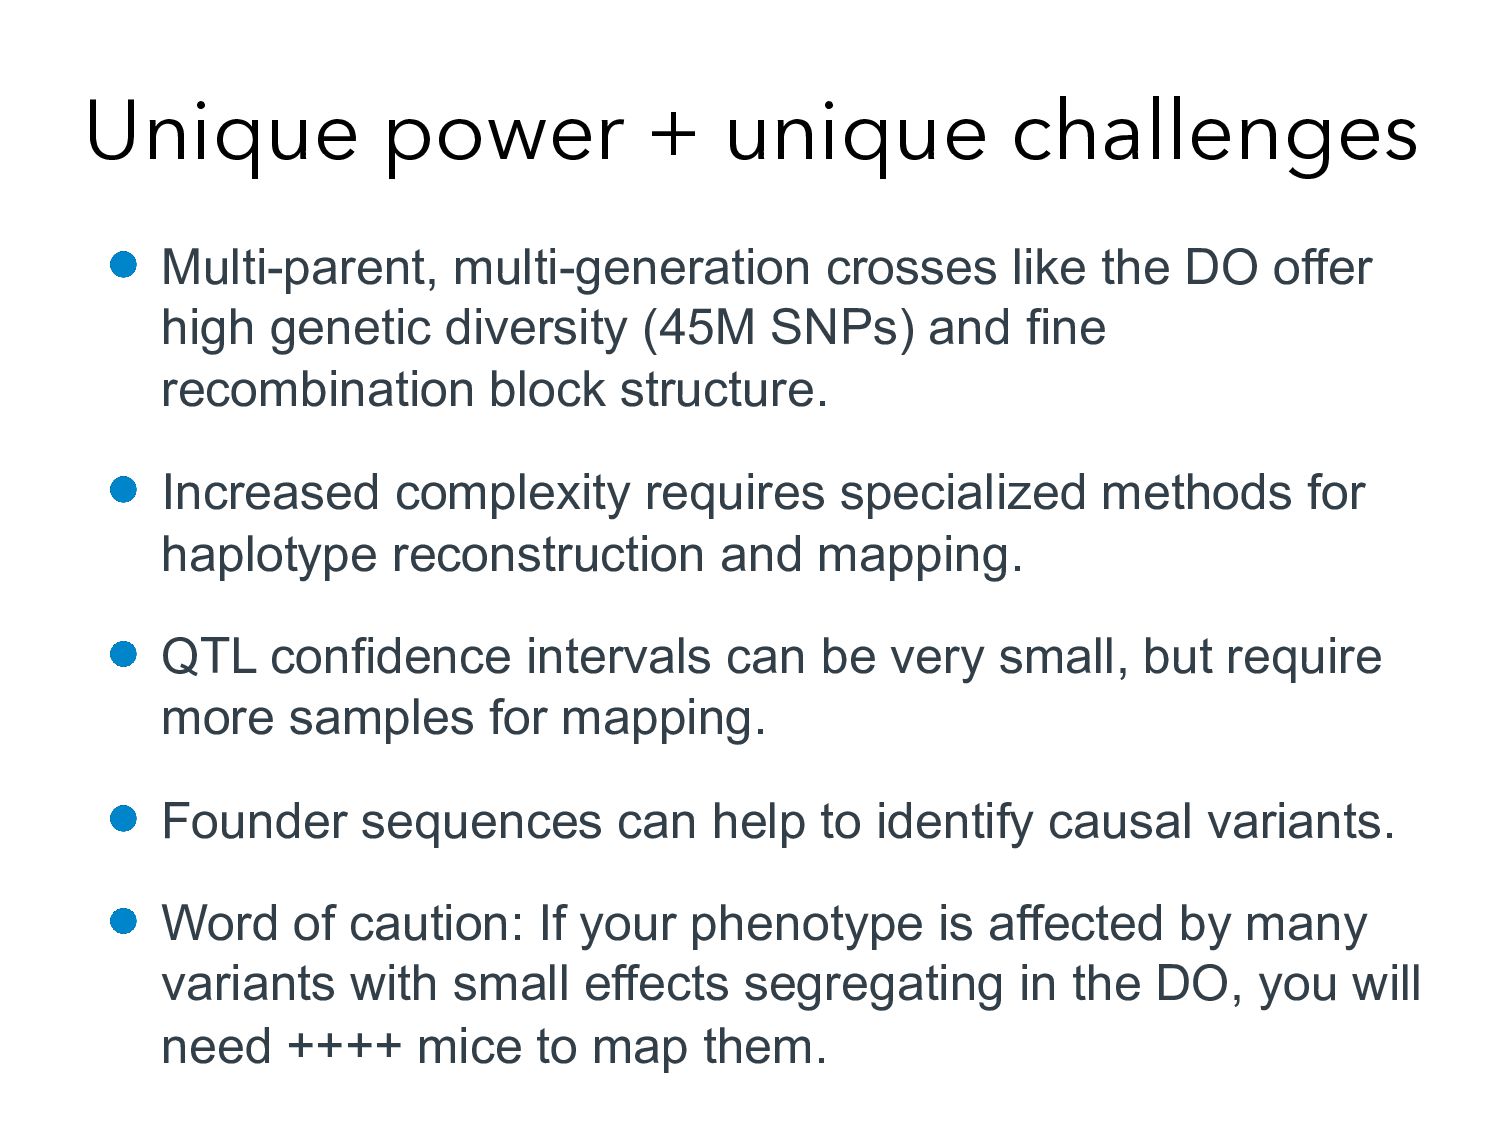
DO offer high genetic diversity (45M SNPs) and fine recombination block structure. Increased complexity requires specialized methods for haplotype reconstruction and mapping. QTL confidence intervals can be very small, but require more samples for mapping. Founder sequences can help to identify causal variants. Word of caution: If your phenotype is affected by many variants with small effects segregating in the DO, you will need ++++ mice to map them.
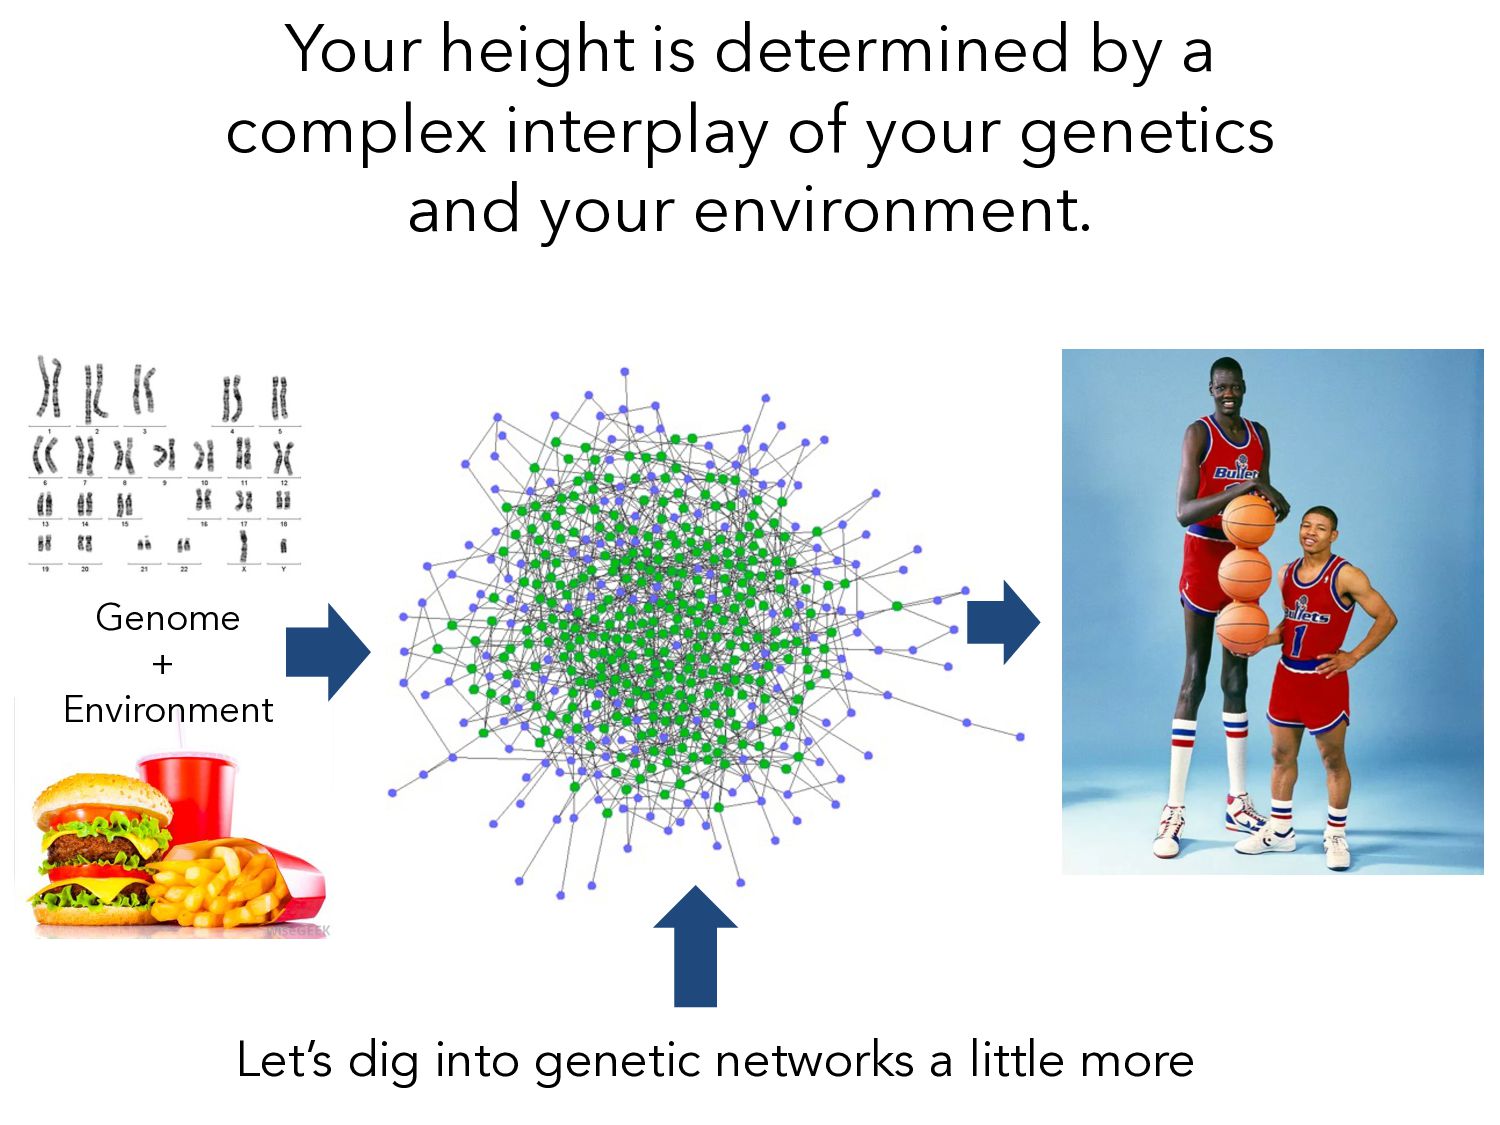
complex interactions between one’s genetic background and their environment. • No gene is an island. Genes interact within networks and pathways. • We can apply genetic mapping in human cohorts to identify risk variants associated with complex traits/diseases. • We can leverage the power of the mouse model and emerging diversity resources to refine and expand our understanding of complex human diseases.
and complex traits? • How do we study the genetic basis of complex traits in humans? • Why and how do we study complex traits in mice? • What is “21st Century Mouse Genetics”?
![Thank you! Alex Stanton Questions? Email [email protected]](https://files.speakerdeck.com/presentations/cfc0f7b01e2f4fc58aa3ea86f76e5a89/slide_114.jpg)