$30 off During Our Annual Pro Sale. View Details »

TAGC Meeting 2016

TAGC Meeting 2016

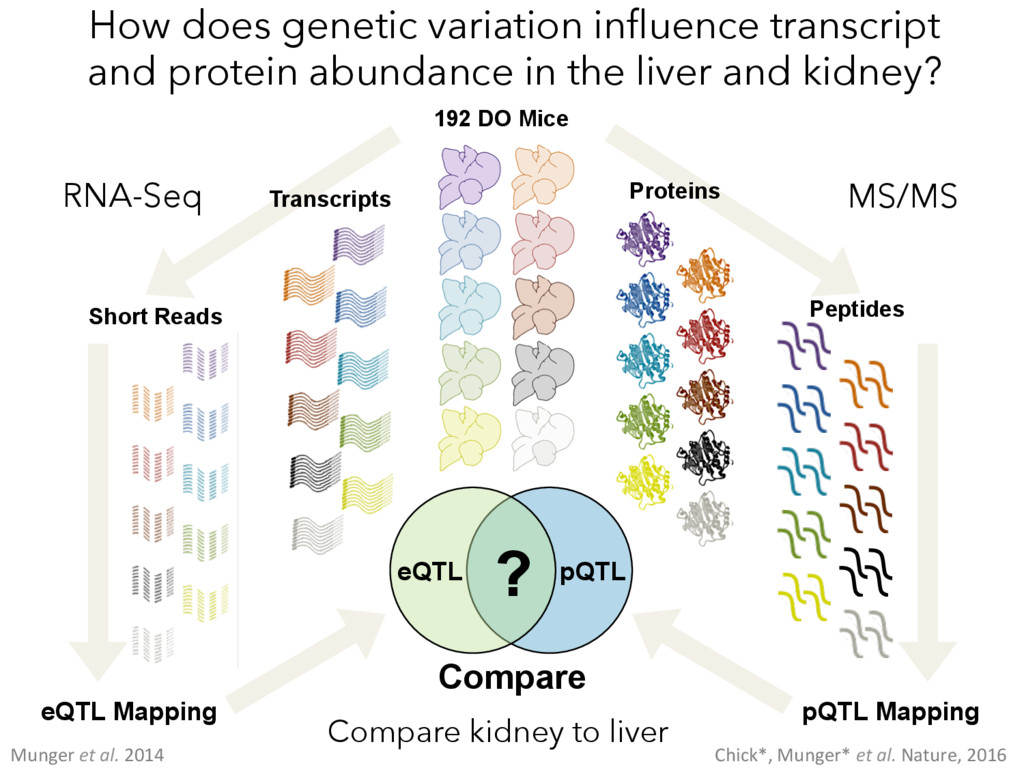
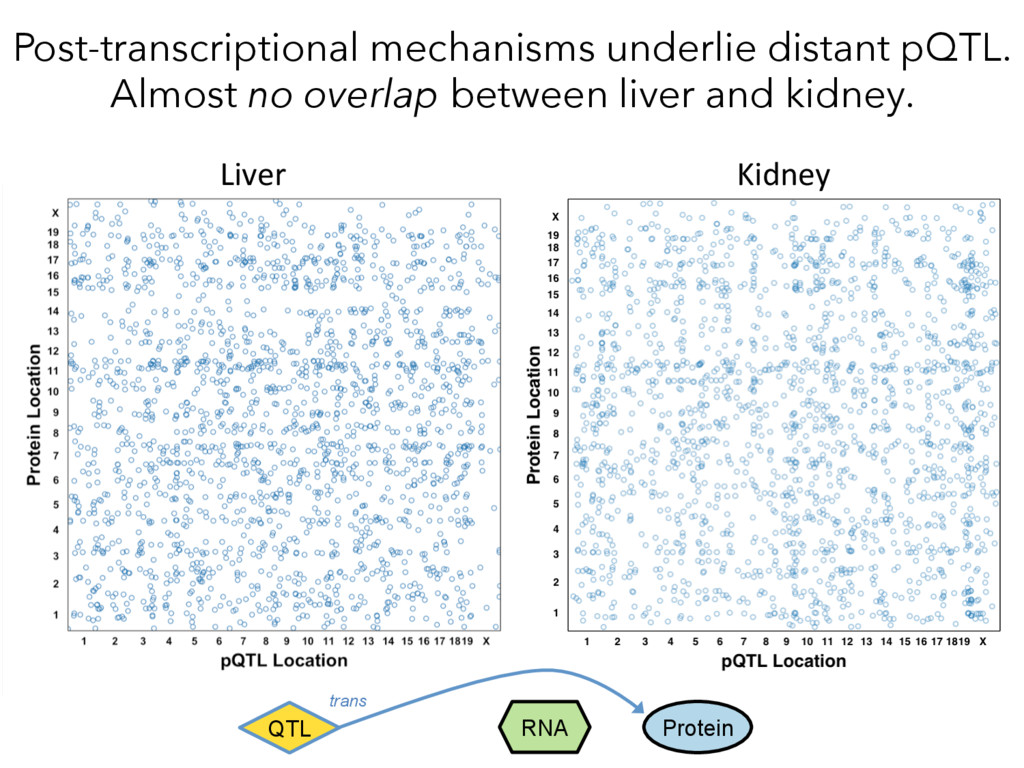
This presentation describes published pQTL data from the liver and compares it to *new* pQTL data from the kidney. Note: Conclusions about the tissue comparison are preliminary.

Steve Munger

July 14, 2016
Tweet

More Decks by Steve Munger

Other Decks in Research

Transcript

  1. The effects of natural genetic variation
    on transcript and protein abundance.
    Steve Munger
    The Jackson Laboratory
    Free your slides! https://speakerdeck.com/stevemunger
    Twitter: @stevemunger

    View Slide

  2. How does genetic variation impact
    transcript and protein abundance?
    DNA RNA Protein
    DNA RNA Protein
    Transcrip)on Transla)on
    DNA RNA Protein
    Francis Crick 1956

    View Slide

  3. Diversity Outbred (DO) mice:
    A designed discovery population.
    -  45M+ SNPS
    -  2M+ indels
    -  Balanced popula)on
    structure
    -  Each individual unique
    -  400+ recombina)ons
    in each animal
    - High heterozygosity

    View Slide

  4. 192 DO Mice
    Transcripts
    Short Reads
    RNA-Seq
    eQTL pQTL
    eQTL 
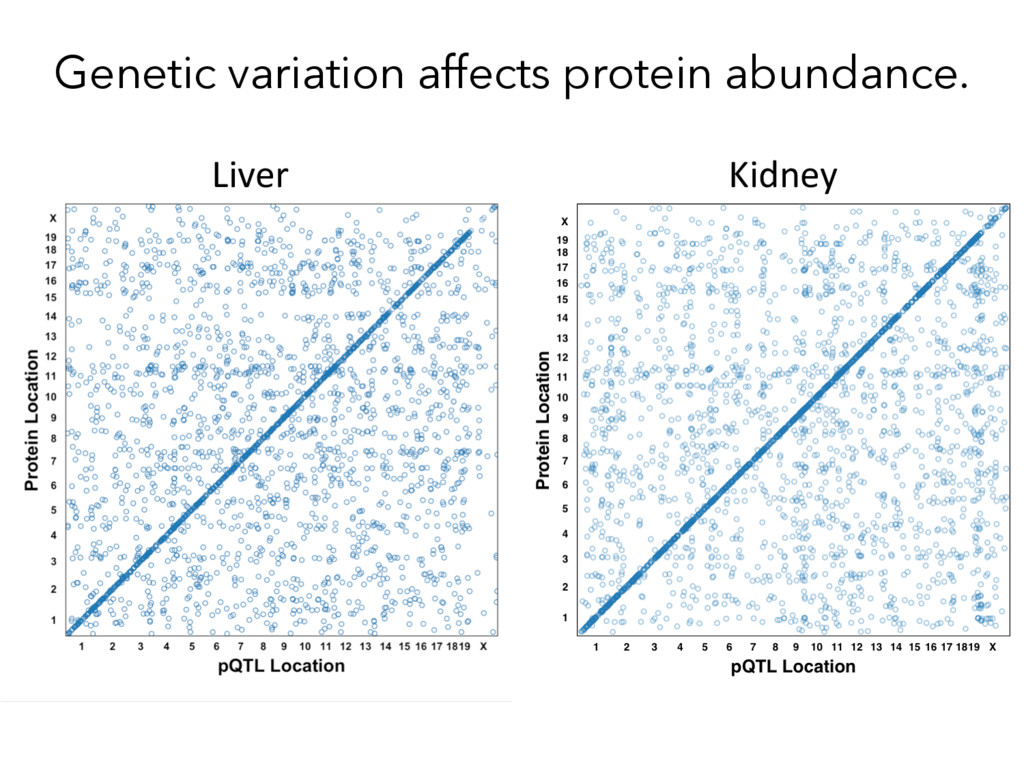
Mapping pQTL Mapping
    Proteins
    Peptides
    MS/MS
    Compare
    ?
    Munger et al. 2014 Chick*, Munger* et al. Nature, 2016
    How does genetic variation influence transcript
    and protein abundance in the liver and kidney?
    Compare kidney to liver

    View Slide

  5. Genetic variation affects protein abundance.
    Liver Kidney

    View Slide

  6. Liver
    Protein Location
    pQTL Location
    1 2 3 4 5 6 7 8 9 10 11 12 13 14 15 16 17 1819 X
    1
    2
    3
    4
    5
    6
    7
    8
    9
    10
    11
    12
    13
    14
    15
    16
    17
    18
    19
    X


    Transcriptional mechanisms underlie most local pQTL.
    Half of local pQTL affect both liver and kidney.
    QTL RNA Protein
    cis cis
    Kidney

    View Slide

  7. Example: DHTKD1– Cis pQTL liver, Cis pQTL kidney
    Liver
    Kidney

    View Slide

  8. Genetic variant(s) with conserved effects in liver & kidney.
    Founder strain coefficients
    at peak QTL SNP
    r = 0.99

    View Slide

  9. Example: LDHA – Cis pQTL liver, Cis pQTL kidney
    Kidney
    Liver

    View Slide

  10. Local variant(s) cause opposite tissue effects on LDHA expression.
    r = -0.88

    View Slide

  11. Example: MESDC2 – Cis pQTL liver, No pQTL kidney
    Liver
    Kidney

    View Slide

  12. No cis pQTL in kidney, but …
    Kidney founder coefficients
    match what we see in the liver.
    Effects are subtle, but there.
    r = 0.93

    View Slide

  13. Distant pQTL are abundant.
    Liver Kidney

    View Slide

  14. Post-transcriptional mechanisms underlie
    nearly all distant pQTL.
    Protein Location
    pQTL Location
    1 2 3 4 5 6 7 8 9 10 11 12 13 14 15 16 17 1819 X
    1
    2
    3
    4
    5
    6
    7
    8
    9
    10
    11
    12
    13
    14
    15
    16
    17
    18
    19
    X


    Liver Kidney
    cis
    RNA Protein
    QTL
    trans

    View Slide

  15. Post-transcriptional mechanisms underlie distant pQTL.
    Almost no overlap between liver and kidney.
    RNA Protein
    QTL
    trans
    Liver Kidney

    View Slide

  16. Searching for protein and transcript mediators
    of distant pQTL –> 
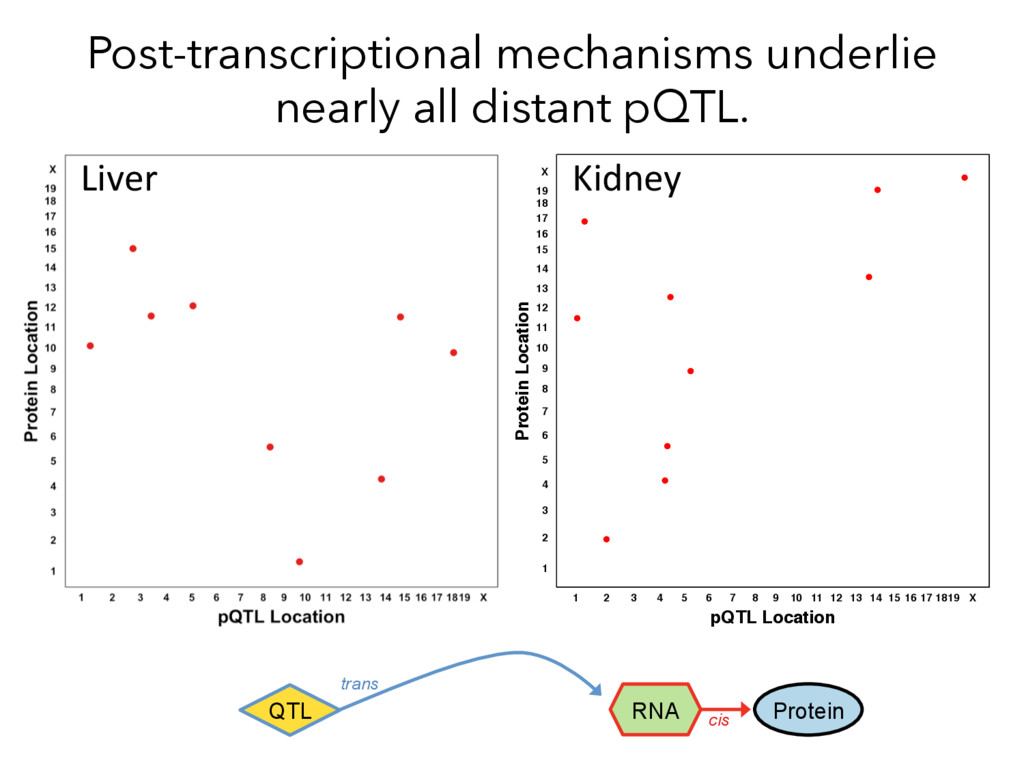
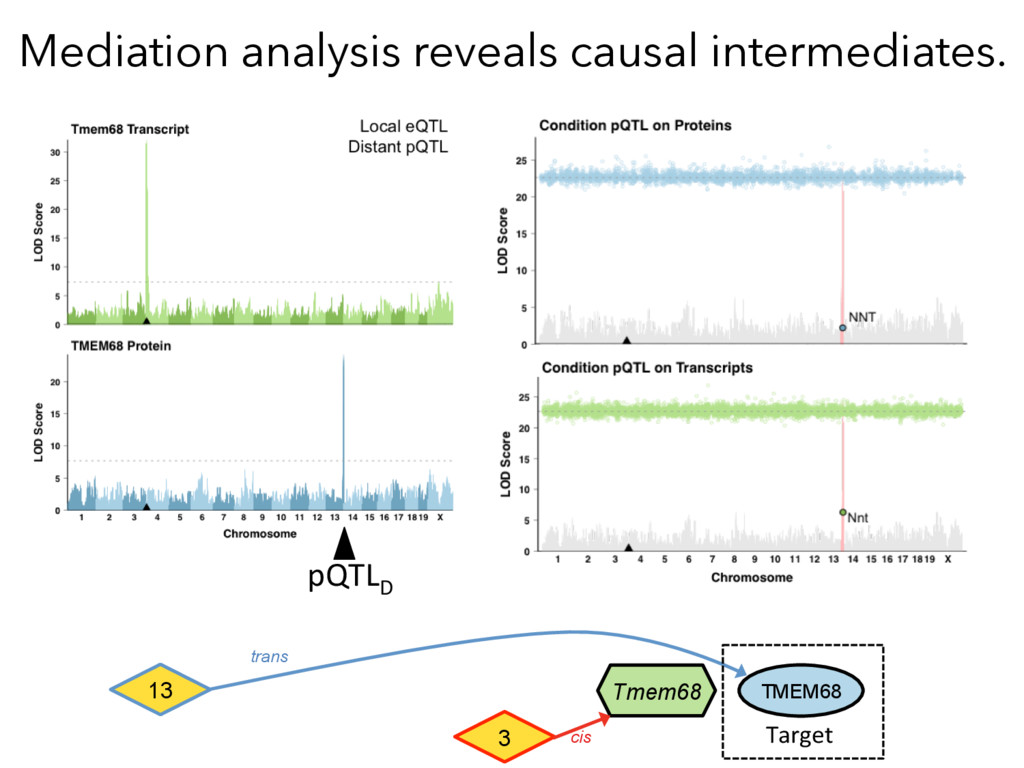
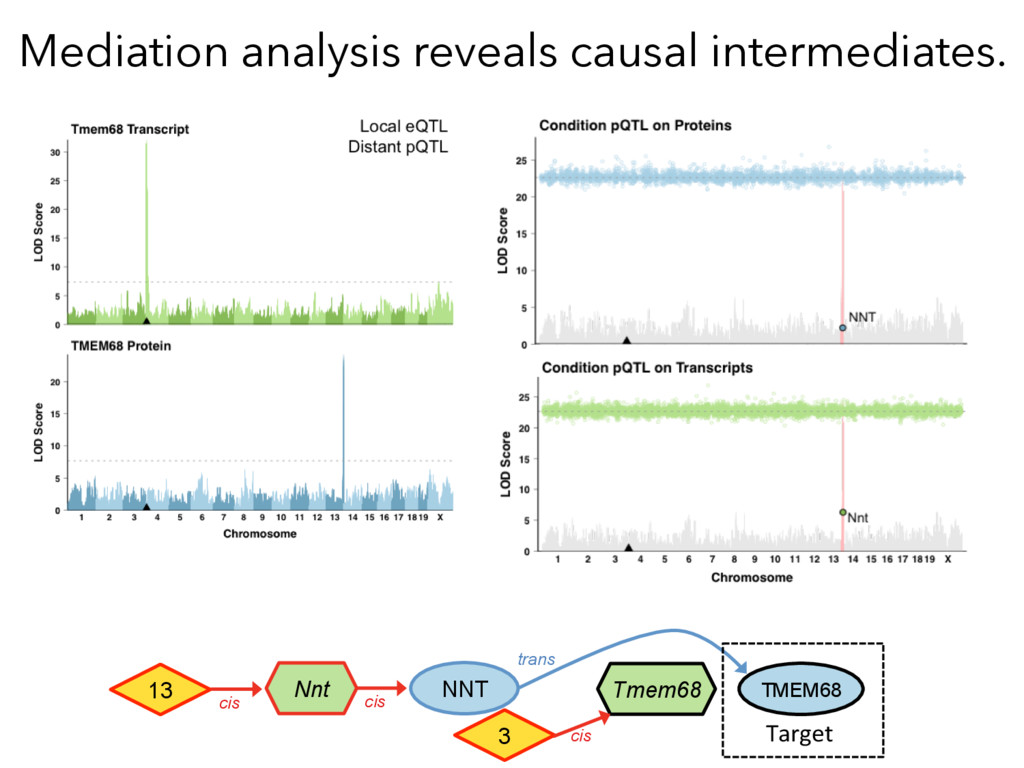
Mediation Analysis
    RNA Protein
    QTL
    trans
    cis
    RNA Protein
    Target
    Causal Intermediates
    RNA Protein
    trans
    QTL
    cis
    Target
    Target Protein ~ pQTLdistant
    Target Protein ~ pQTLdistant
    + MediatorProtein
    x 8000 proteins
    Target Protein ~ pQTLdistant
    + MediatorRNA
    x 21000 Transcripts
    X

    View Slide

  17. Mediation analysis reveals causal intermediates.
    pQTLD
    Tmem68 TMEM68
    trans
    13
    Target
    3 cis

    View Slide

  18. Tmem68 TMEM68
    trans
    13
    cis
    Target
    3 cis
    cis
    Nnt NNT
    Mediation analysis reveals causal intermediates.

    View Slide

  19. “Pulling the (genetic) weeds” to identify
    mediators of subthreshold pQTL.
    PRODH2
    “Weeds”
    Step 1: Condi)on out the giant cis effect.

    View Slide

  20. Mediation analysis to identify subtle genetic interactions
    Step 2: Mediate 
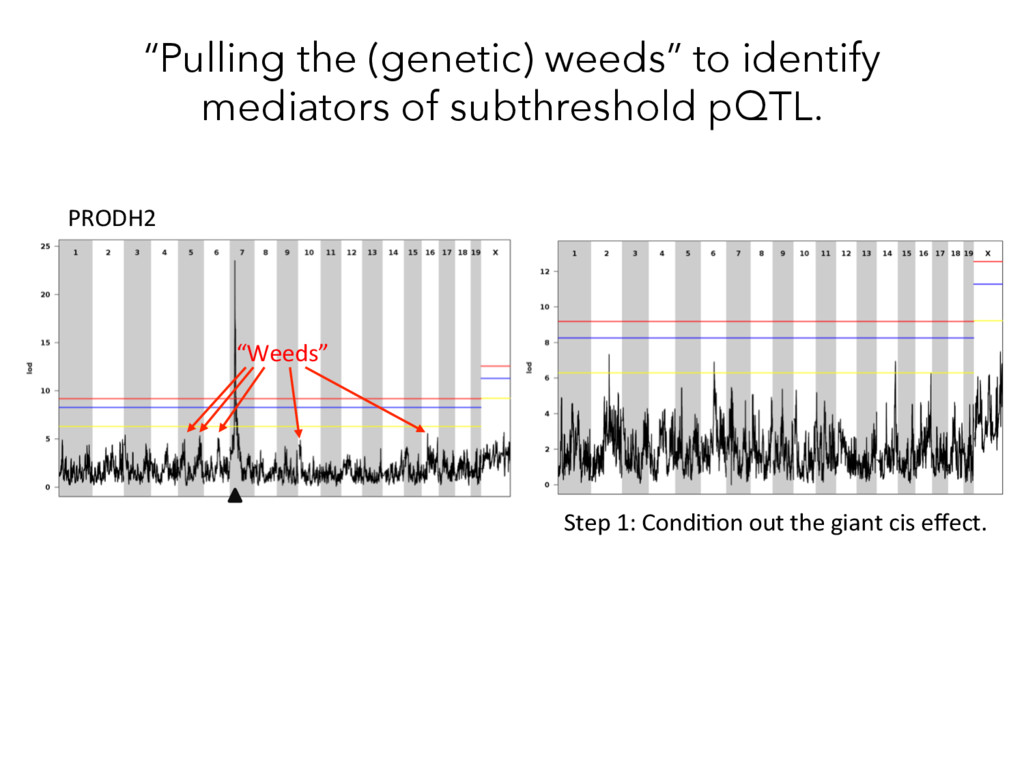
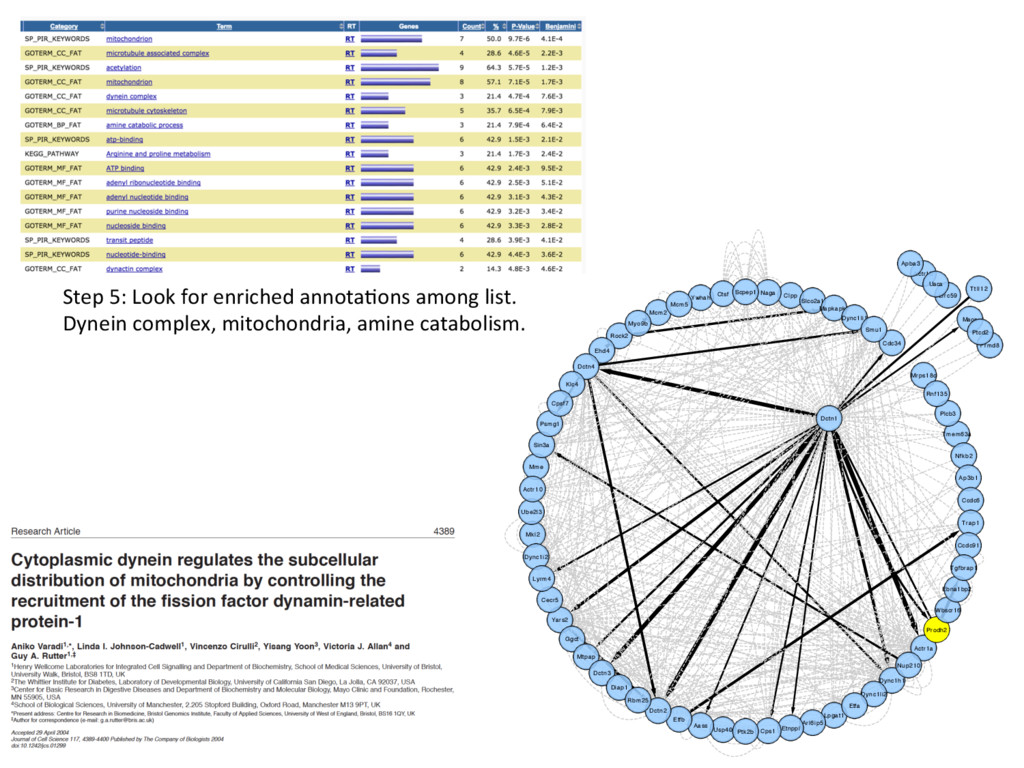
all subthreshold peaks LOD > 5.
    Aka “Pull the weeds”.
    Step 3: Repeat process for all 8k proteins.
    Step 4: Find proteins that share same
    subthreshold peak and mediator

    View Slide

  21. Lpgat1
    Dync1h1
    Actr1a
    Nup210
    Arl6ip5
    Dync1li2
    Prodh2
    Wbscr16
    Etfa
    Ywhah
    Rock2
    Ctsf
    Mcm2
    Myo9b
    Ehd4
    Mcm5
    Frmd8
    Mrps18c
    Maoa
    Ttll12
    Actr1b
    Apba3
    Lrrc59
    Cdc34
    Uaca
    Ptcd2
    Dctn1
    Tmem63a
    Nfkb2
    Plcb3
    Ap3b1
    Rnf135
    Ccdc6
    Trap1
    Yars2
    Ggct
    Mtpap
    Dctn3
    Diap1
    Etnppl
    Cps1
    Usp40
    Aass
    Etfb
    Dctn2
    Rbm25
    Ptk2b
    Mme
    Mkl2
    Ube2l3
    Actr10
    Ccdc91
    Ebna1bp2
    Cecr5
    Tgfbrap1
    Dync1i2
    Lyrm4
    Dctn4
    Klc4
    Sin3a
    Psmg1
    Cpsf7
    Clpp
    Slco2a1
    Mapkapk2
    Dync1li1
    Smu1
    Naga
    Scpep1
    Step 5: Look for enriched annota)ons among list.
    Dynein complex, mitochondria, amine catabolism.

    View Slide

  22. Natural gene)c perturba)ons +
    Media)on analysis = Predic)ve
    Protein Network
    Cytoscape Visualiza)on

    View Slide

  23. Conclusions
    •  Transcriptional mechanisms are responsible for most local
    pQTL, 
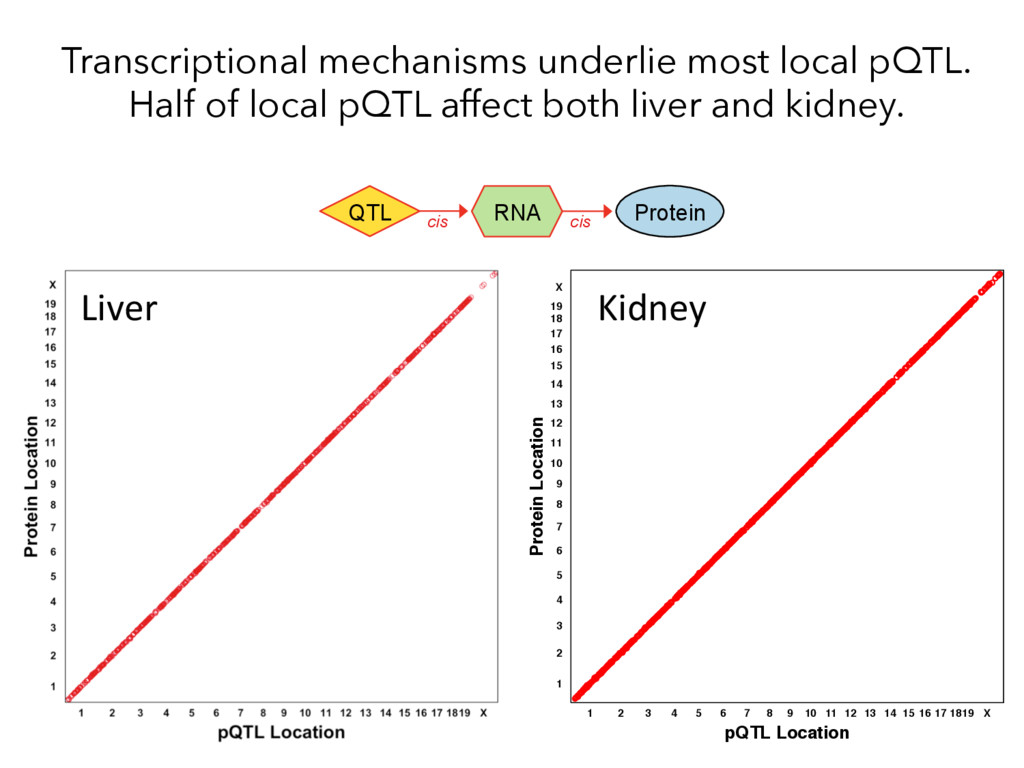
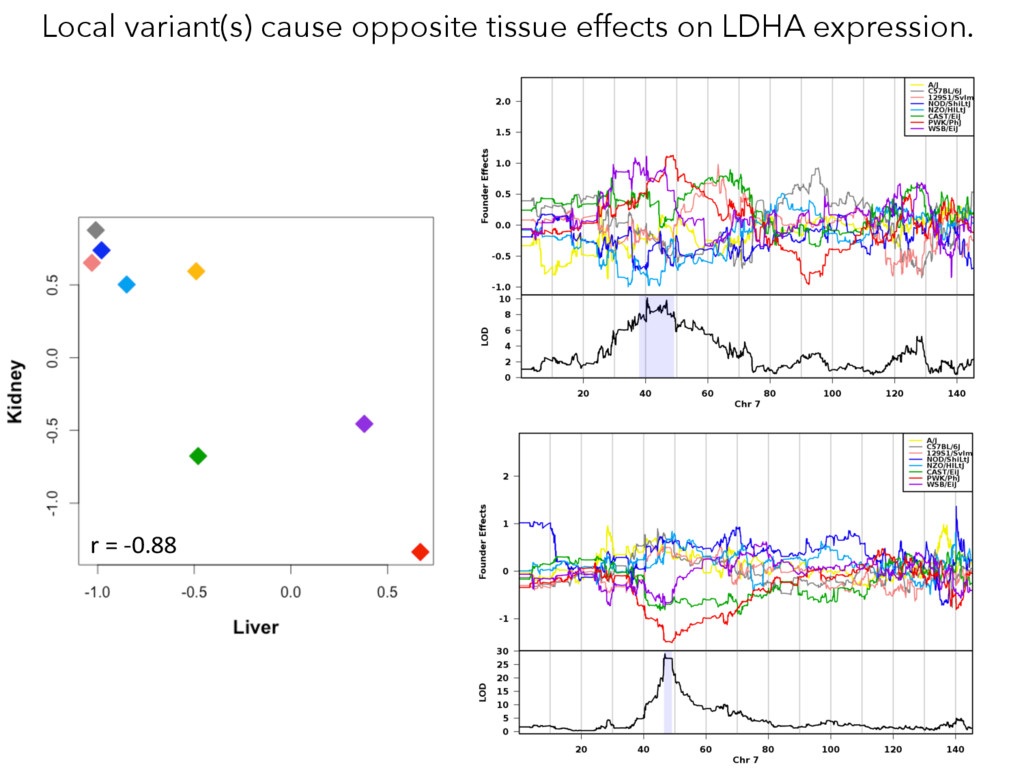
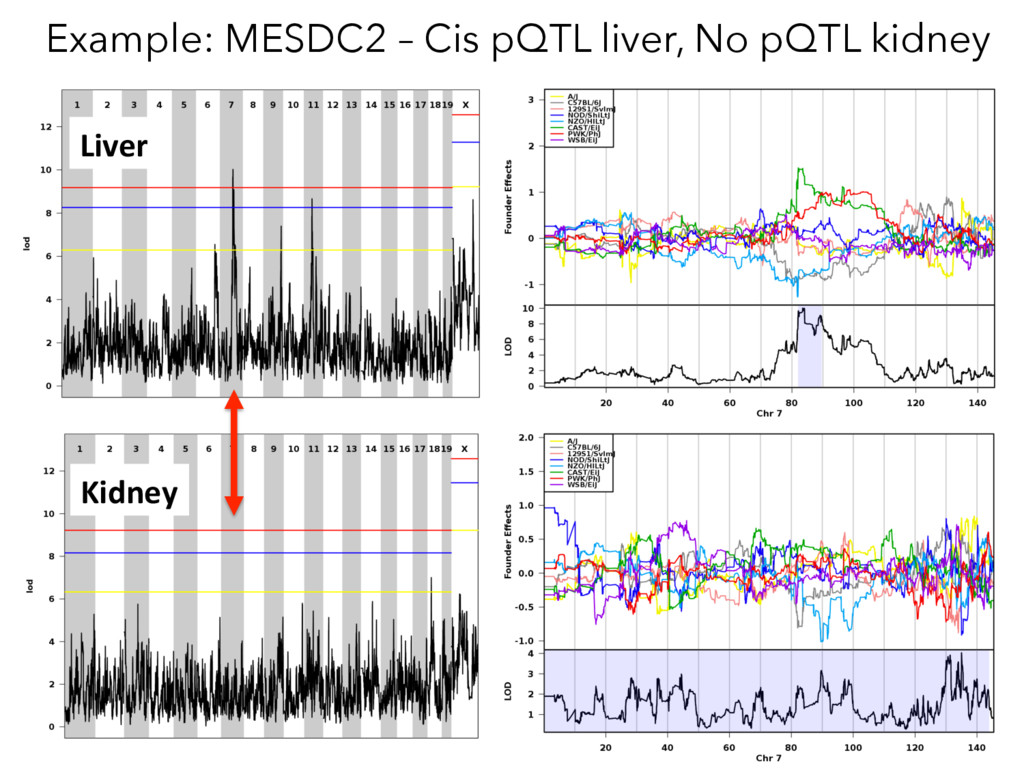
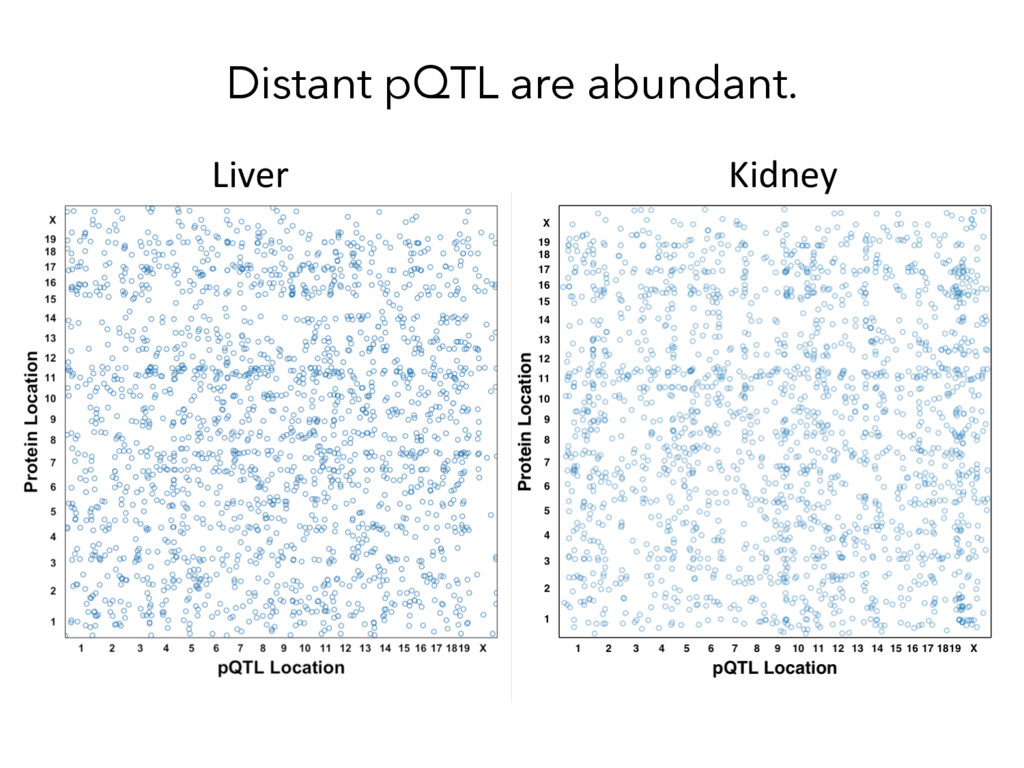
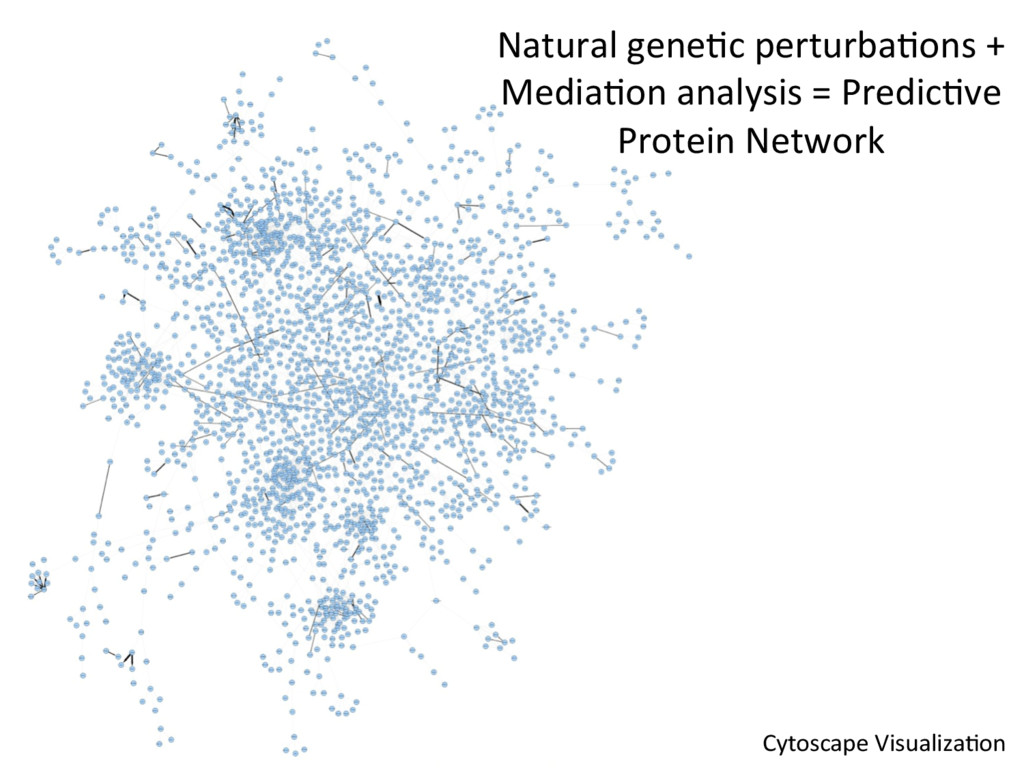
but…
    –  Most local variants that affect transcript levels do not
    affect protein levels.
    •  Post-transcriptional mechanisms underlie all but a few of
    distant pQTL.
    –  Very few distant pQTL shared by liver and kidney.
    •  Mediation analysis can identify protein intermediates that
    confer significant or subtle effects on protein abundance.
    •  Tissue-specific local e/pQTL drive tissue-specific distant
    pQTL.

    View Slide

  24. Acknowledgments

    View Slide

  25. View Slide

  26. Slides can be downloaded at https://speakerdeck.com/stevemunger
    Lab website: mungerlab.com
    Twitter: @stevemunger

    View Slide