• The importance of a good experimental design • Quality Control • Read alignment • QuanJfying isoform and gene expression • NormalizaJon of expression esJmates
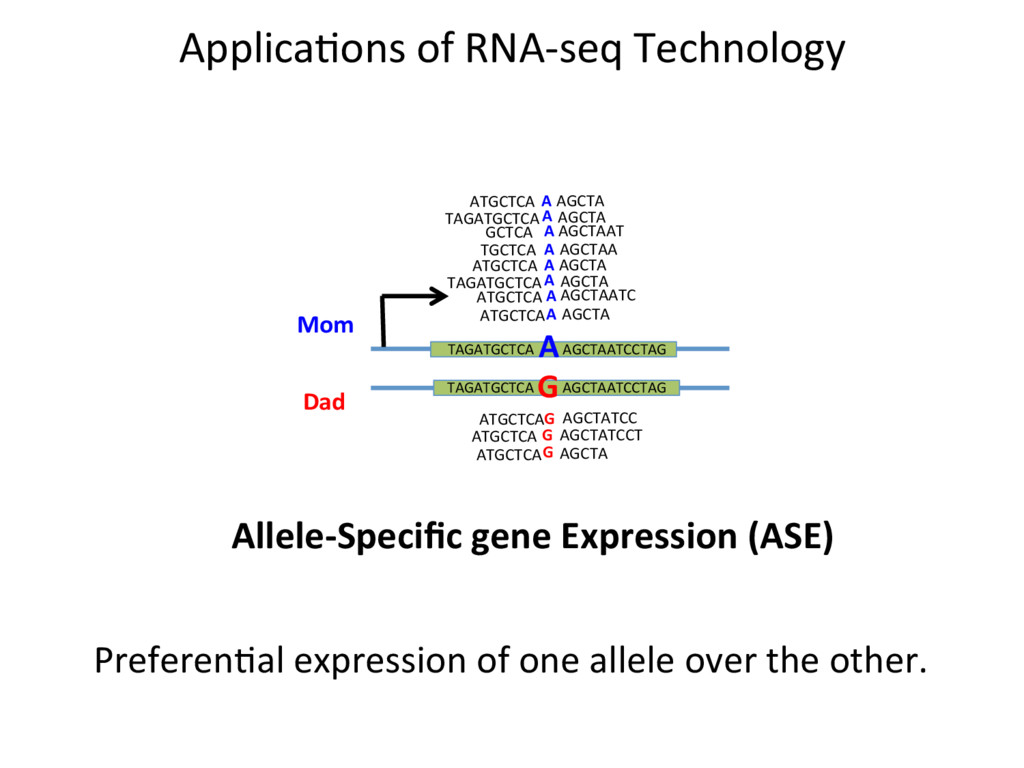
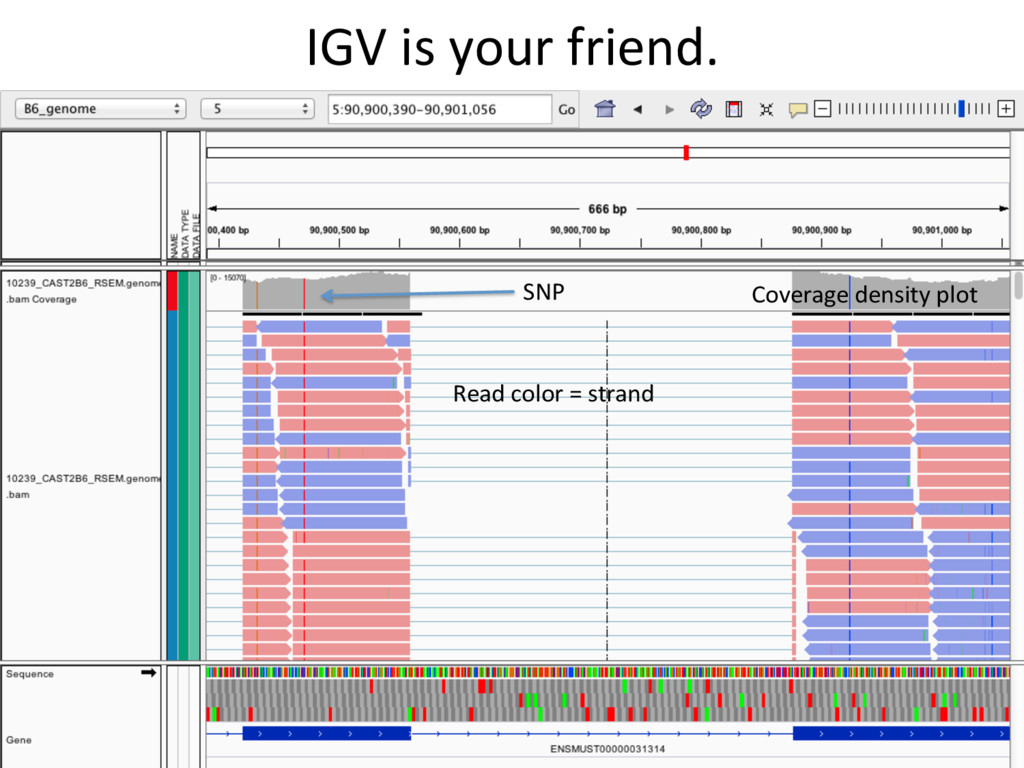
A G A A A ATGCTCA TAGATGCTCA AGCTA ATGCTCA AGCTAATC ATGCTCA AGCTA AGCTA A G G G ATGCTCA AGCTATCC ATGCTCA AGCTATCCT ATGCTCA AGCTA A A A ATGCTCA TAGATGCTCA AGCTA GCTCA AGCTAAT TGCTCA AGCTAA AGCTA A Allele-Specific gene Expression (ASE) PreferenJal expression of one allele over the other.
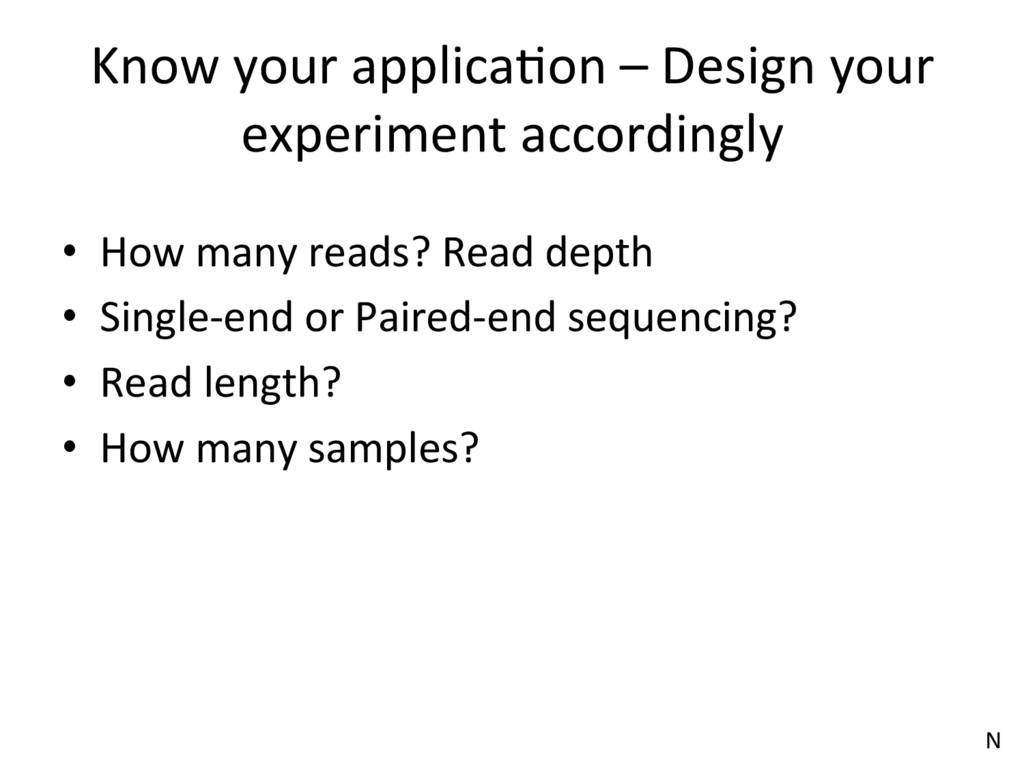
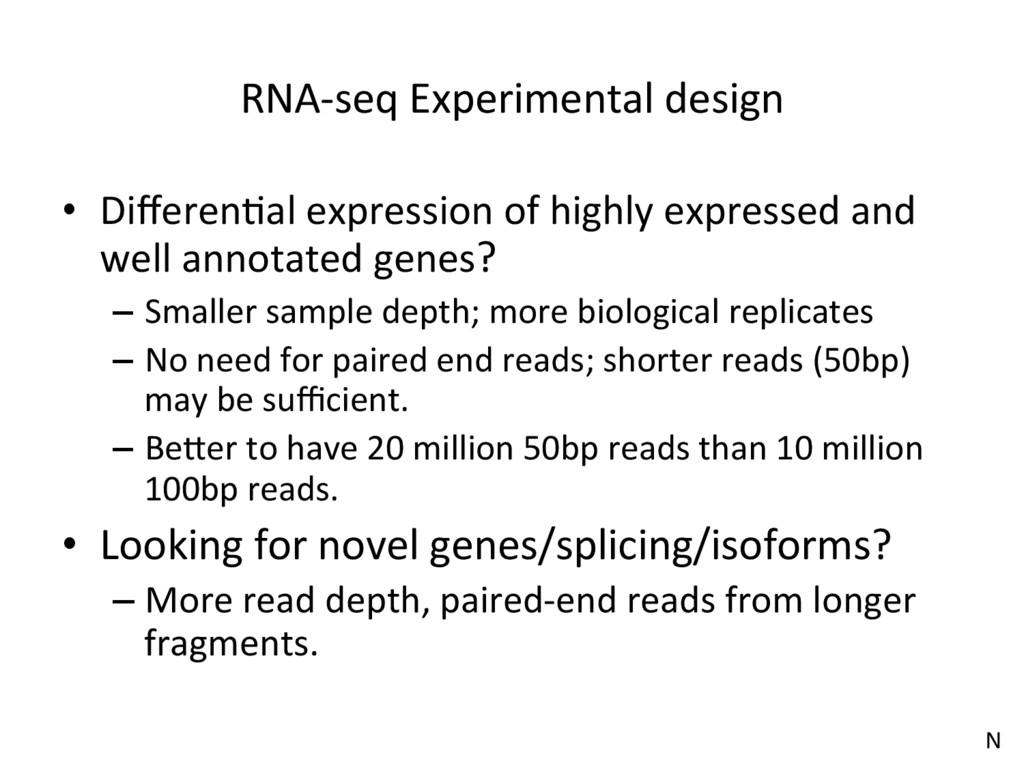
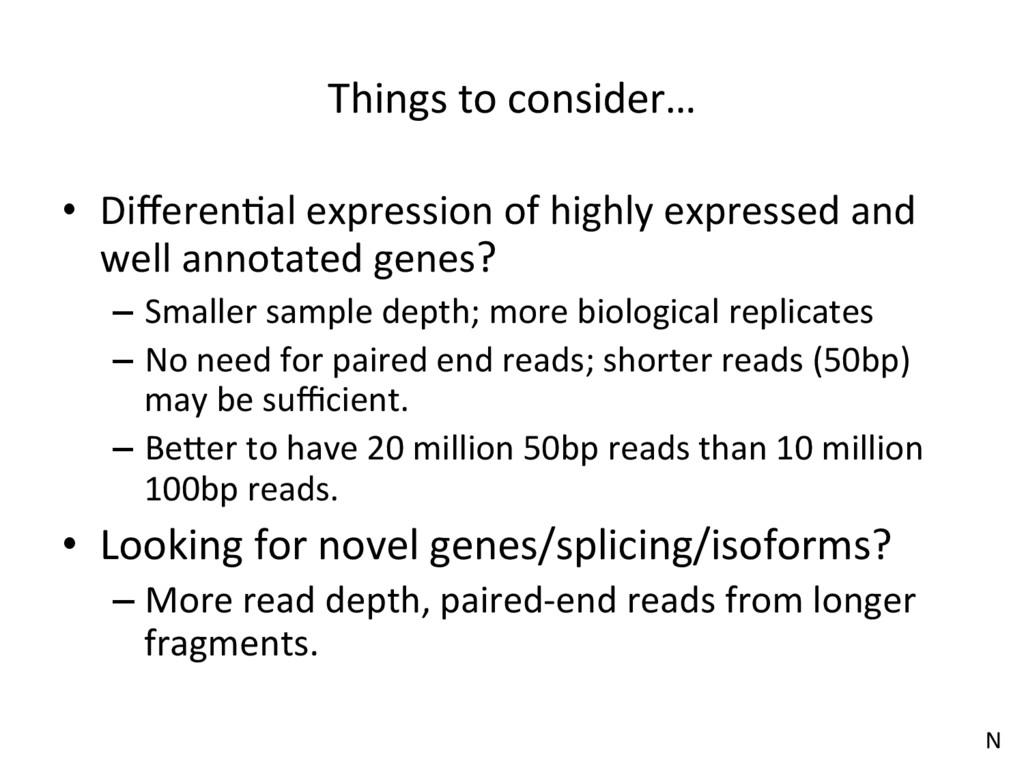
well annotated genes? – Smaller sample depth; more biological replicates – No need for paired end reads; shorter reads (50bp) may be sufficient. – Beder to have 20 million 50bp reads than 10 million 100bp reads. • Looking for novel genes/splicing/isoforms? – More read depth, paired-end reads from longer fragments. N
Jle number Instrument: run/flowcell id The member of a pair Millions and millions of reads… @HISEQ2000_0074:8:1101:7544:2225#TAGCTT/1 TCACCCGTAAGGTAACAAACCGAAAGTATCCAAAGCTAAAAGAAGTGGACGACGTGCTTGGTGGAGCAGCTGCATG + CCCFFFFFHHHHDHHJJJJJJJJIJJ?FGIIIJJJJJJIJJJJJJFHIJJJIJHHHFFFFD>AC?B??C?ACCAC>BB<<<>C@CCCACCCDCCIJ Phred Score: Q = -10 log10 P 10 indicates 1 in 10 chance of error 20 indicates 1 in 100, 30 indicates 1 in 1000, SN
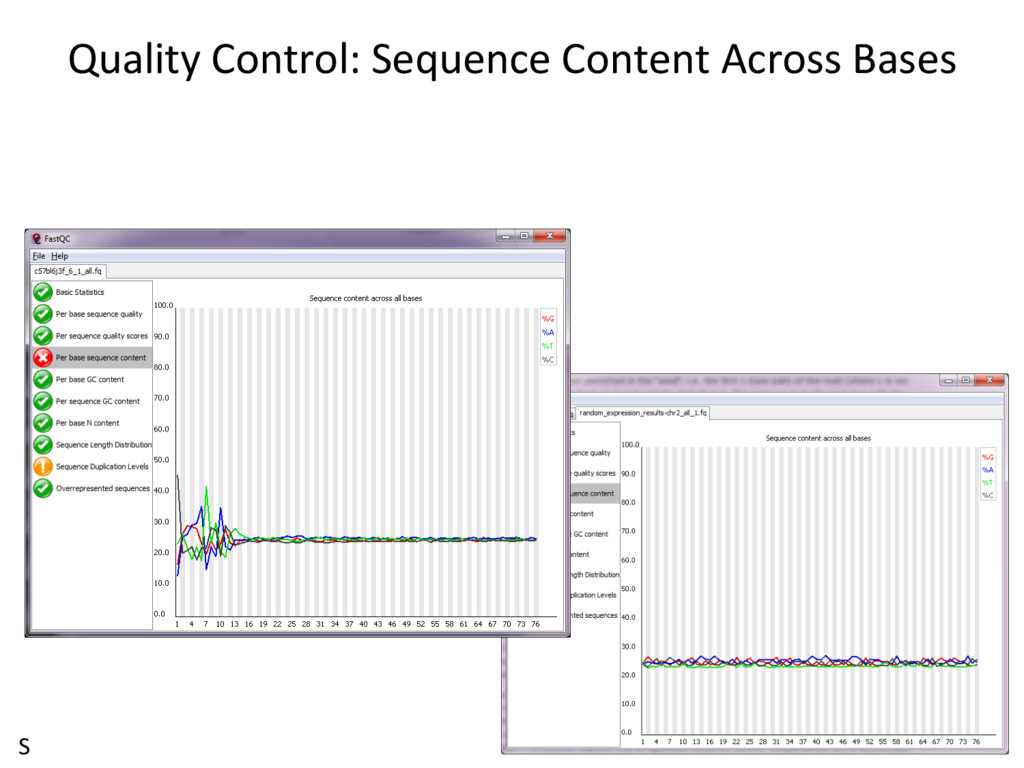
Data Preprocessing Quality Control: How to tell if your data is clean S RNA-seq Data: Zp://Zp.jax.org/dgau/MouseGen2016/ • B6-100K.fastq and Cast-100K.fastq
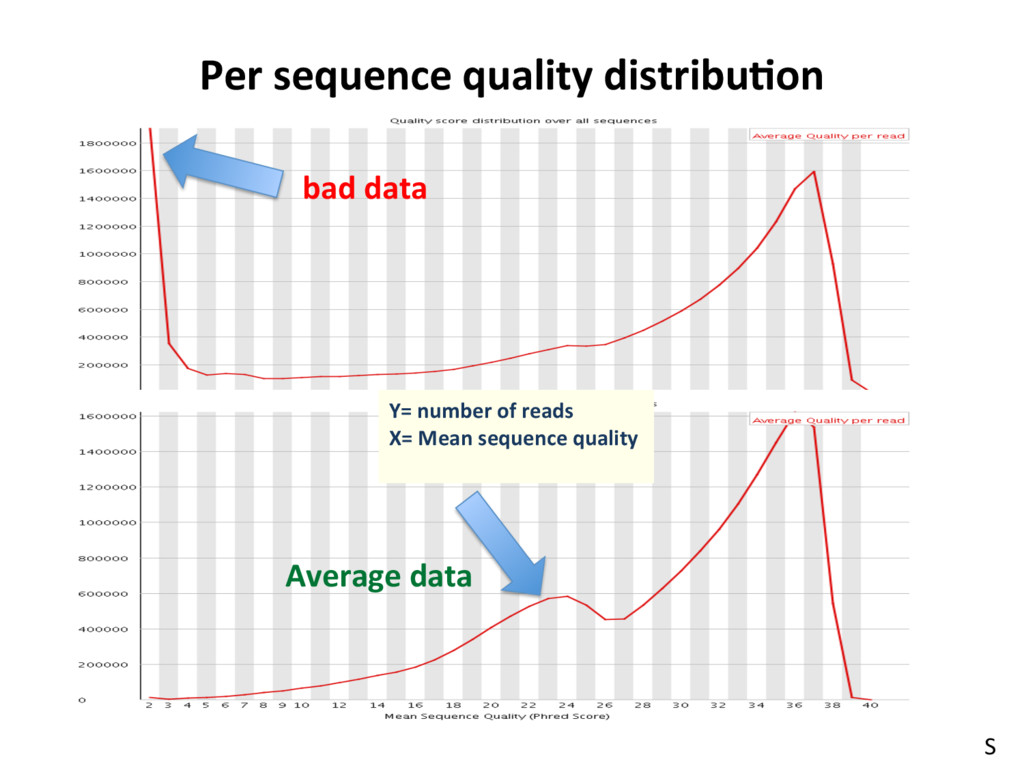
Good data § Consistent § High Quality Along the reads Bad data § High Variance § Quality Decrease with Length S RNA-seq Data: Zp://Zp.jax.org/dgau/MouseGen2016/ • B6-100K.fastq and Cast-100K.fastq
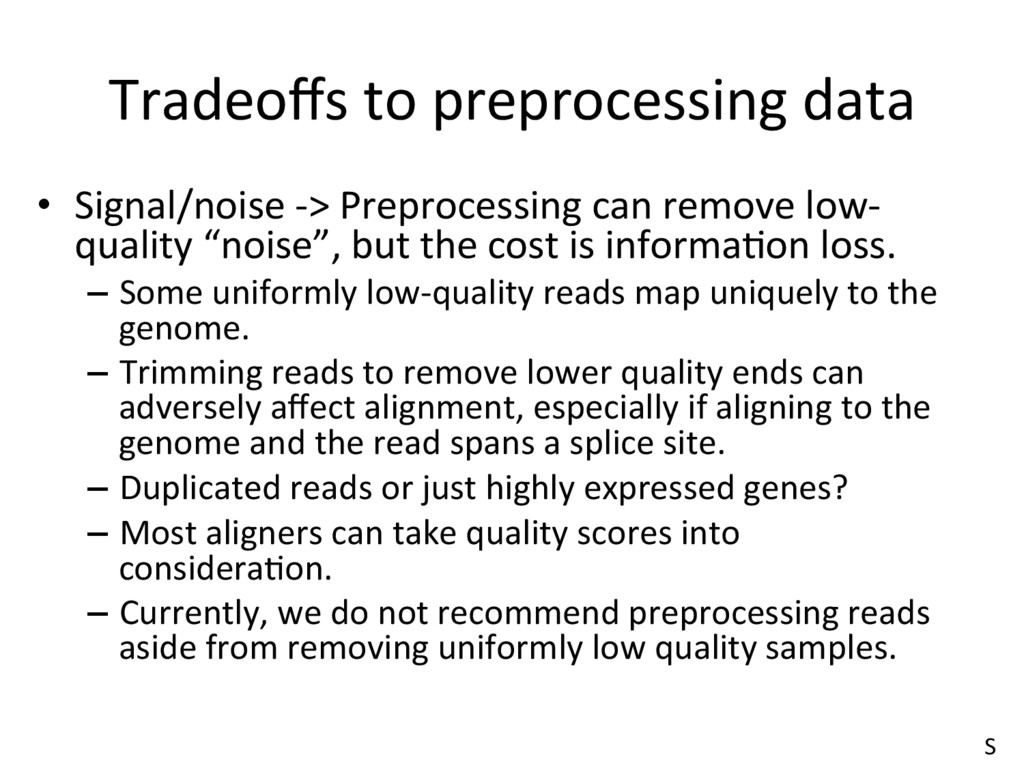
low- quality “noise”, but the cost is informaJon loss. – Some uniformly low-quality reads map uniquely to the genome. – Trimming reads to remove lower quality ends can adversely affect alignment, especially if aligning to the genome and the read spans a splice site. – Duplicated reads or just highly expressed genes? – Most aligners can take quality scores into consideraJon. – Currently, we do not recommend preprocessing reads aside from removing uniformly low quality samples. S
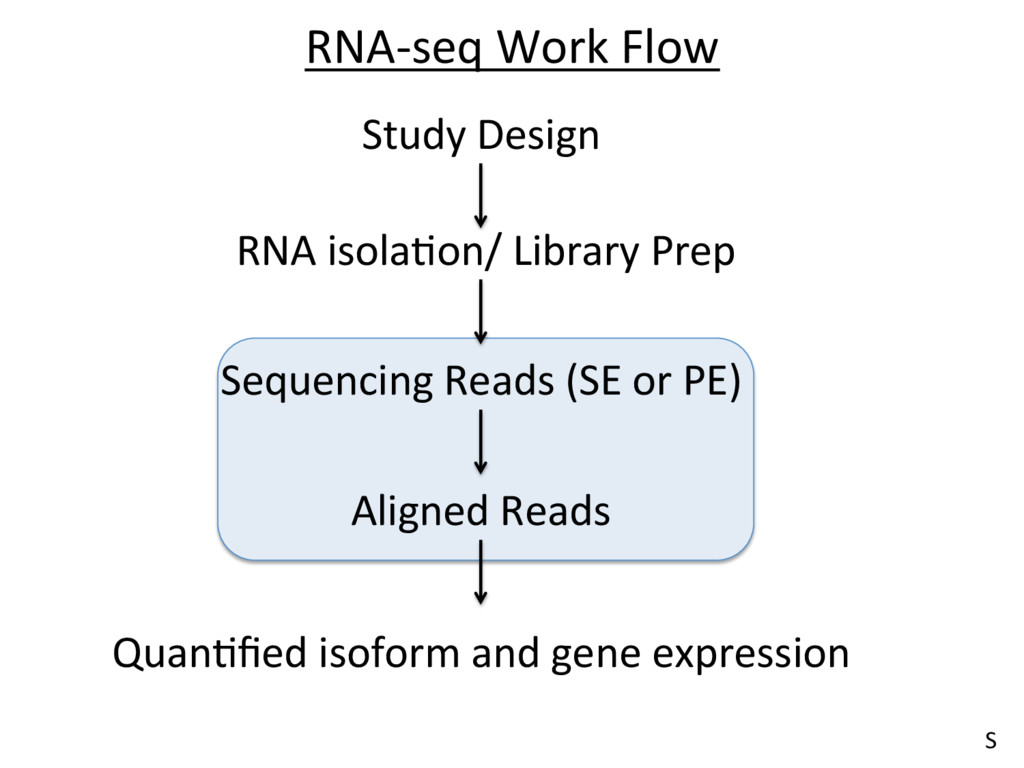
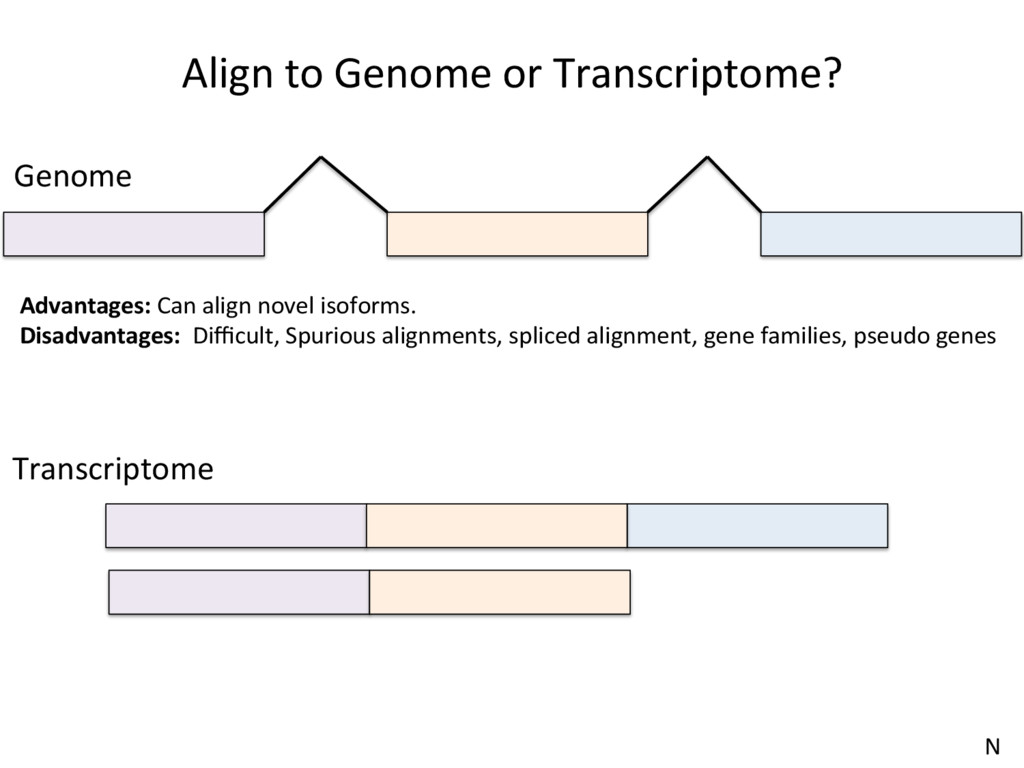
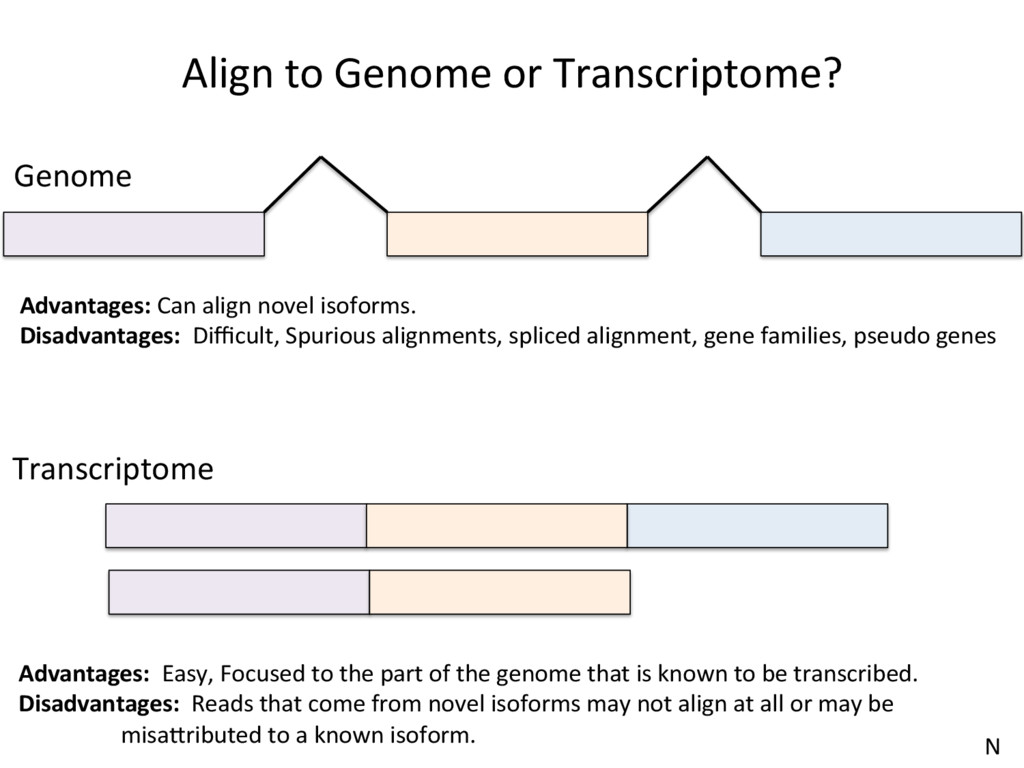
to the part of the genome that is known to be transcribed. Disadvantages: Reads that come from novel isoforms may not align at all or may be misadributed to a known isoform. Advantages: Can align novel isoforms. Disadvantages: Difficult, Spurious alignments, spliced alignment, gene families, pseudo genes N
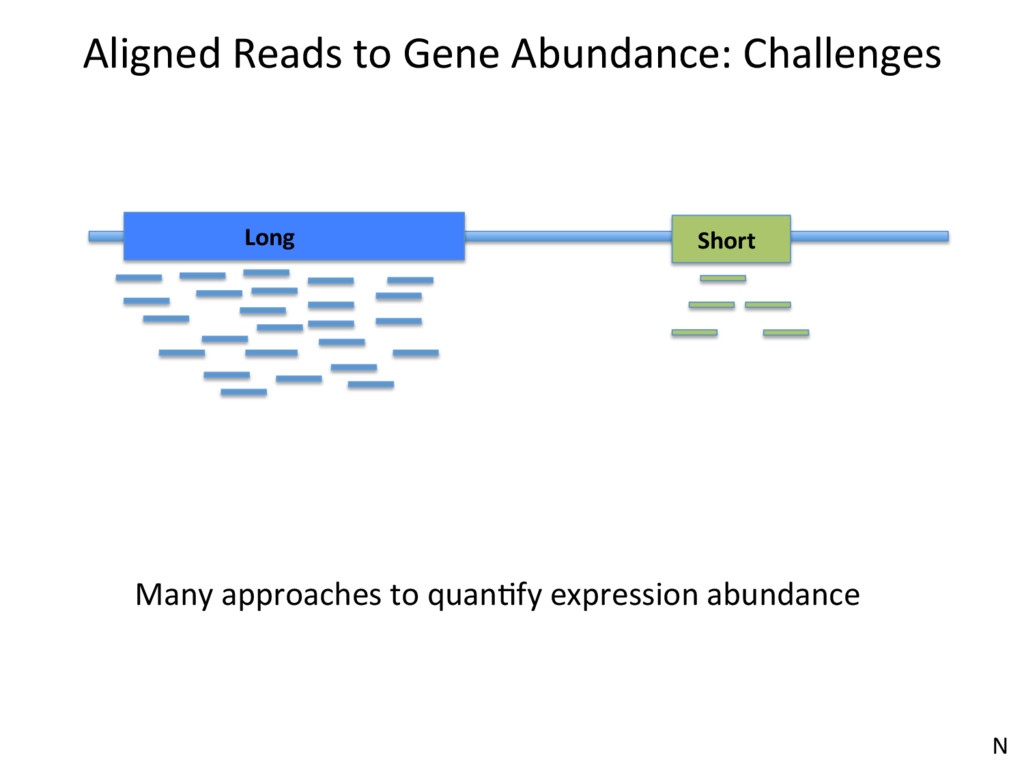
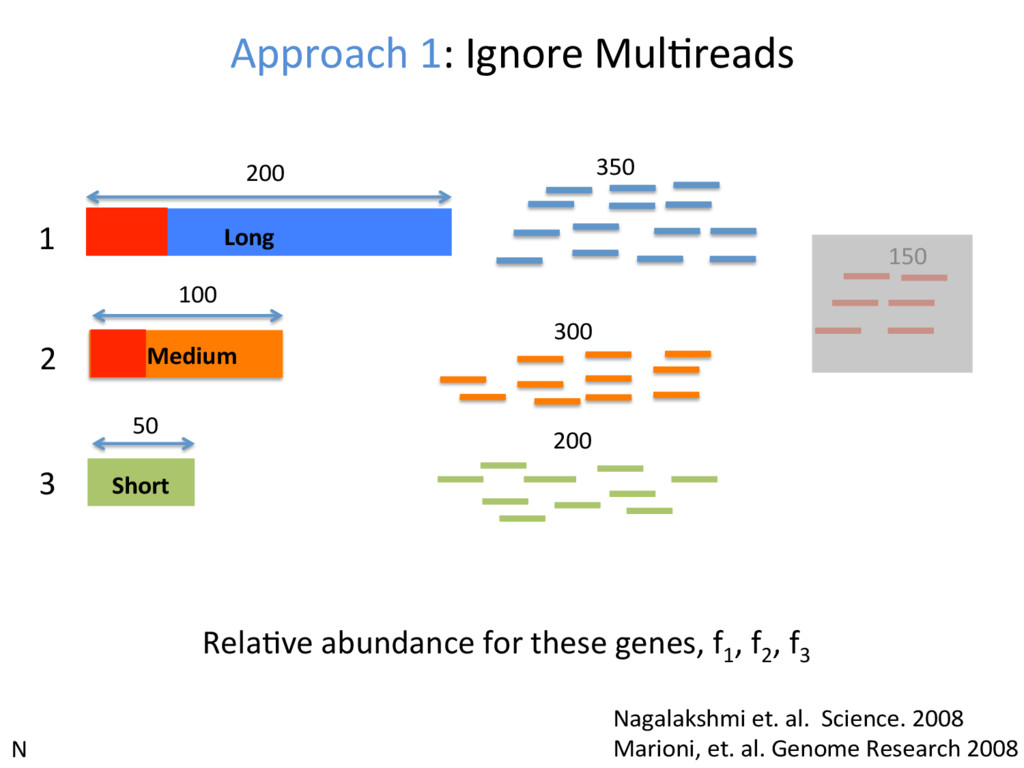
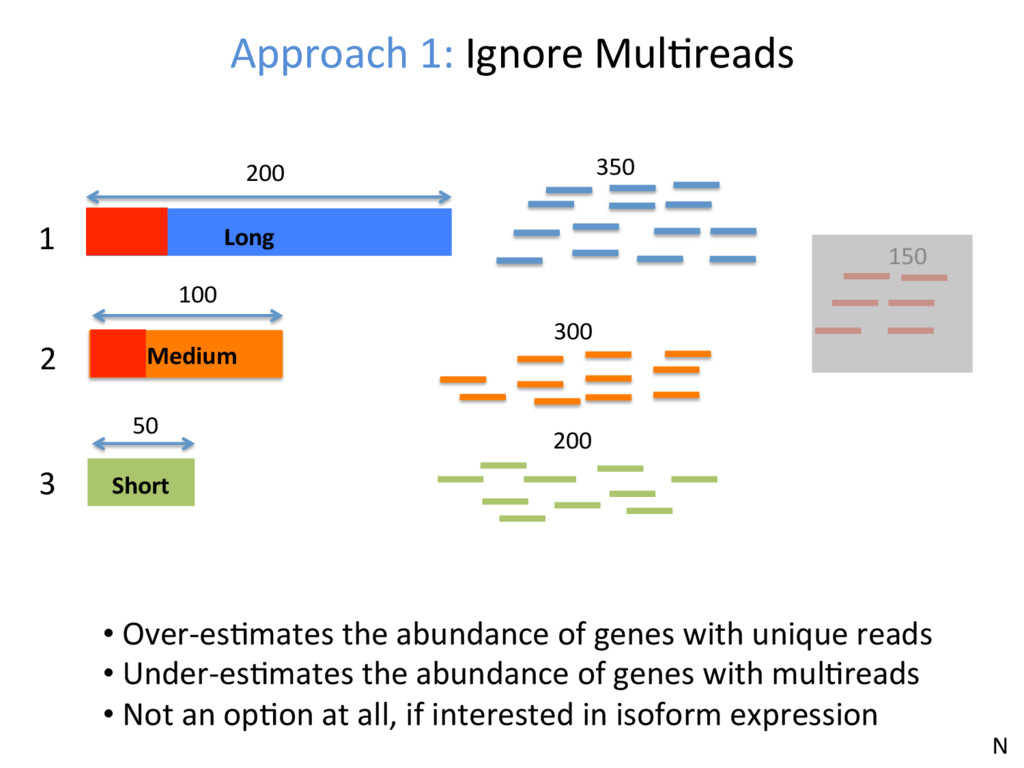
1 2 3 350 300 200 150 • Over-esJmates the abundance of genes with unique reads • Under-esJmates the abundance of genes with mulJreads • Not an opJon at all, if interested in isoform expression N
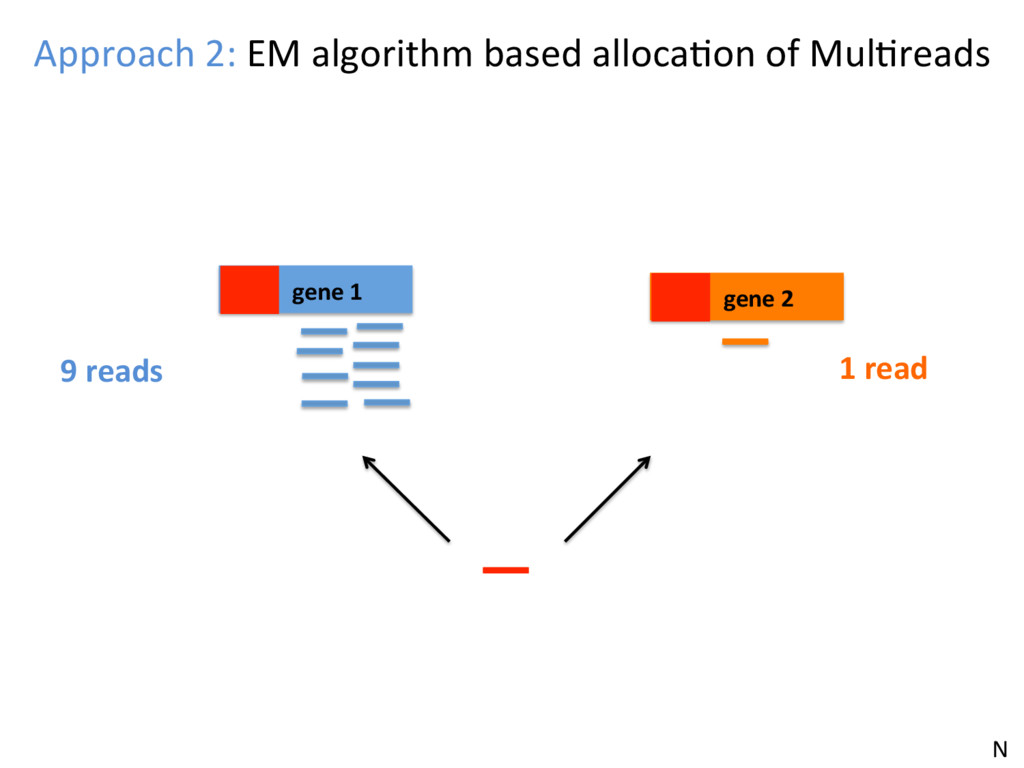
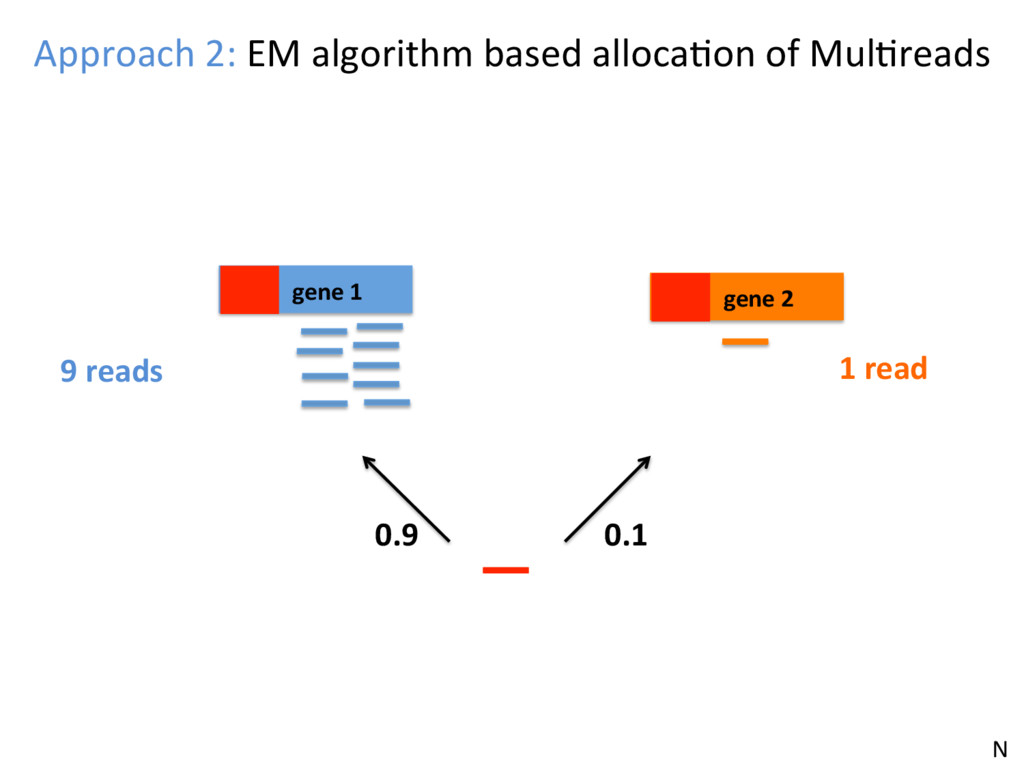
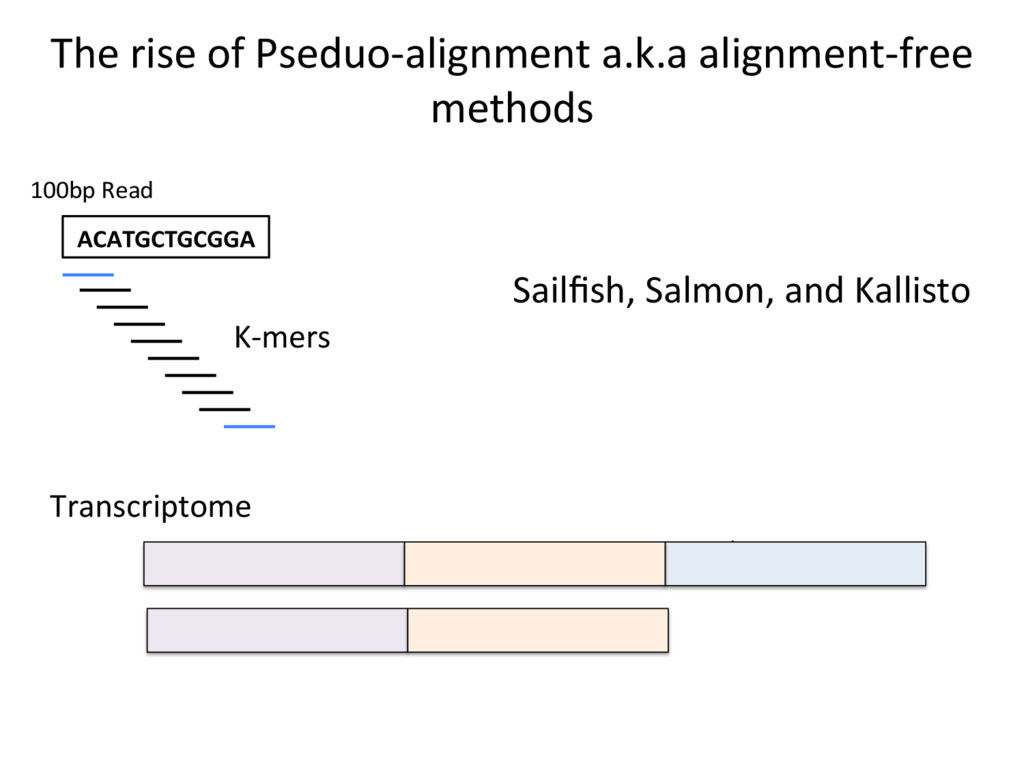
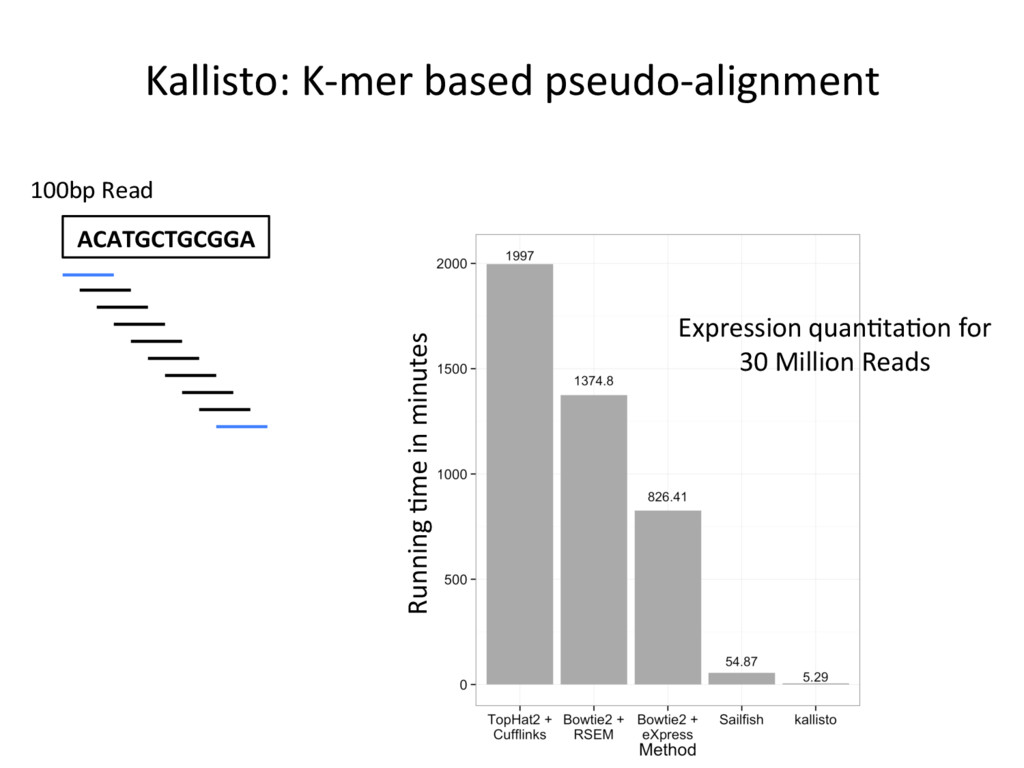
opJon. • Isoform-level esJmates are sJlll challenging and will become easier as read length increases. • K-mer counJng methods (Salmon, Kallisto) are very fast – they can be run easily on your own PC – and are reasonably accurate. N
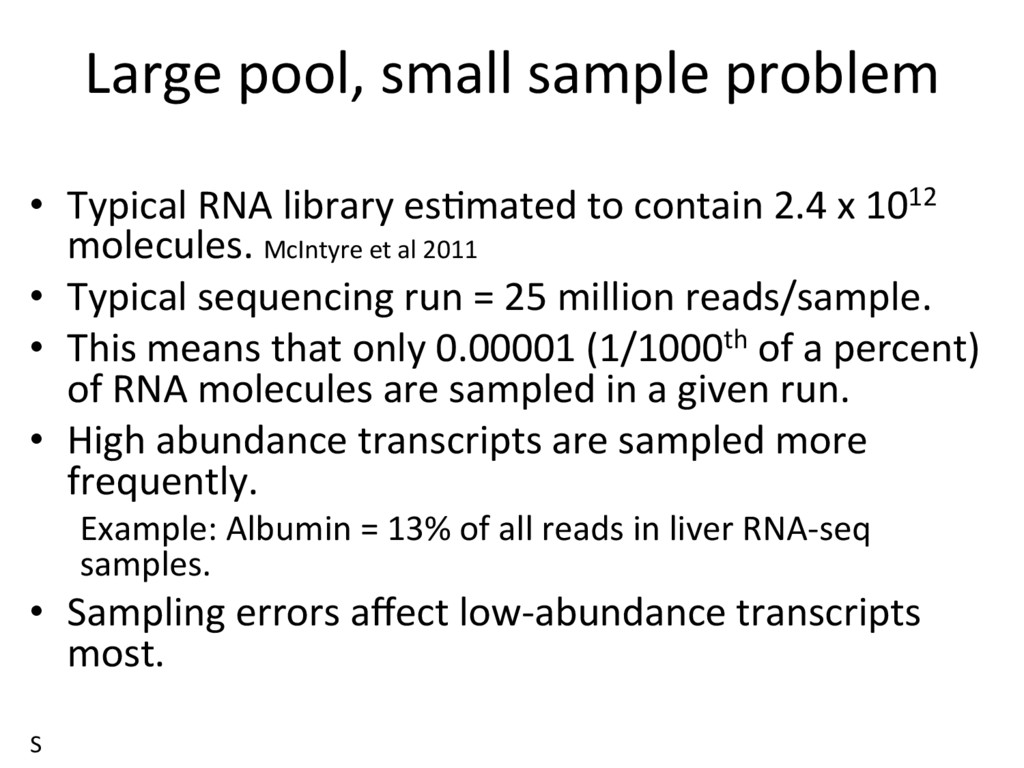
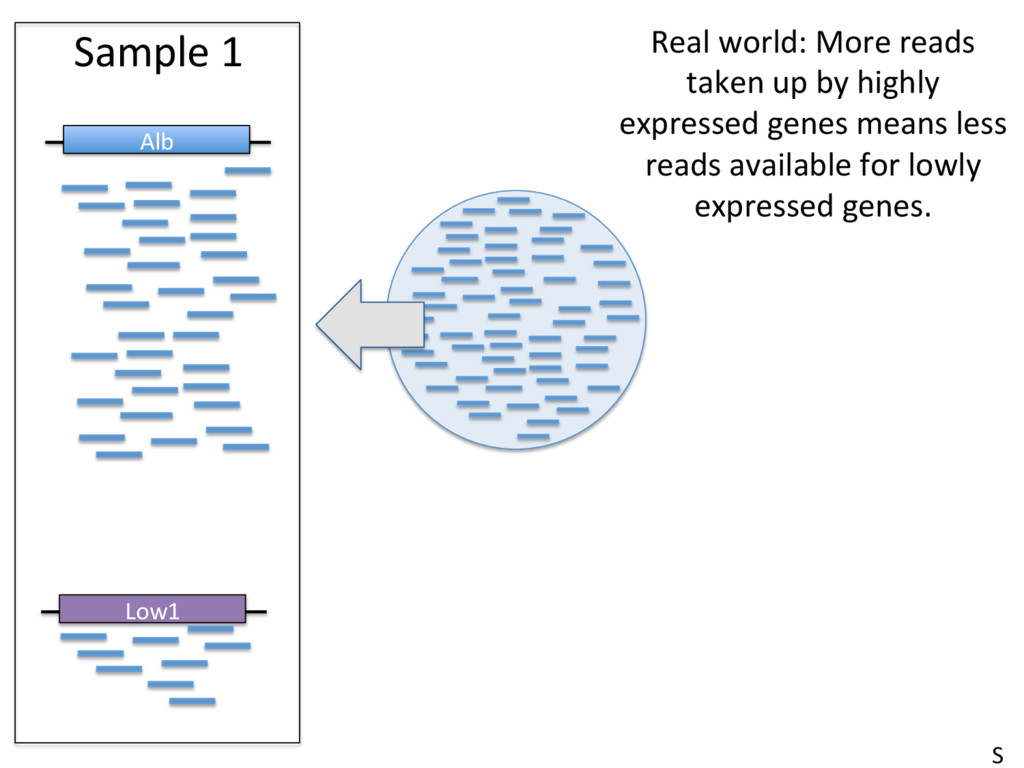
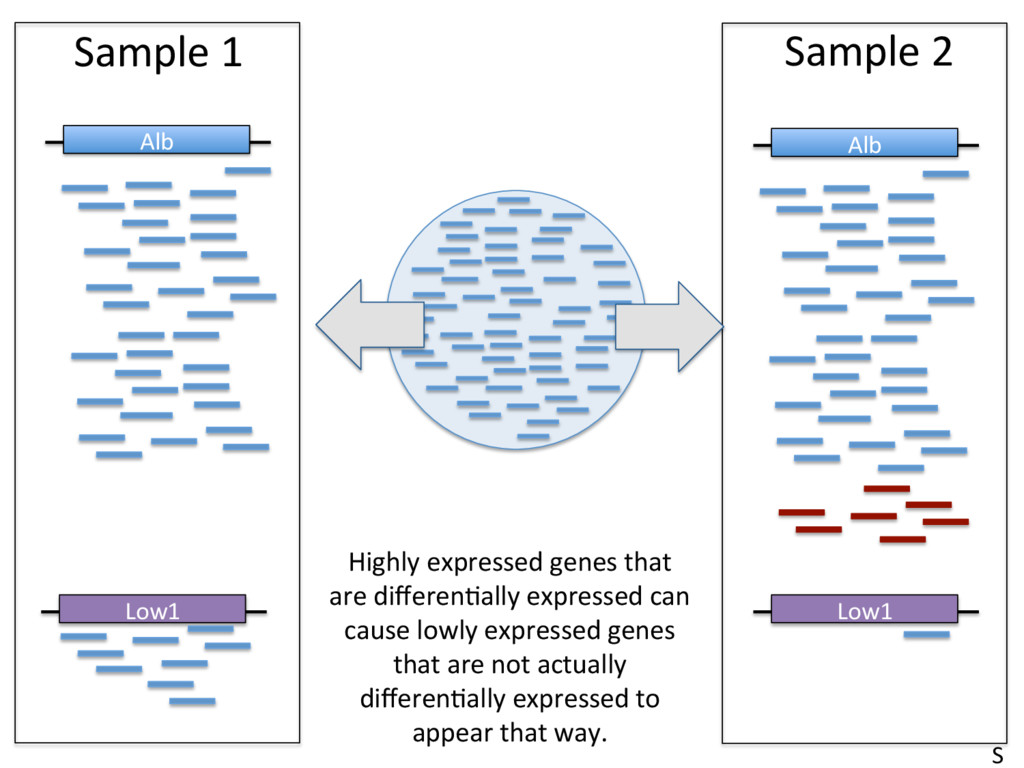
to contain 2.4 x 10¹² molecules. McIntyre et al 2011 • Typical sequencing run = 25 million reads/sample. • This means that only 0.00001 (1/1000th of a percent) of RNA molecules are sampled in a given run. • High abundance transcripts are sampled more frequently. Example: Albumin = 13% of all reads in liver RNA-seq samples. • Sampling errors affect low-abundance transcripts most. S
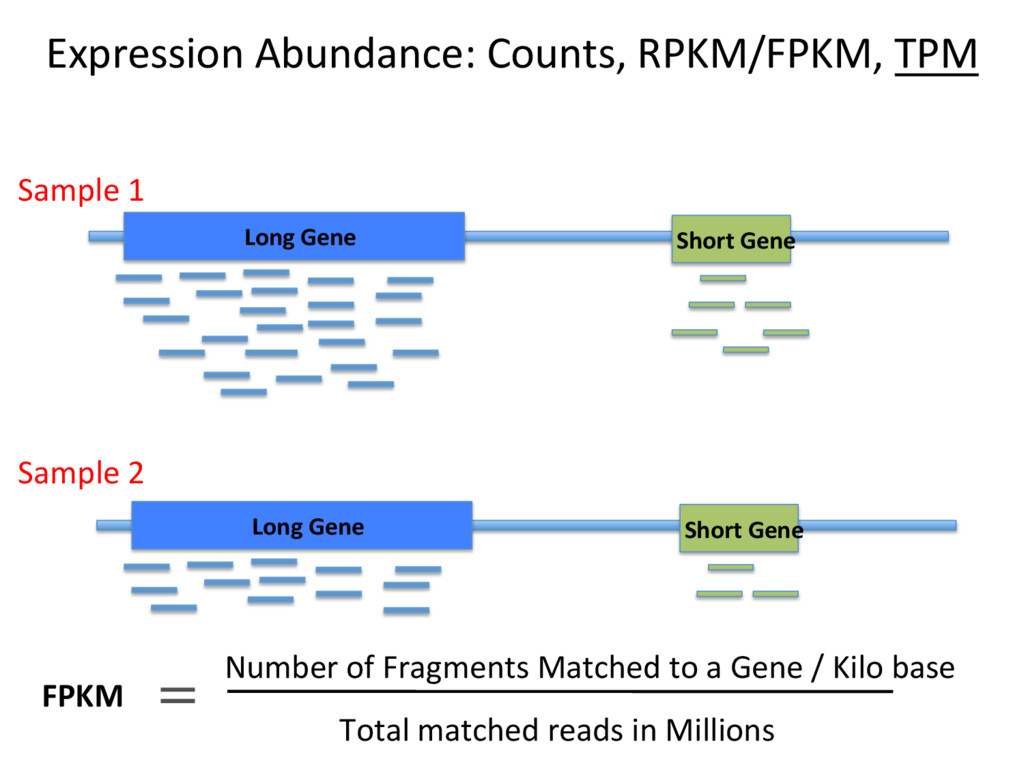
– Normalizing to the total number of mapped reads (e.g. FPKM). Top 10 highly expressed genes soak up 20% of reads in the liver. FPKM is widely used, and problemaJc. • Beder ways to measure data – Normalize to upper quarJle (75th %) of non-zero counts, median of scaled counts (DESeq), or the weighted trimmed mean of the log expression raJos (EdgeR). S
well annotated genes? – Smaller sample depth; more biological replicates – No need for paired end reads; shorter reads (50bp) may be sufficient. – Beder to have 20 million 50bp reads than 10 million 100bp reads. • Looking for novel genes/splicing/isoforms? – More read depth, paired-end reads from longer fragments. N
Karen Svenson/ Elissa Chesler • Joel Graber • Doug Hinerfeld • Anuj Srivastava • Churchill Lab – Dan Gau • Al Simons and Mad Hibbs • Lisa Somes, Steve Ciciode, mouse room staff at JAX • Gene Expression Technologies group at JAX
![Any other applicaJons you are interested in? Steve Munger [email protected]](https://files.speakerdeck.com/presentations/76cc9eeacc07424388b5f012de5a346b/slide_69.jpg)