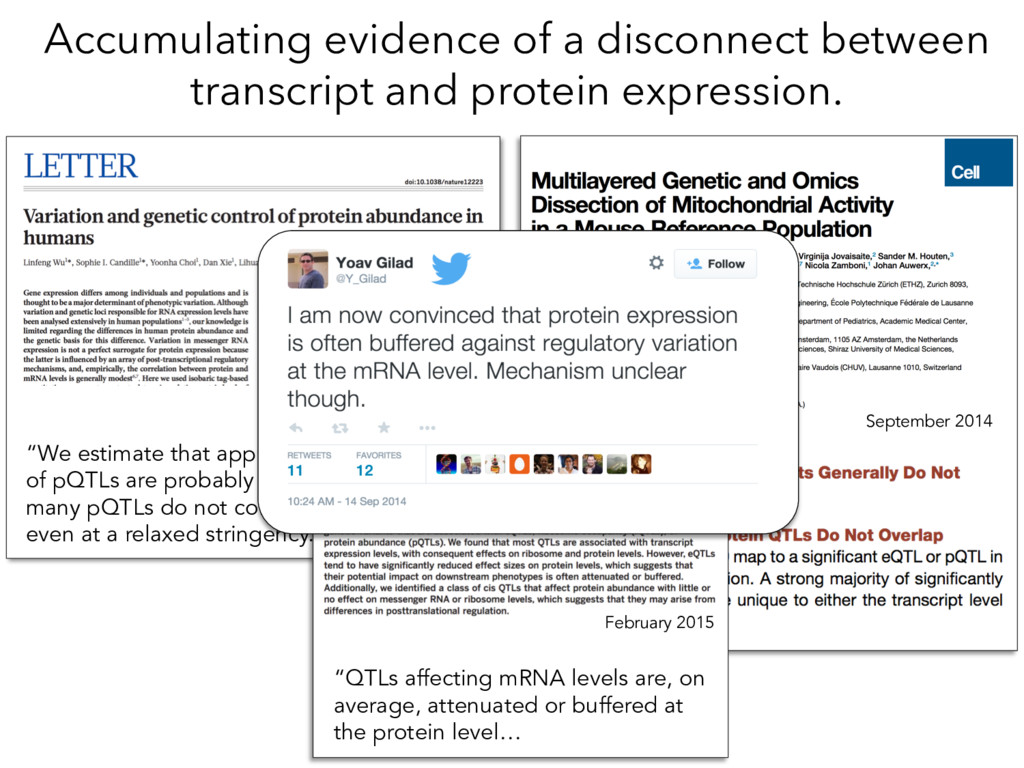
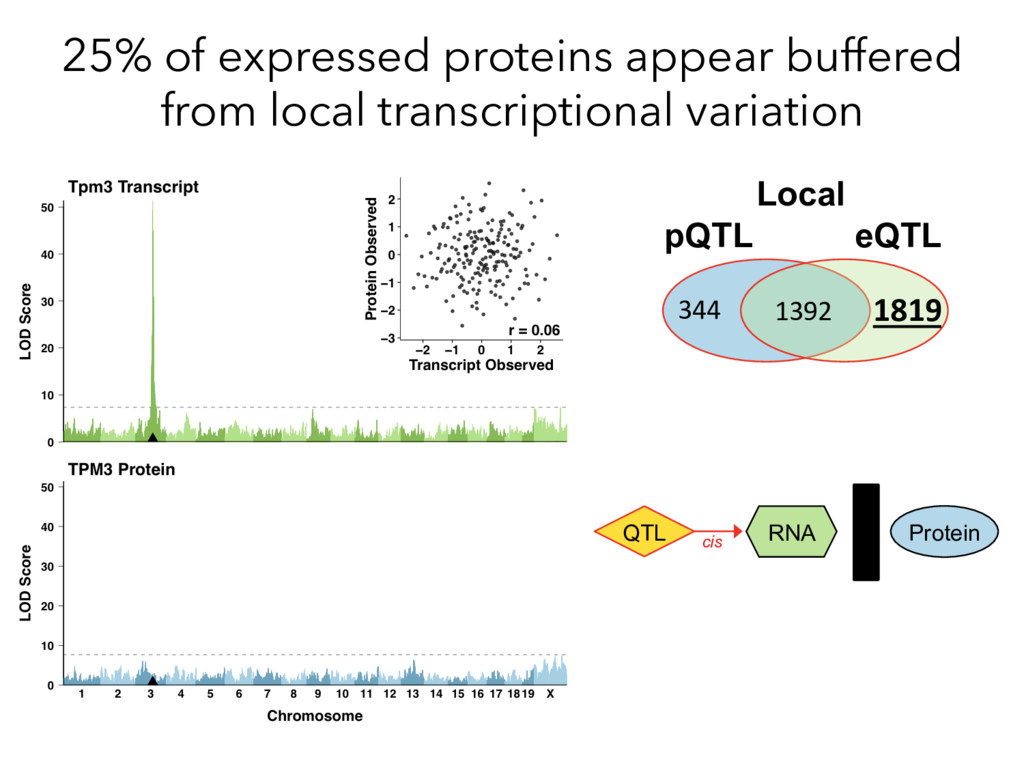
are probably also eQTLs. However, many pQTLs do not correspond to eQTLs, even at a relaxed stringency.” Accumulating evidence of a disconnect between transcript and protein expression. September 2014 February 2015 “QTLs affecting mRNA levels are, on average, attenuated or buffered at the protein level…
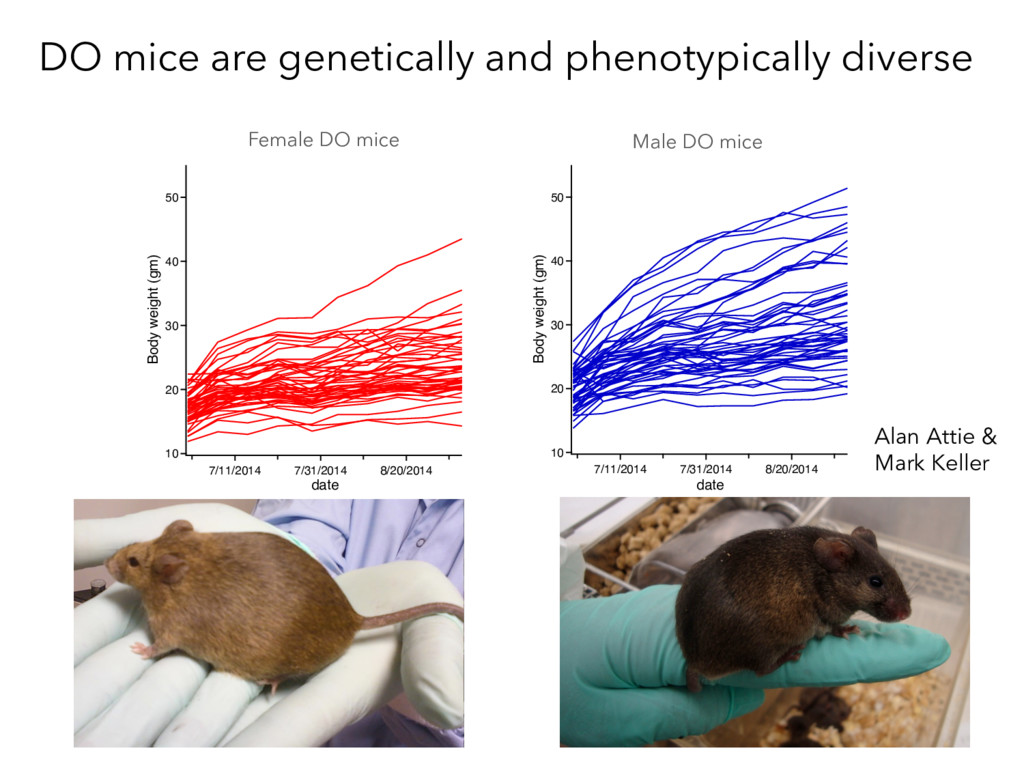
8/20/2014 date 50 40 30 20 10 Body weight (gm) 7/11/2014 7/31/2014 8/20/2014 date female DO mice male DO mice DO mice are genetically and phenotypically diverse Alan Attie & Mark Keller Female DO mice Male DO mice
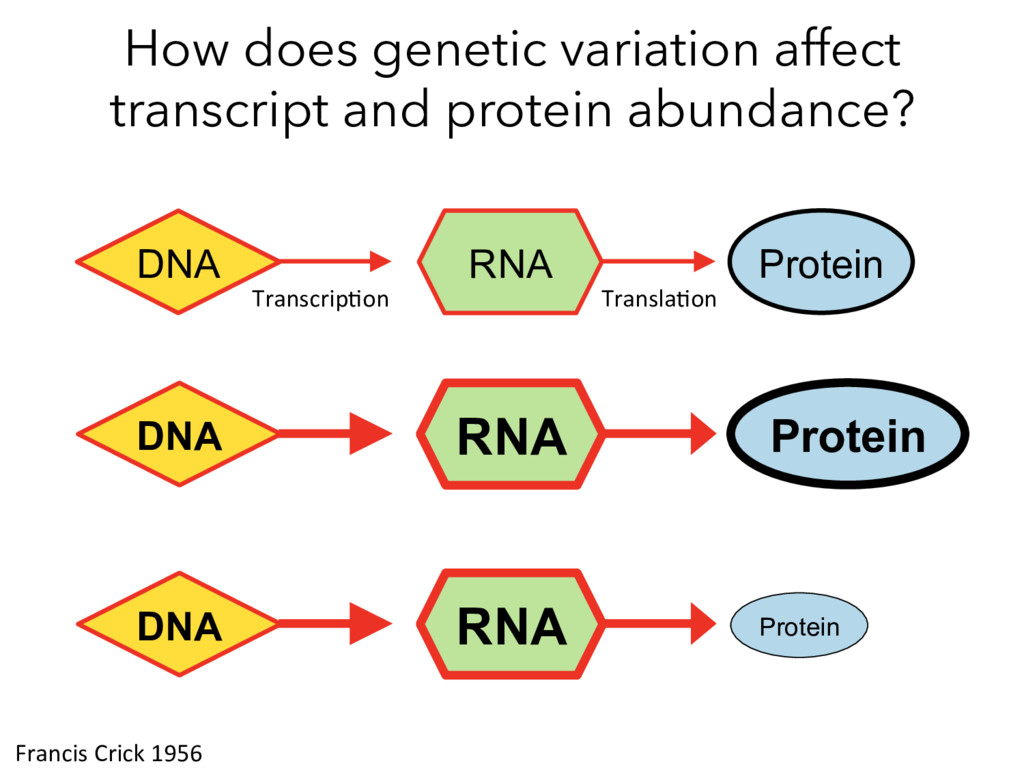
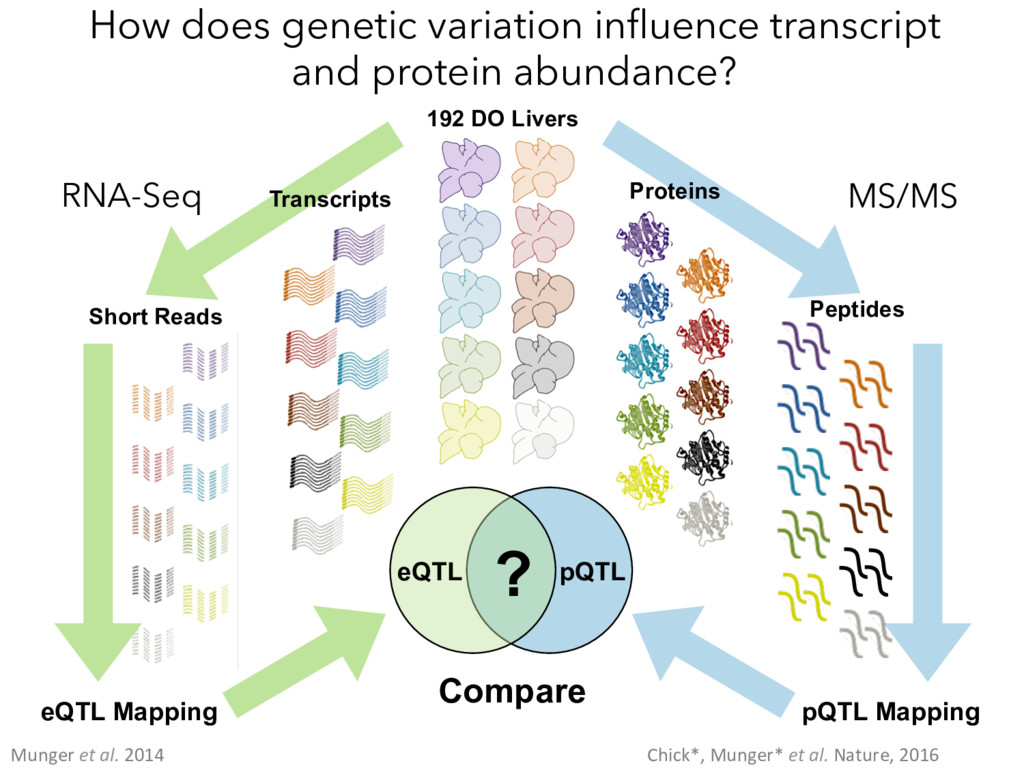
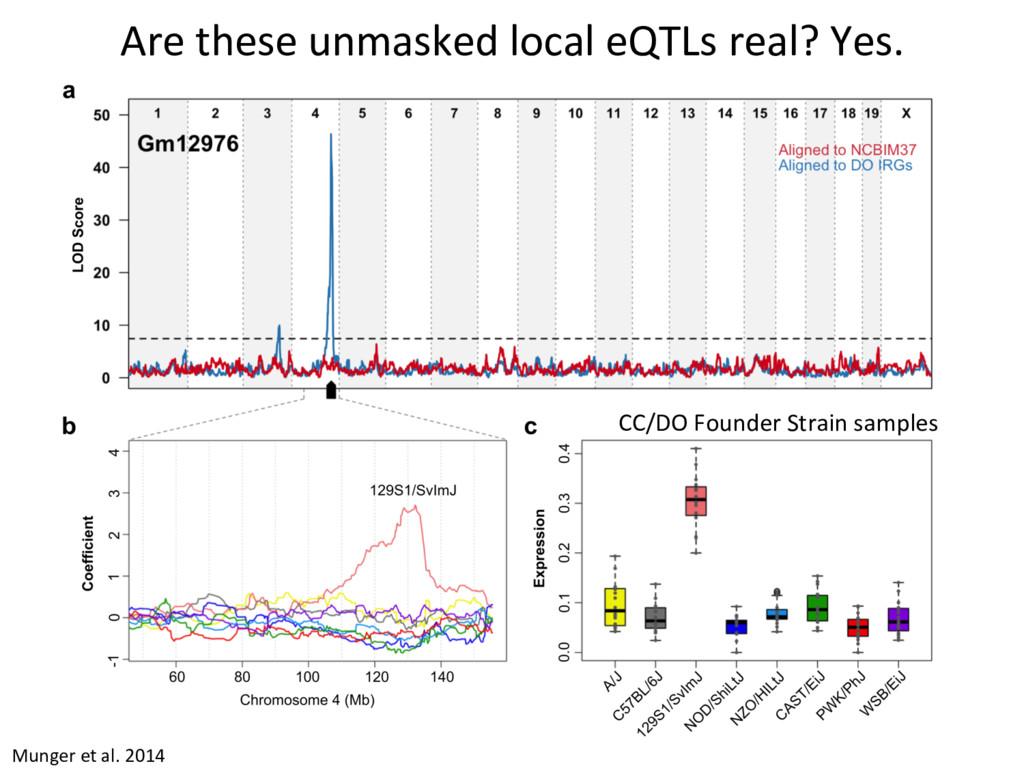
Mapping pQTL Mapping Proteins Peptides MS/MS Compare ? Munger et al. 2014 Chick*, Munger* et al. Nature, 2016 How does genetic variation influence transcript and protein abundance?
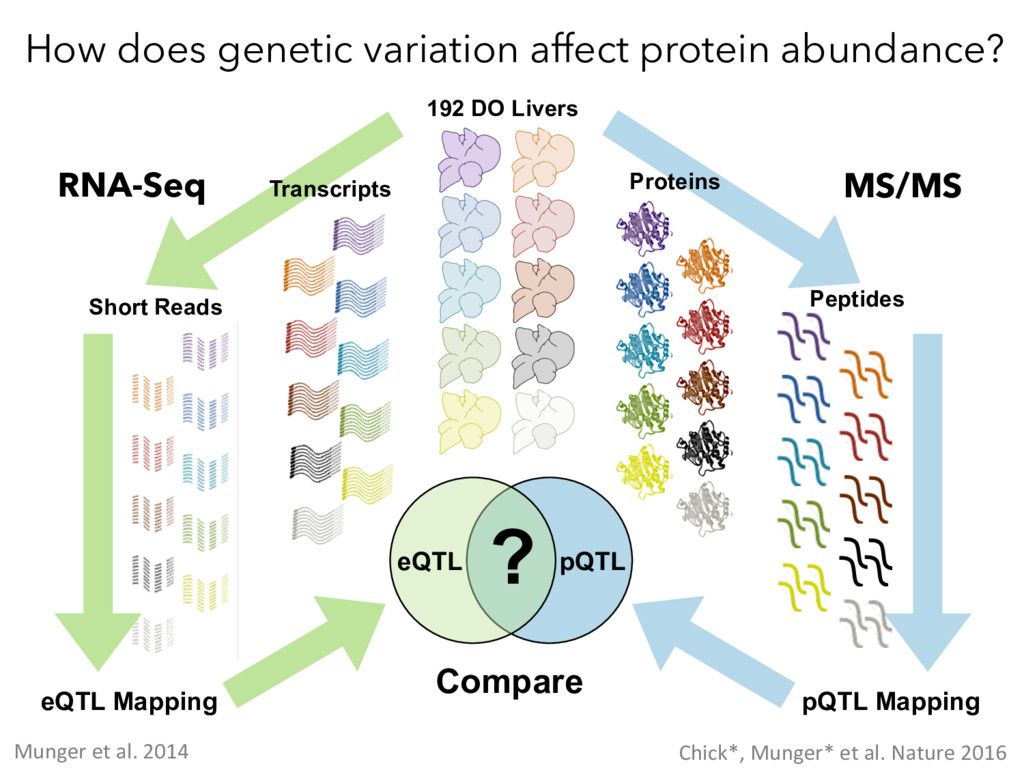
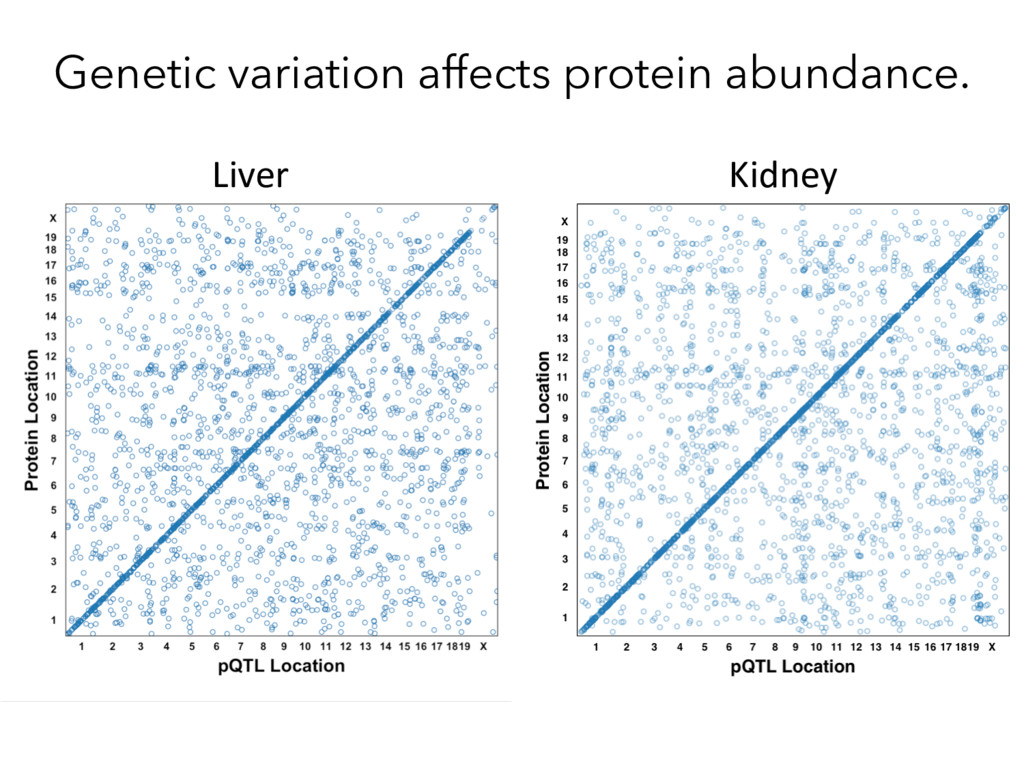
Mapping pQTL Mapping Proteins Peptides MS/MS Compare ? Munger et al. 2014 Chick*, Munger* et al. Nature 2016 How does genetic variation affect protein abundance?
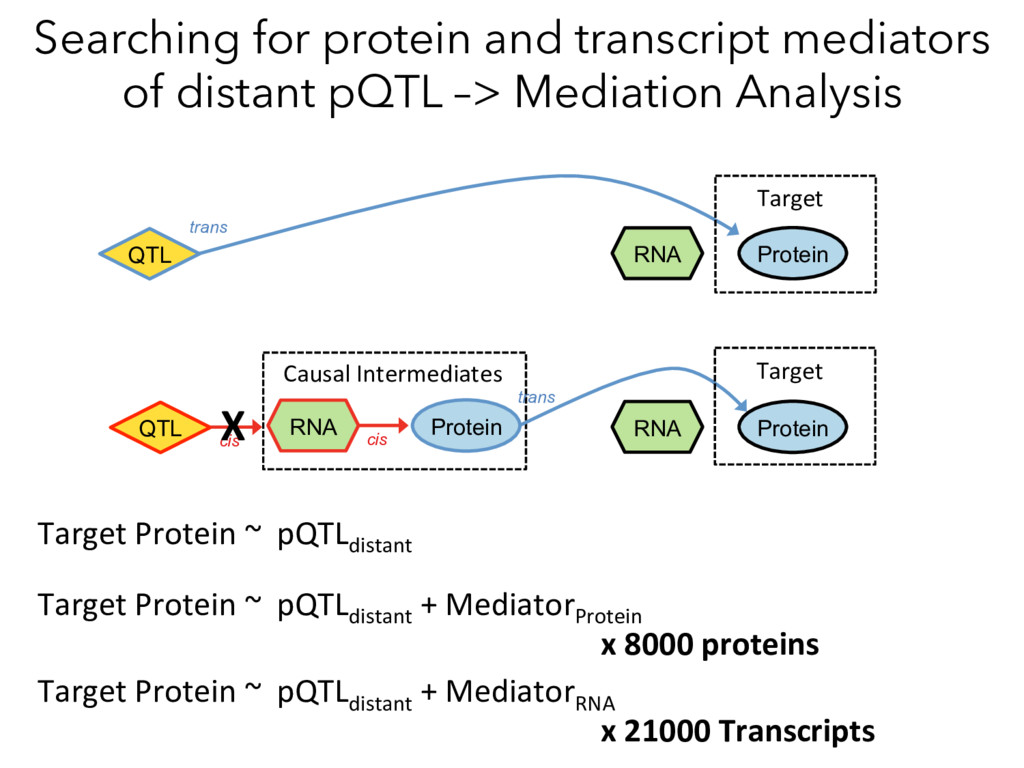
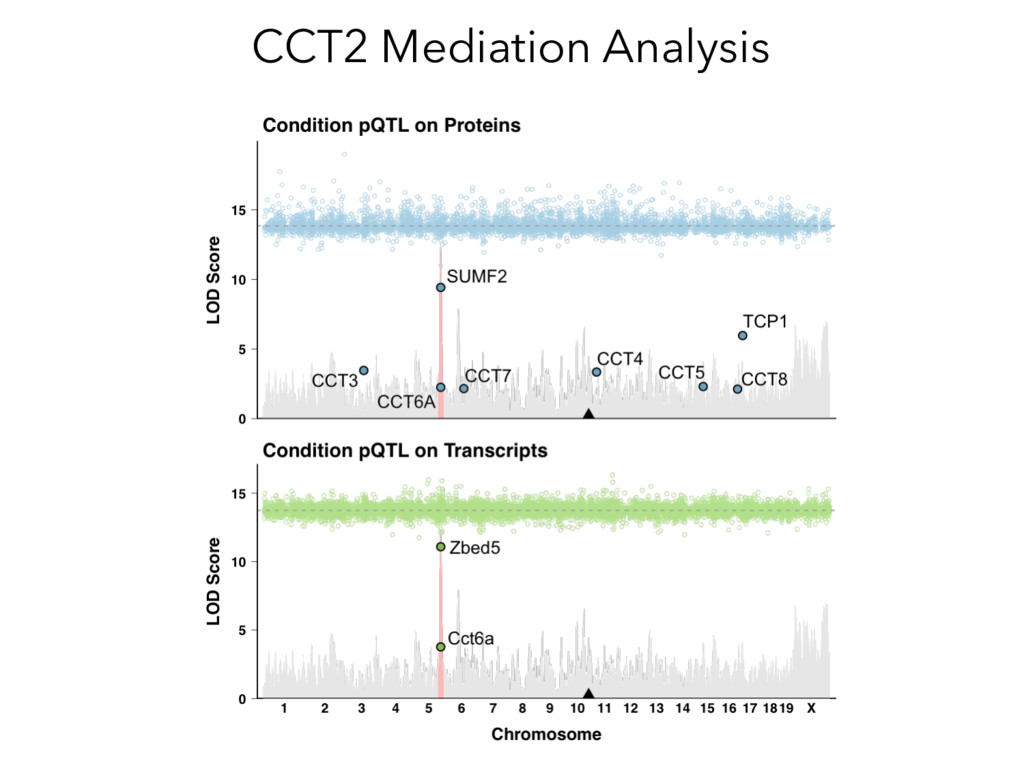
Mediation Analysis RNA Protein QTL trans cis RNA Protein Target Causal Intermediates RNA Protein trans QTL cis Target Target Protein ~ pQTLdistant Target Protein ~ pQTLdistant + MediatorProtein x 8000 proteins Target Protein ~ pQTLdistant + MediatorRNA x 21000 Transcripts X
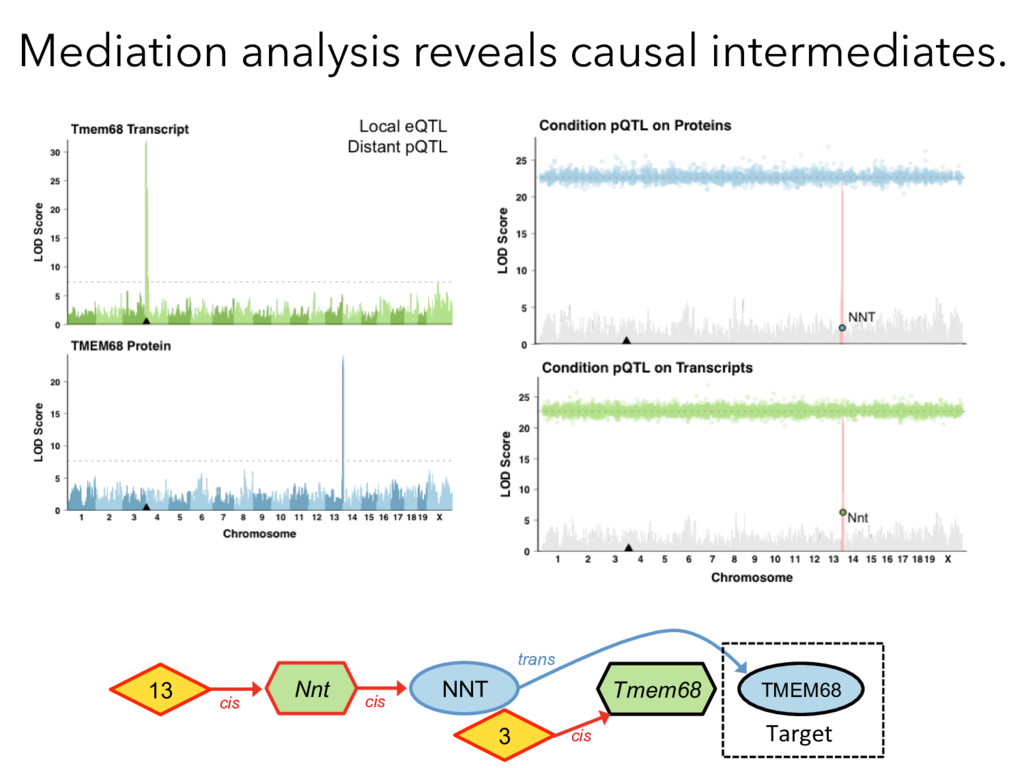
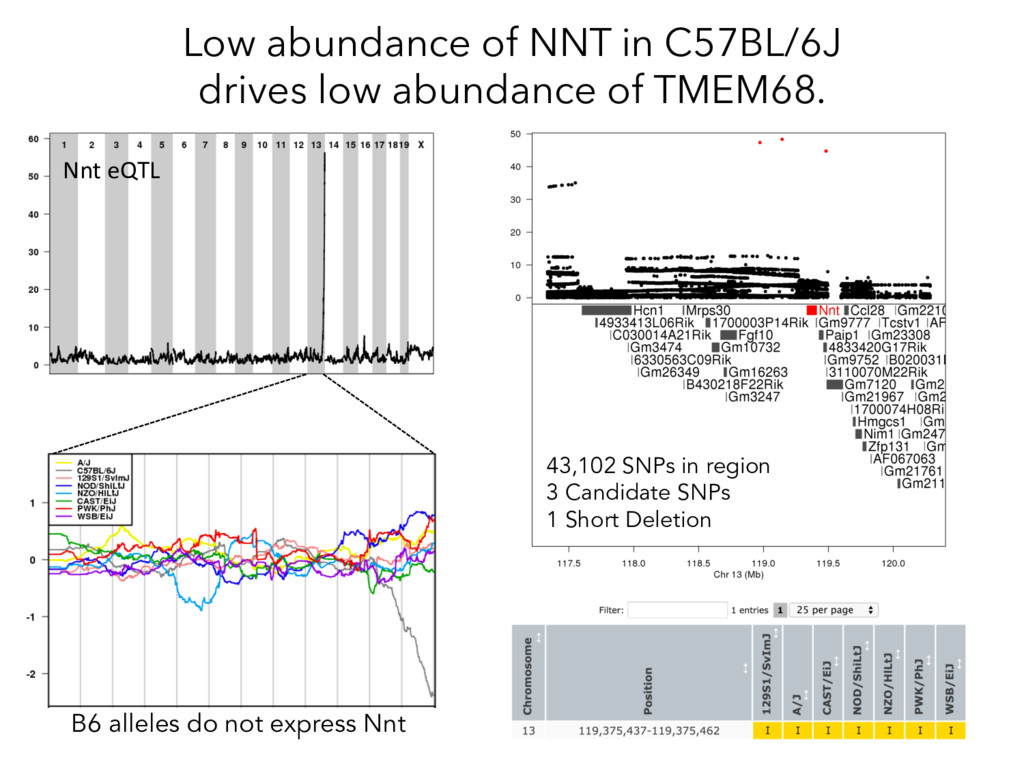
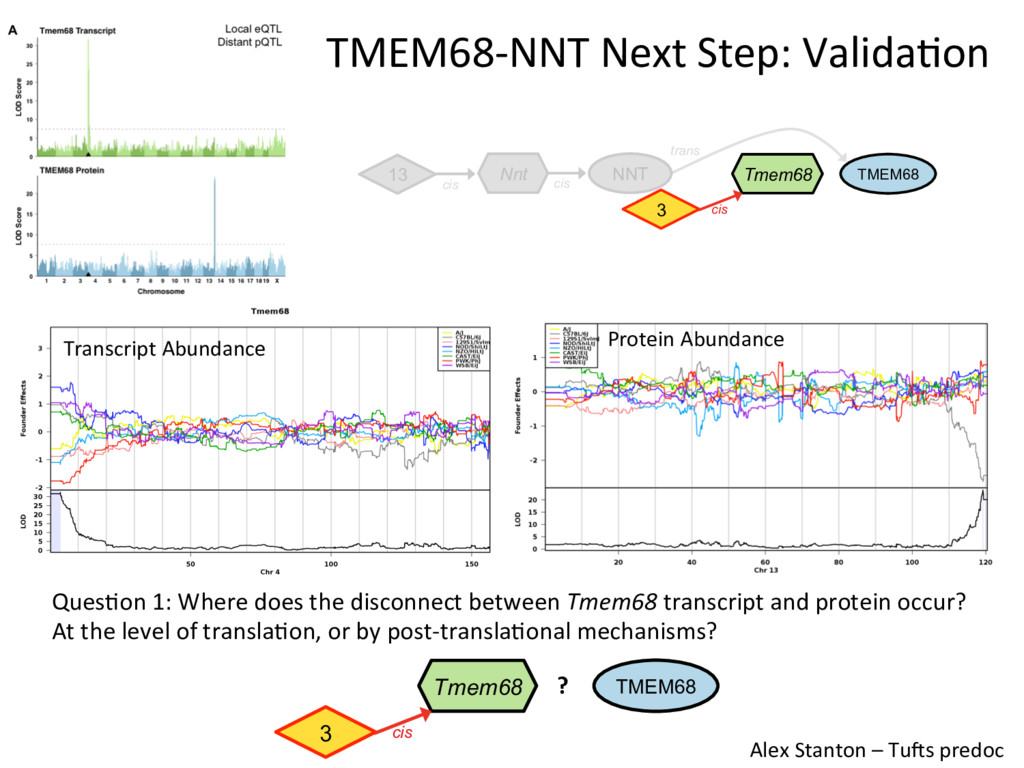
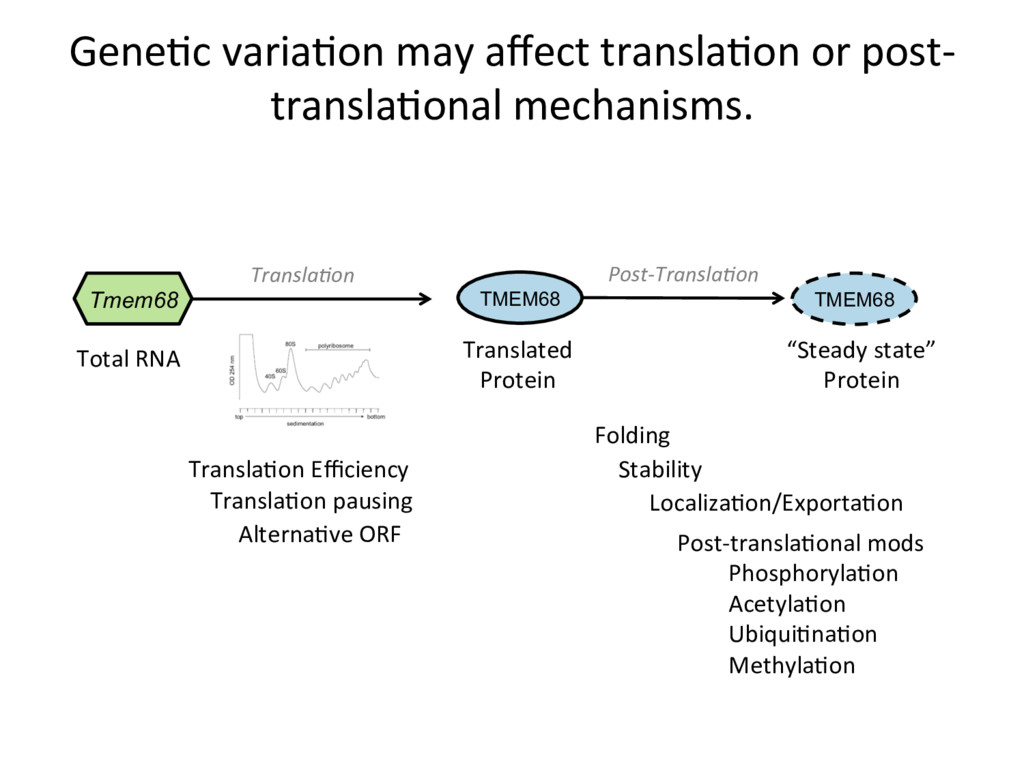
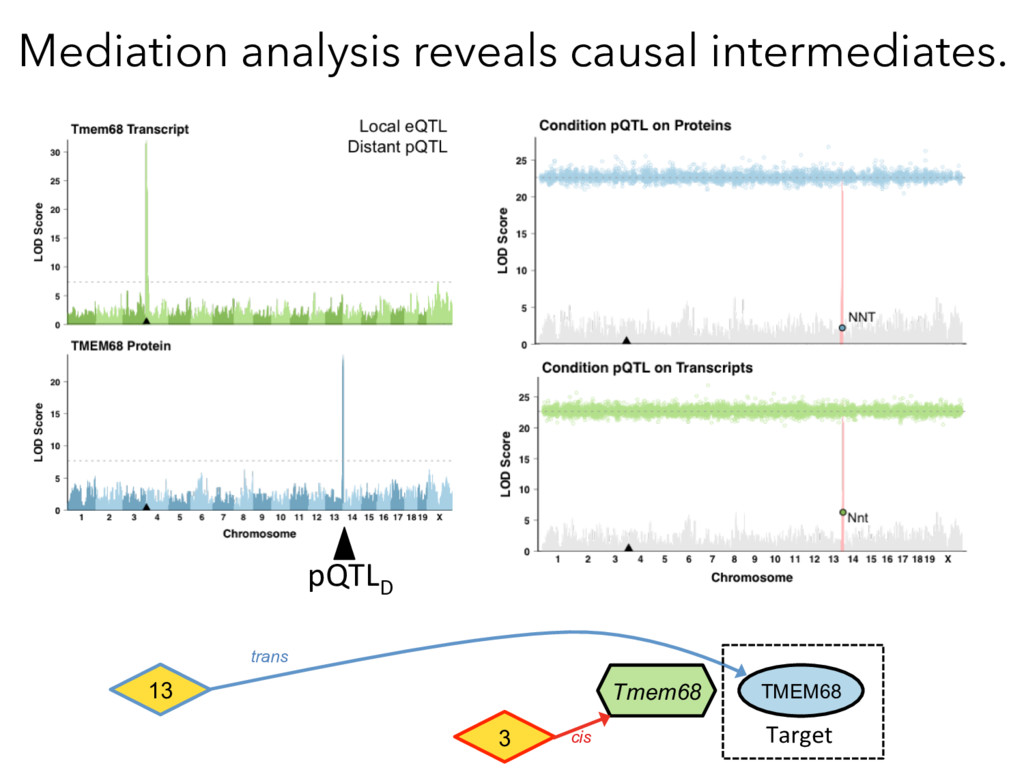
trans 13 cis 3 cis cis Nnt NNT Alex Stanton – Tums predoc Tmem68 TMEM68 3 cis Ques)on 1: Where does the disconnect between Tmem68 transcript and protein occur? At the level of transla)on, or by post-transla)onal mechanisms? ?
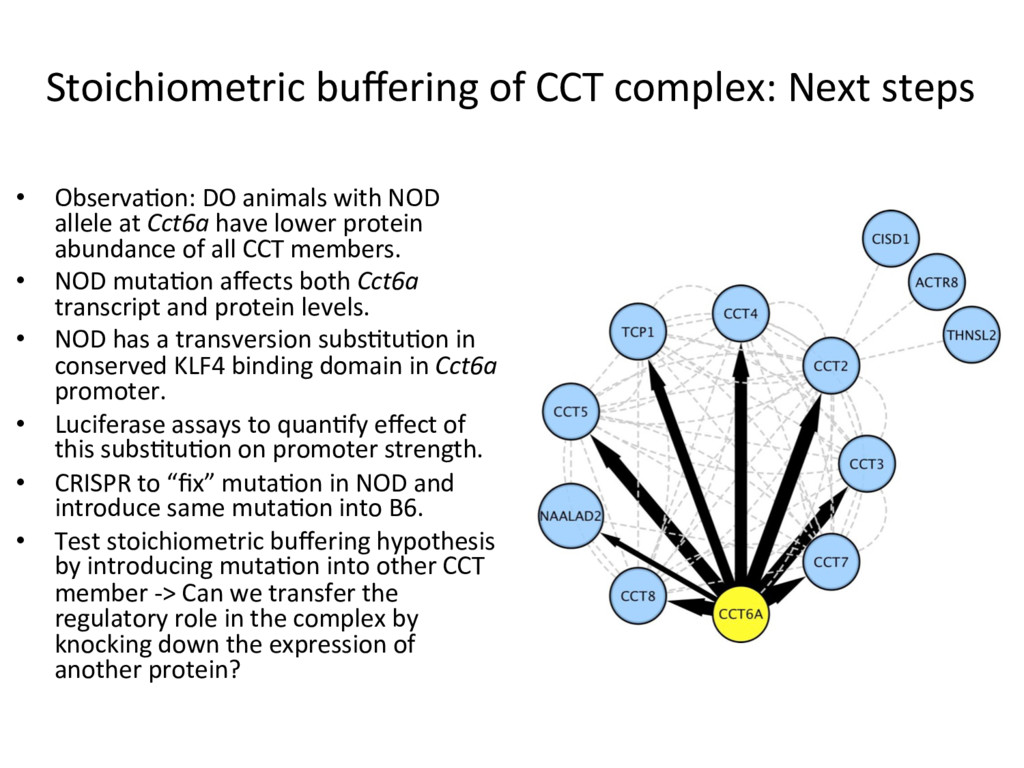
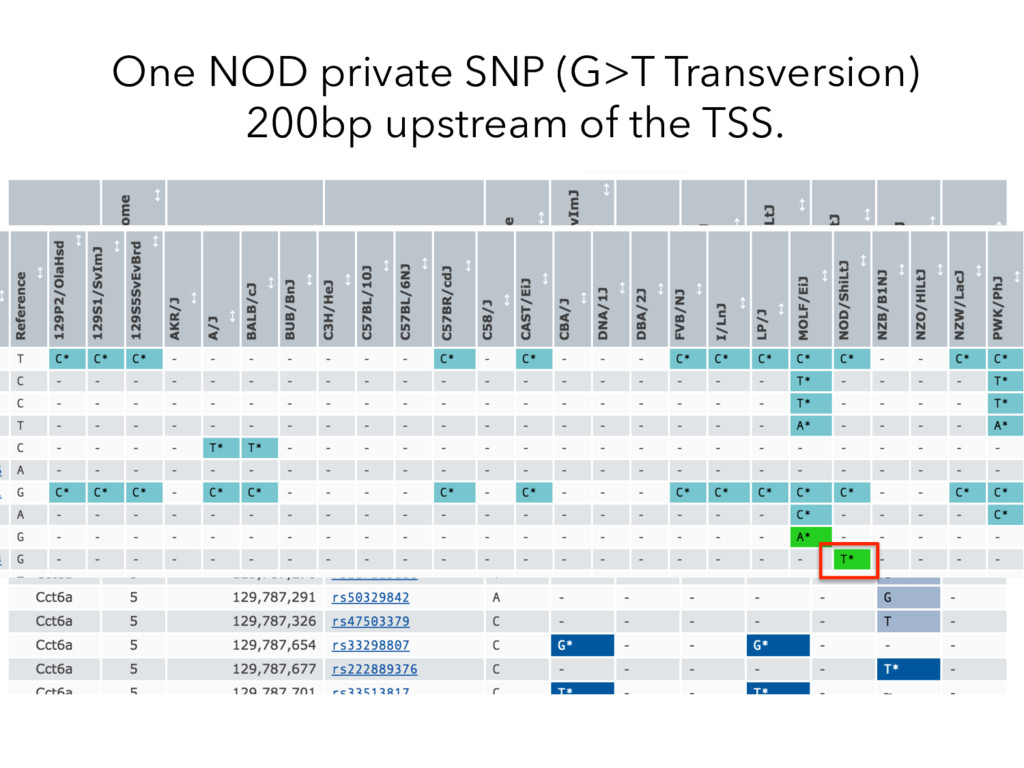
animals with NOD allele at Cct6a have lower protein abundance of all CCT members. • NOD muta)on affects both Cct6a transcript and protein levels. • NOD has a transversion subs)tu)on in conserved KLF4 binding domain in Cct6a promoter. • Luciferase assays to quan)fy effect of this subs)tu)on on promoter strength. • CRISPR to “fix” muta)on in NOD and introduce same muta)on into B6. • Test stoichiometric buffering hypothesis by introducing muta)on into other CCT member -> Can we transfer the regulatory role in the complex by knocking down the expression of another protein?
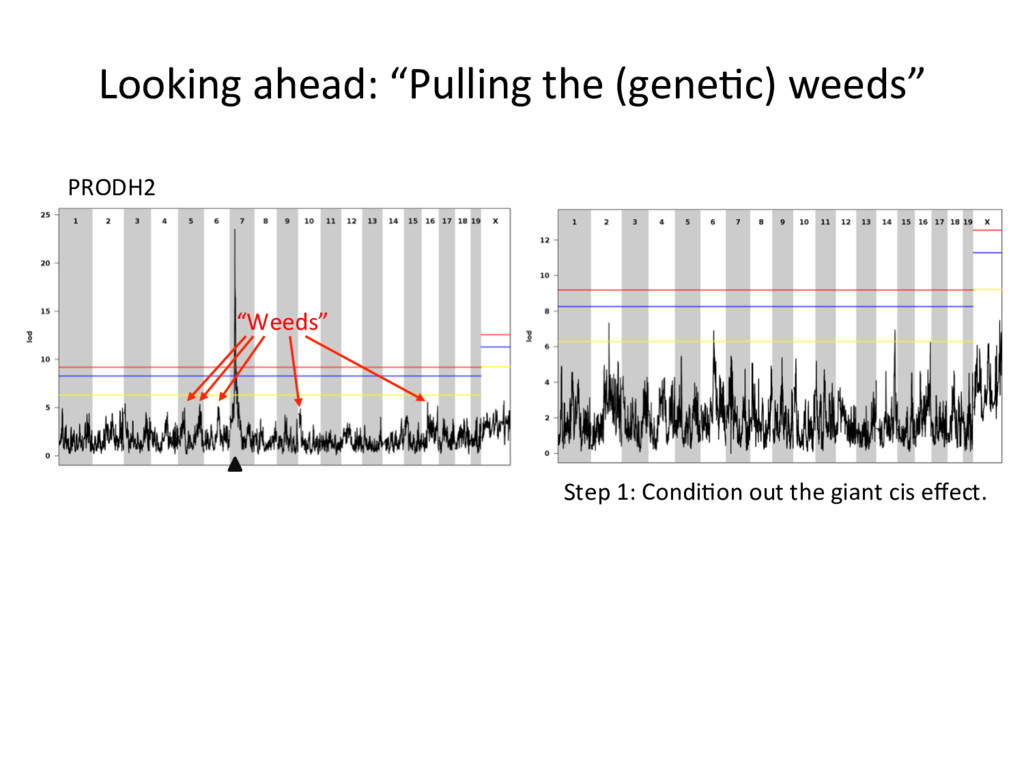
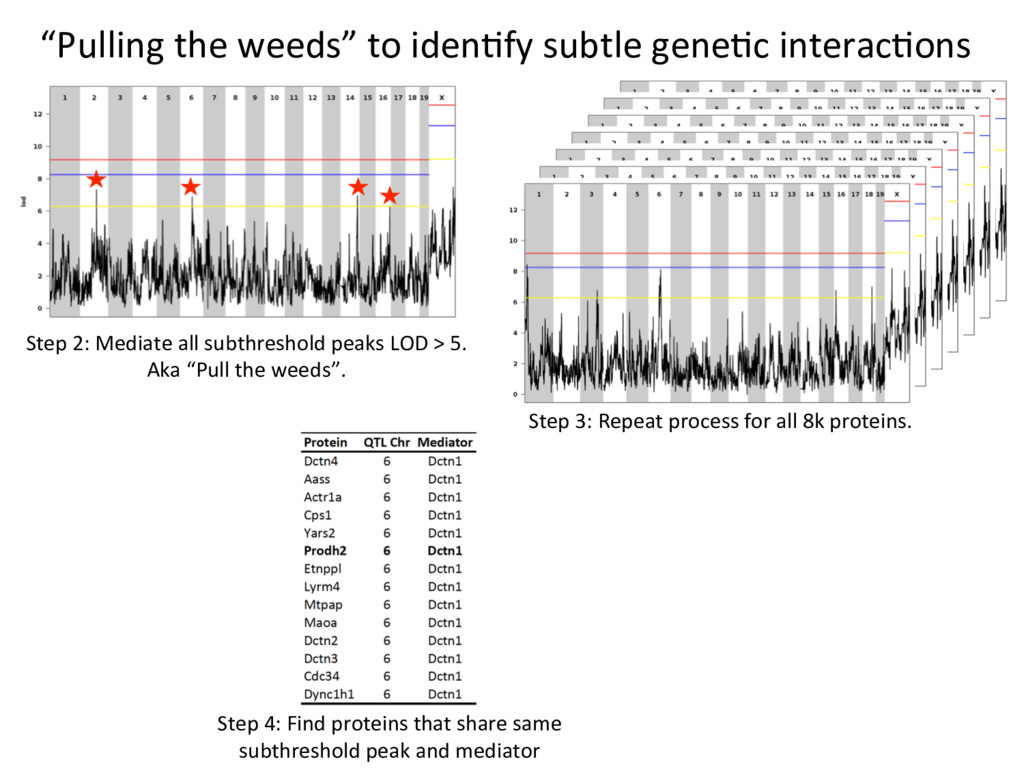
Mediate all subthreshold peaks LOD > 5. Aka “Pull the weeds”. Step 3: Repeat process for all 8k proteins. Step 4: Find proteins that share same subthreshold peak and mediator
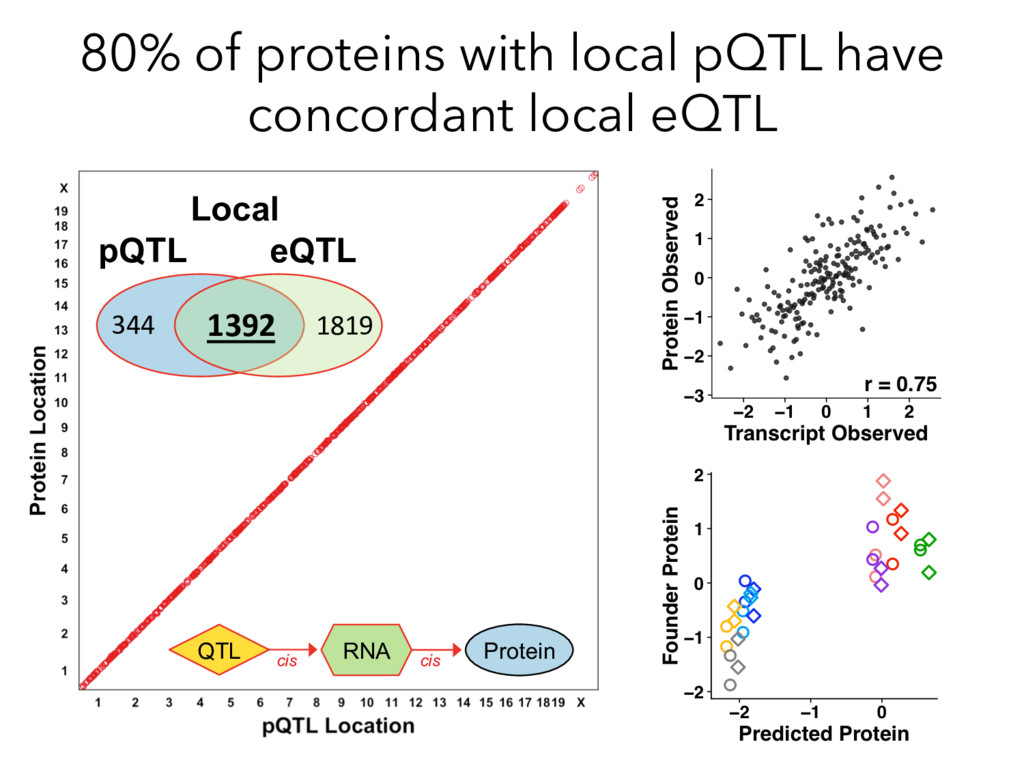
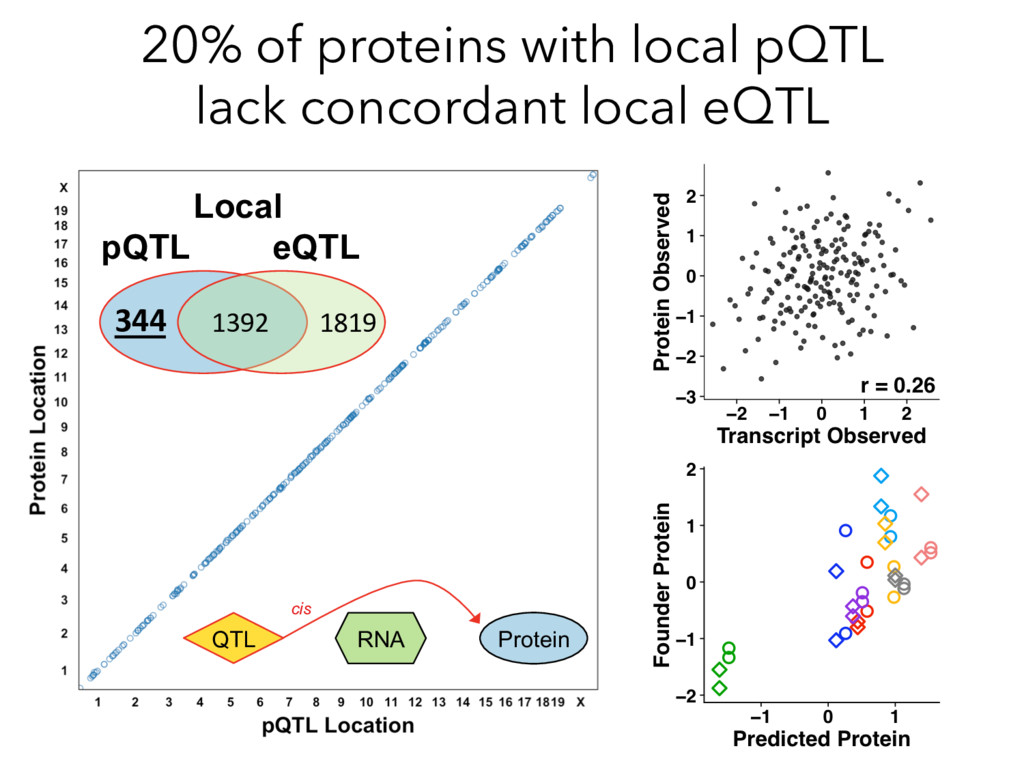
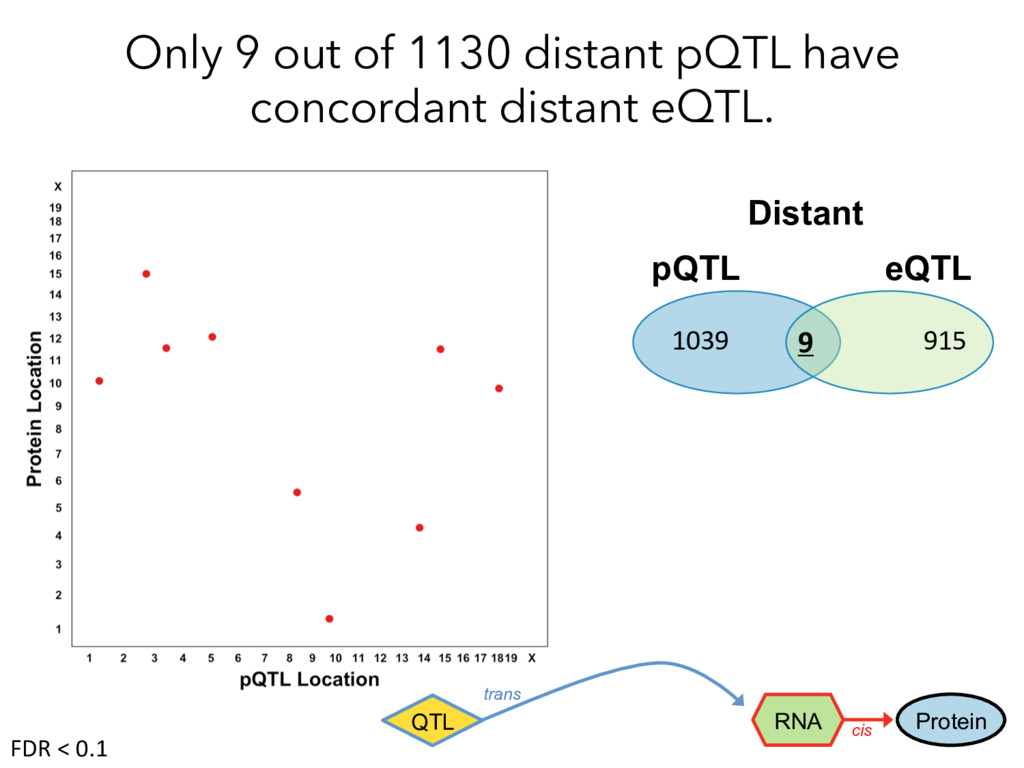
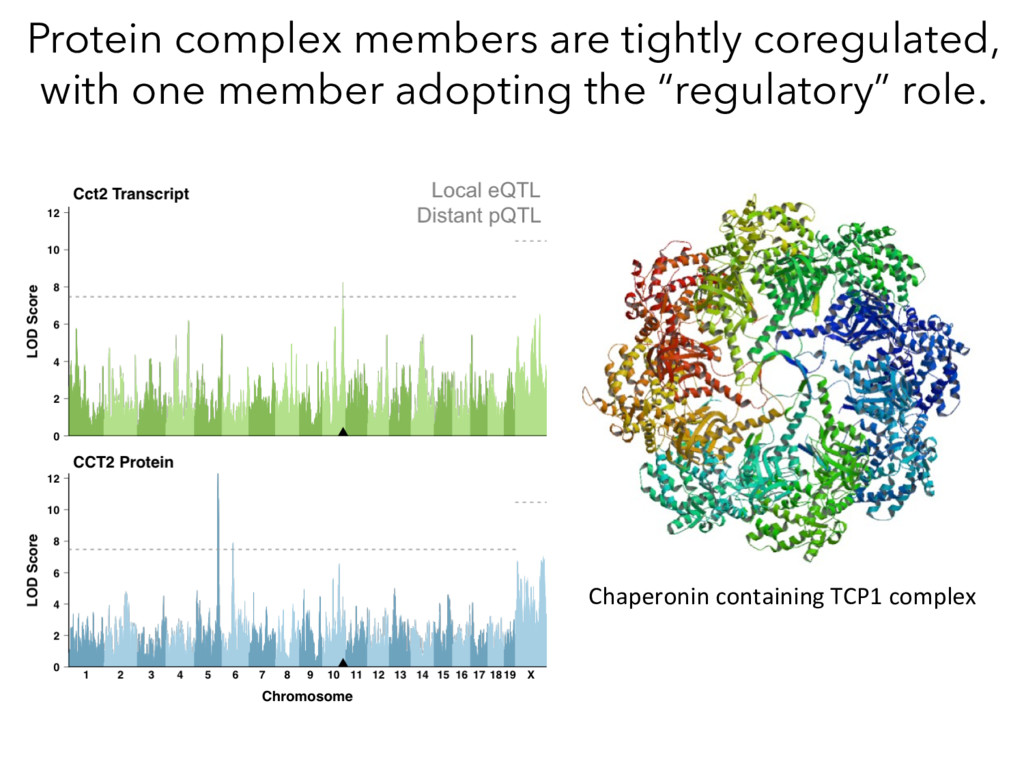
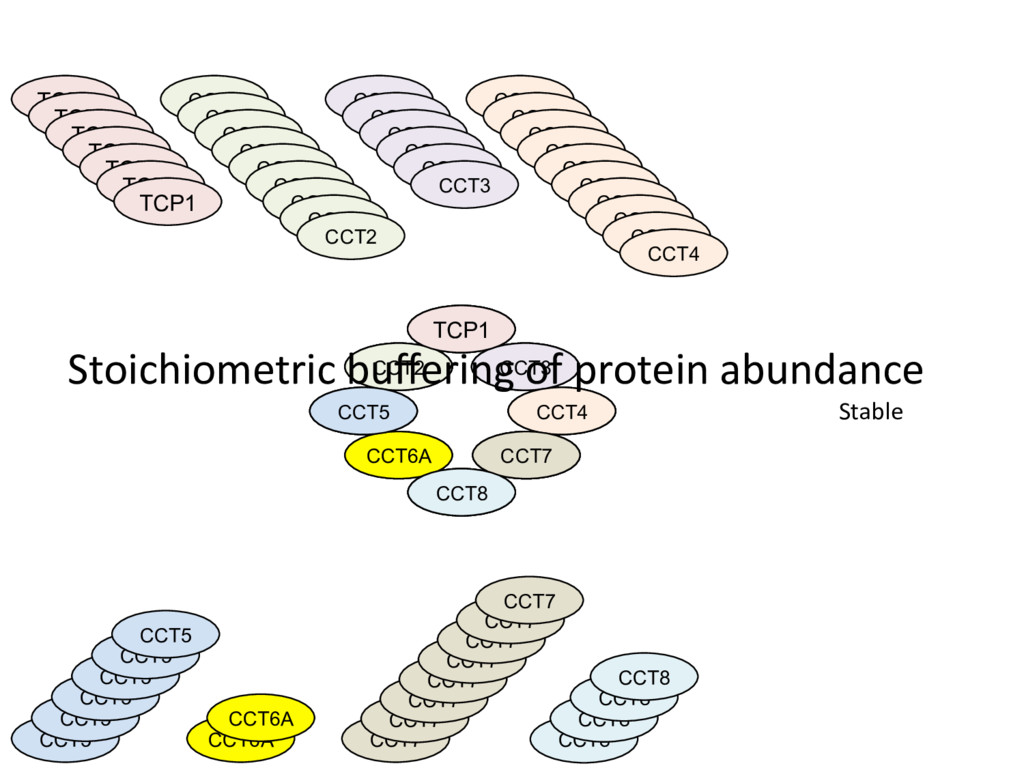
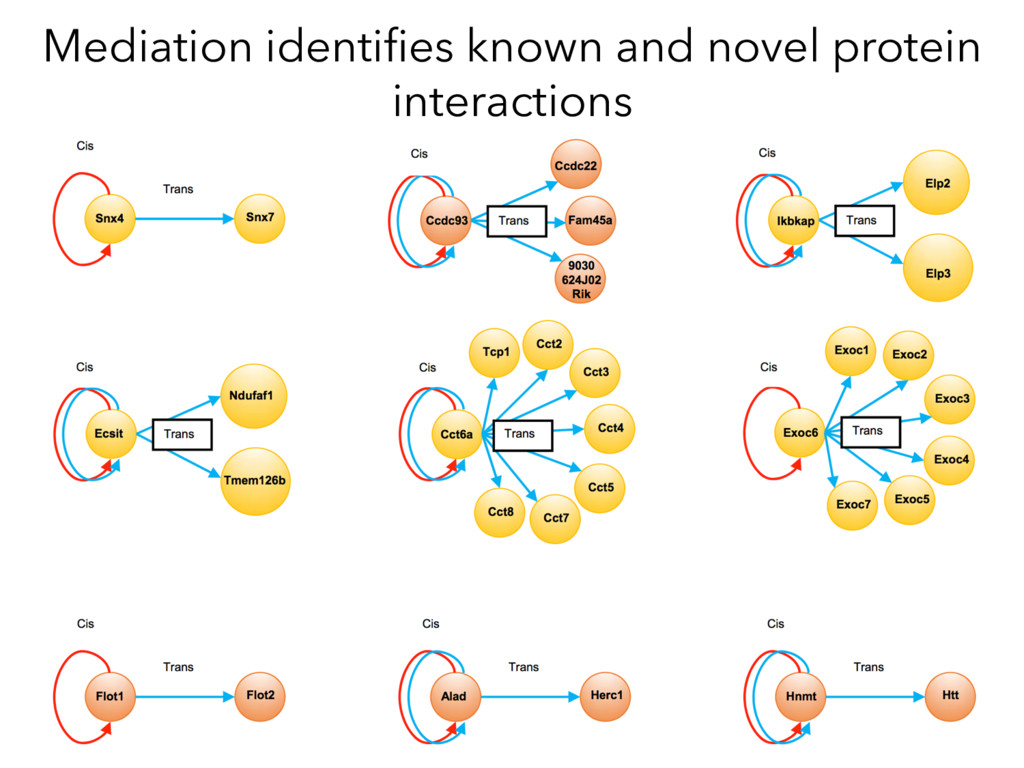
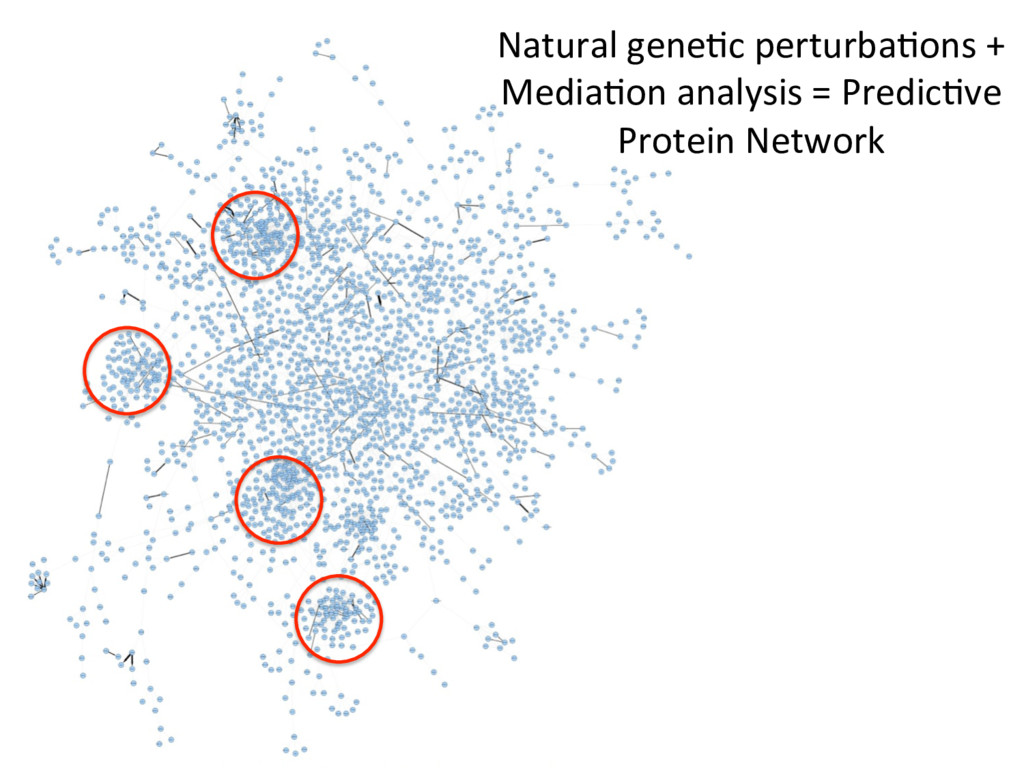
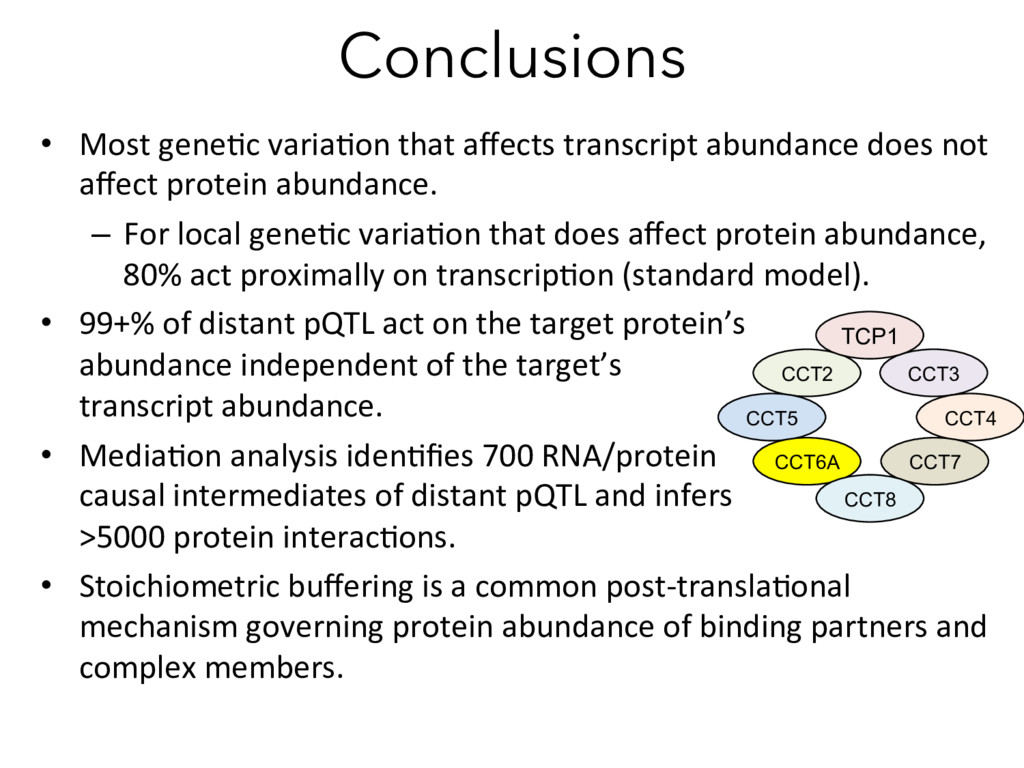
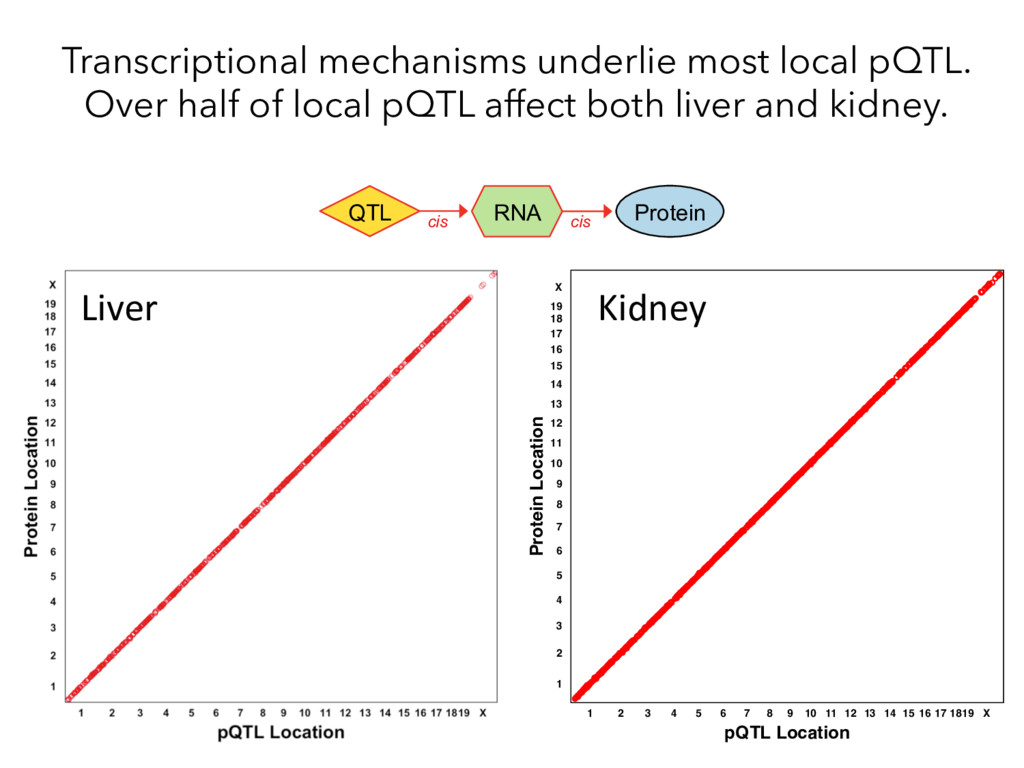
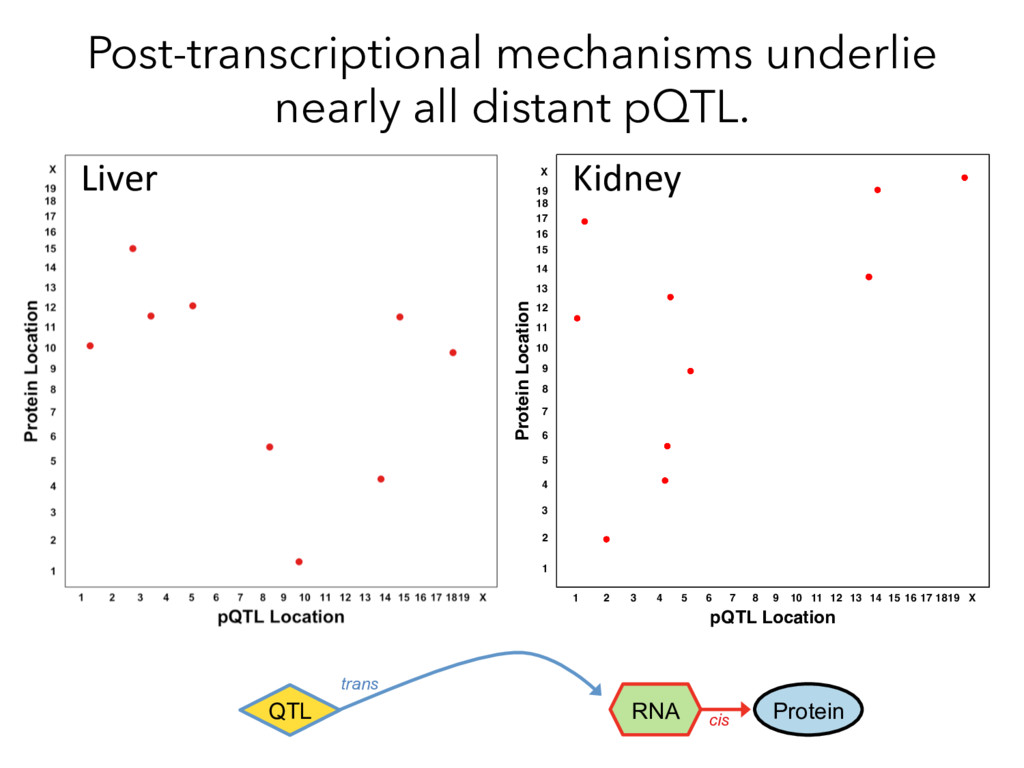
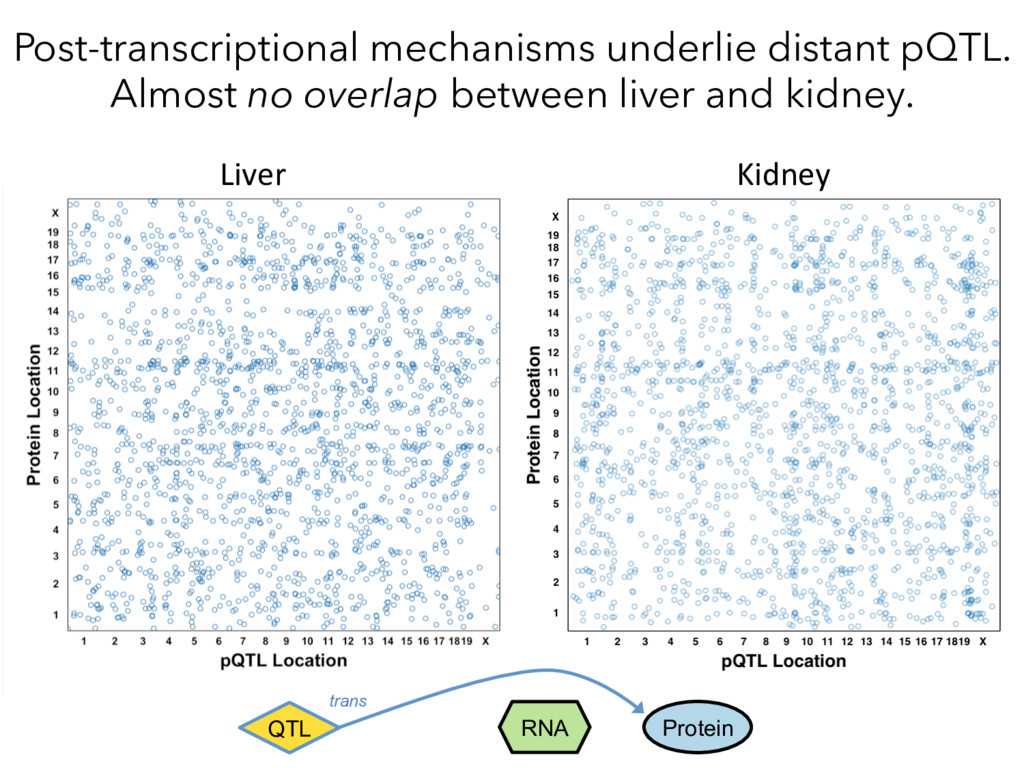
not affect protein abundance. – For local gene)c varia)on that does affect protein abundance, 80% act proximally on transcrip)on (standard model). • 99+% of distant pQTL act on the target protein’s abundance independent of the target’s transcript abundance. • Media)on analysis iden)fies 700 RNA/protein causal intermediates of distant pQTL and infers >5000 protein interac)ons. • Stoichiometric buffering is a common post-transla)onal mechanism governing protein abundance of binding partners and complex members. CCT2 CCT3 CCT5 CCT6A CCT4 CCT7 CCT8 TCP1
Mediation Analysis RNA Protein QTL trans cis RNA Protein Target Causal Intermediates RNA Protein trans QTL cis Target Target Protein ~ pQTLdistant Target Protein ~ pQTLdistant + MediatorProtein x 8000 proteins Target Protein ~ pQTLdistant + MediatorRNA x 21000 Transcripts X