Upgrade to Pro — share decks privately, control downloads, hide ads and more …

Short introduction to systems genetics

Steve Munger
September 25, 2015

Short introduction to systems genetics

Talk given at Tufts Genetics Graduate Program Retreat 9/25/2015

Steve Munger

September 25, 2015
Tweet

More Decks by Steve Munger

Other Decks in Research

Transcript

  1. Harnessing natural genetic diversity to understand normal development, disorder, and

    disease. “Systems Genetics” Steven Munger The Jackson Laboratory @stevemunger Slides available at https://speakerdeck.com/stevemunger
  2. Our genetic differences make us unique. •  Eye color, height,

    behavior •  Genetic predisposition to disease •  Drug efficacy/toxicity
  3. Photo: Brynn Voy Embracing genetic diversity Founder Strains of the

    Collaborative Cross/ Diversity Outcross Morgan  &  Welsh,  Mamm.Gen.,  2015  
  4. 50 40 30 20 10 Body weight (gm) 7/11/2014 7/31/2014

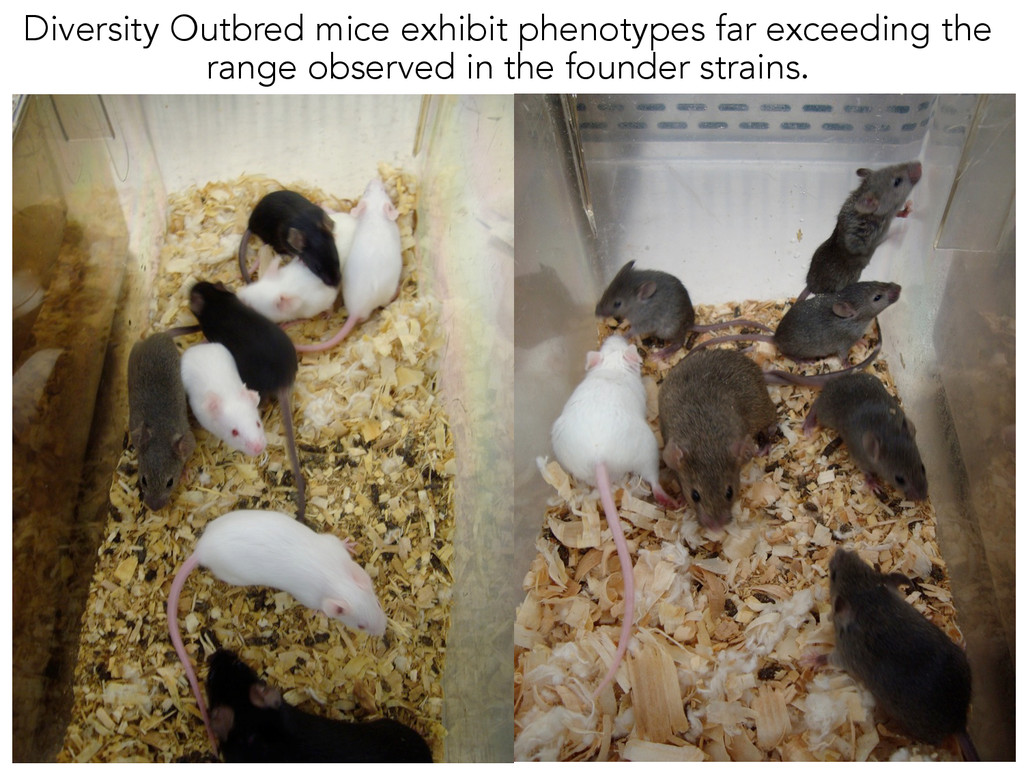
    8/20/2014 date 50 40 30 20 10 Body weight (gm) 7/11/2014 7/31/2014 8/20/2014 date female DO mice male DO mice DO mice are genetically and phenotypically diverse Alan Attie & Mark Keller Female DO mice Male DO mice
  5. b MS pping Inbreeding Outbreeding Founder Strains Collaborative Cross (CC)

    Diversity Outcross (DO) A/J C57BL/6J 129S1/SvImJ NOD/ShiLtJ NZO/H1LtJ CAST/EiJ PWK/PhJ WSB/EiJ Discovery è Predictions è Validation Diversity Outbred (DO)
  6. a b 192 DO Livers Proteins Peptides Transcripts Short Reads

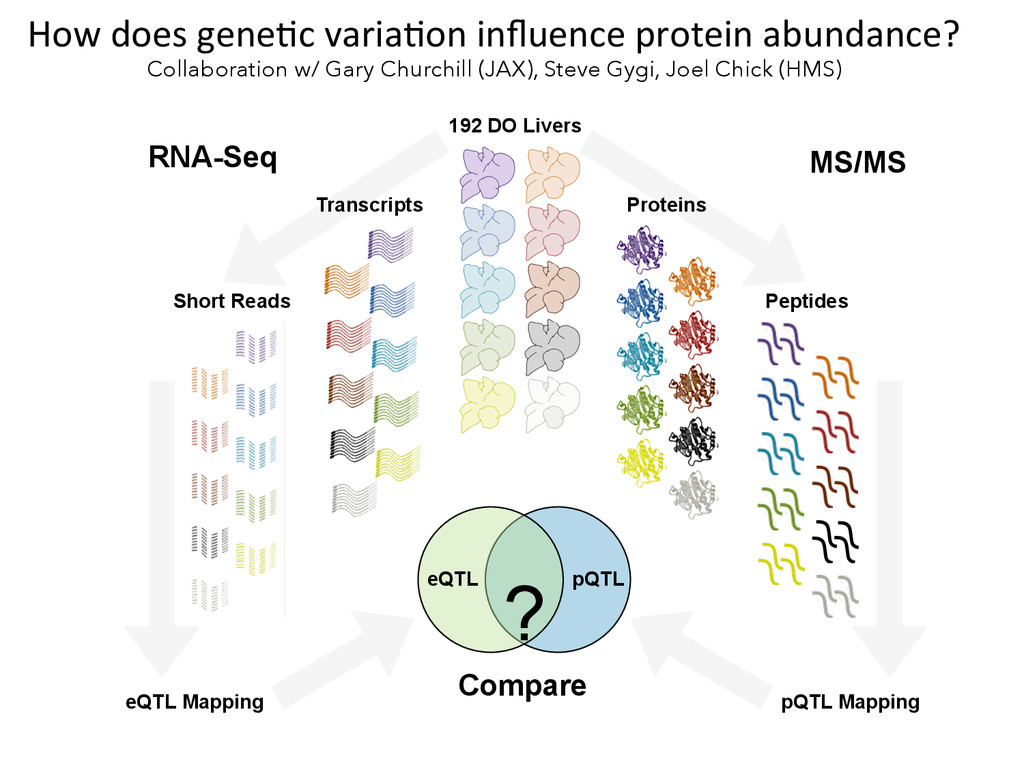
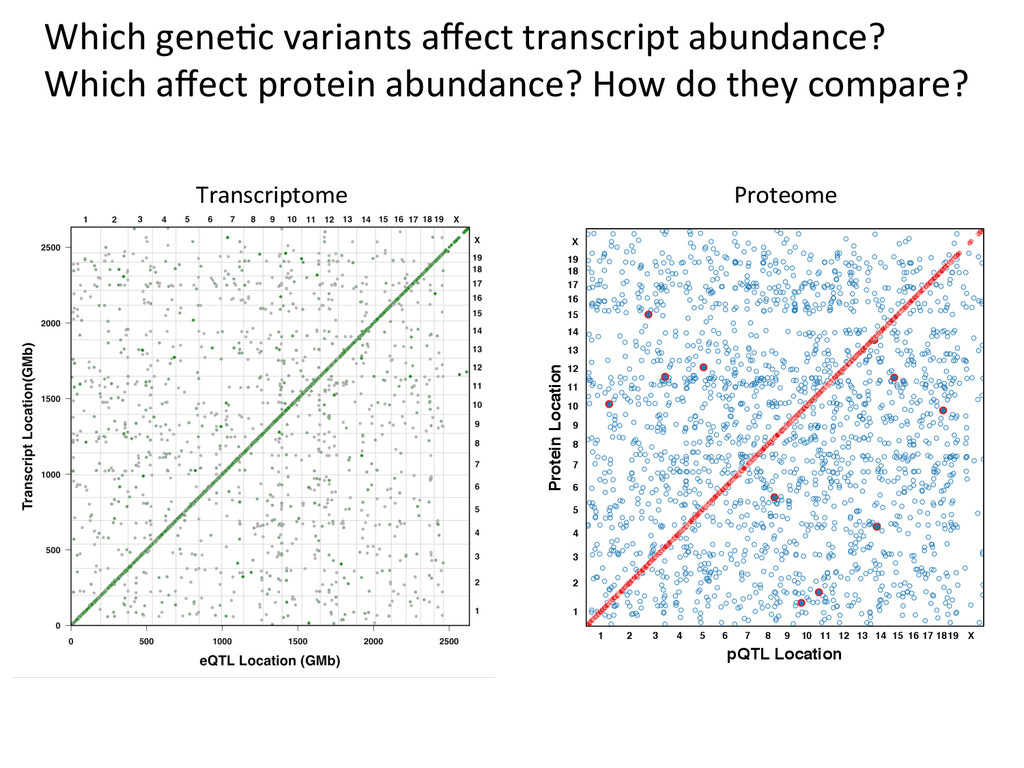
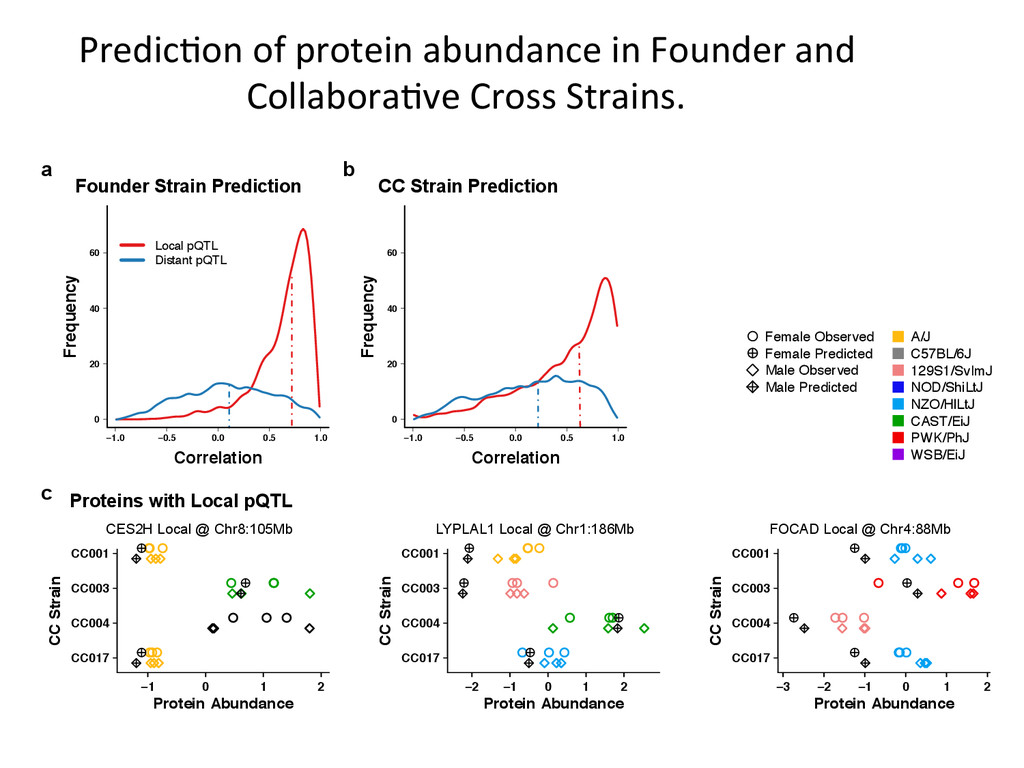
    eQTL pQTL RNA-Seq MS/MS eQTL Mapping pQTL Mapping Compare 1 ? How  does  gene6c  varia6on  influence  protein  abundance?   Collaboration w/ Gary Churchill (JAX), Steve Gygi, Joel Chick (HMS)
  7. Mapping regions of the genome (QTL) that influence transcript (eQTL)

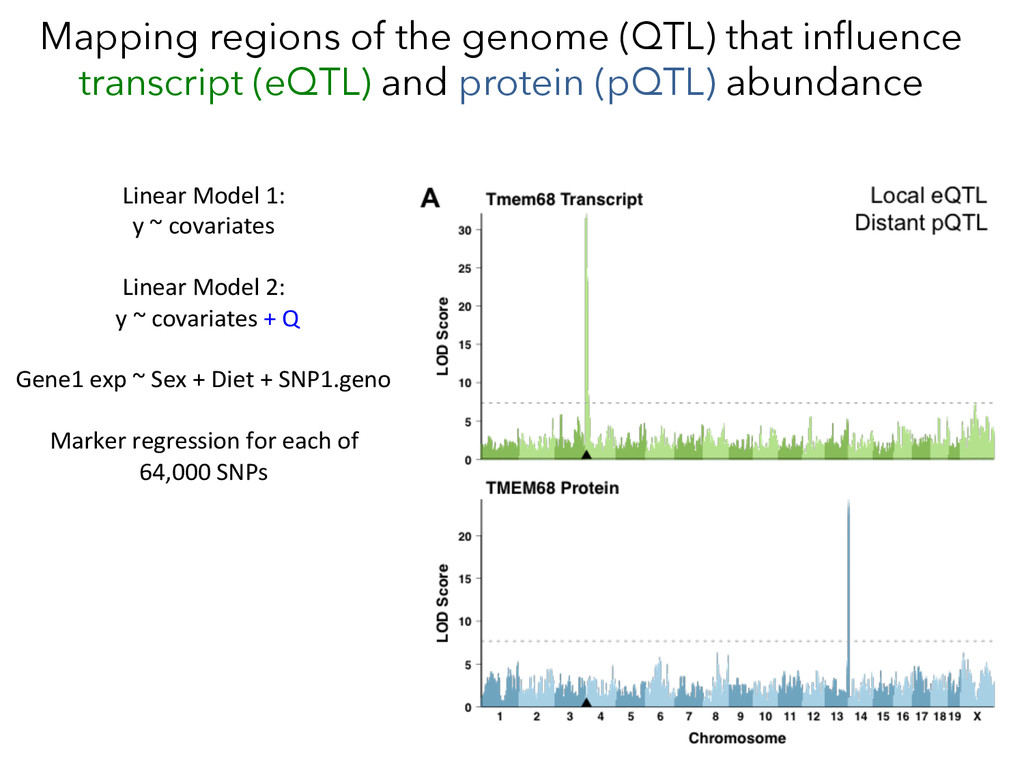
    and protein (pQTL) abundance Linear  Model  1:     y  ~  covariates     Linear  Model  2:    y  ~  covariates  +  Q     Gene1  exp  ~  Sex  +  Diet  +  SNP1.geno     Marker  regression  for  each  of   64,000  SNPs    
  8. Protein Location pQTL Location 1 2 3 4 5 6

    7 8 9 10 11 12 13 14 15 16 17 1819 X 1 2 3 4 5 6 7 8 9 10 11 12 13 14 15 16 17 18 19 X • • • • • • • • • • • • • • • • • • • • • • • • • • a 200 No pQTL Local pQTL Distant pQTL c e d b Total eQTL pQTL 3477 2289 1403 N=8050 Which  gene6c  variants  affect  transcript  abundance?   Which  affect  protein  abundance?  How  do  they  compare?   Transcriptome   Proteome  
  9. Protein Location pQTL Location 1 2 3 4 5 6

    7 8 9 10 11 12 13 14 15 16 17 1819 X 1 2 3 4 5 6 7 8 9 10 11 12 13 14 15 16 17 18 19 X • • • • • • • • • • • • • • • • • • • • • • • • • • a c e d −2 −1 0 1 2 −3 −2 −1 0 1 2 Protein Transcript r = 0.84 −3 −2 −1 0 1 2 Protein −2 −1 0 1 2 −3 −2 −1 0 1 2 Protein Transcript r = 0.69 −3 −2 −1 0 1 2 Protein Acss3 La Glul Pp Local eQTL, local pQTL N Distant eQTL, distant pQTL L b eQTL pQTL The  Liver  pQTL  Landscape   pQTL Loc 1 2 3 4 5 6 7 8 9 1 2 3 4 b Total Local Distant eQTL pQTL 3477 2322 1155 2289 338 1390 1951 13 1403 N=8050 f Local regulation
  10. Protein Location pQTL Location 1 2 3 4 5 6

    7 8 9 10 11 12 13 14 15 16 17 1819 X 1 2 3 4 5 6 7 8 9 10 11 12 13 14 15 16 17 18 19 X • • • • • • • • • • • • • • • • • • • • • • • • • • a 150 200 ency No pQTL Local pQTL Distant pQTL c 30 40 50 | Transcript Local pQTL 20 25 30 Distant pQTL | Transcript e d −2 −1 0 1 2 −3 −2 −1 0 1 2 Protein Transcript r = 0.84 • • • • • • • • • • • • • • • • • • • • • • • • • • • • • • • • • • • • • • • • • • • • • • • • • • • • • • • • • • • • • • • • • • • • • • • • • • • • • • • • • • • • • • • • • • • • • • • • • • • • • • • • • • • • • • • • • • • • • • • • • • • • • • • • • • • • • • • • • • • • • • • • • • • • • • • • • • • • • • • • • • • • • • • • • • • • • • • • • • • • • • • • • • • • • • • • −2 −1 0 1 2 −3 −2 −1 0 1 2 Protein Transcript r = 0.04 −2 −1 0 1 2 −3 −2 −1 0 1 2 Protein Transcript r = 0.69 • • • • • • • • • • • • • • • • • • • • • • • • • • • • • • • • • • • • • • • • • • • • • • • • • • • • • • • • • • • • • • • • • • • • • • • • • • • • • • • • • • • • • • • • • • • • • • • • • • • • • • • • • • • • • • • • • • • • • • • • • • • • • • • • • • • • • • • • • • • • • • • • • • • • • • • • • • • • • •• • • • • • • • • • • • • • • • • • • • • • • • • • • • • • • • • • −2 −1 0 1 2 −3 −2 −1 0 1 2 Protein Transcript r = 0.22 Acss3 Lars2 Glul Ppie Local eQTL, local pQTL No eQTL, local pQTL Distant eQTL, distant pQTL Local eQTL, distant pQTL b Total eQTL pQTL 3477 2289 1403 N=8050 The  Liver  pQTL  Landscape  
  11. Models  of  Protein  Expression  Regula6on   (N  =  1390)  

    (N  =  338)   (N  =  2322)   (N  =  13)   (N  =  1951)