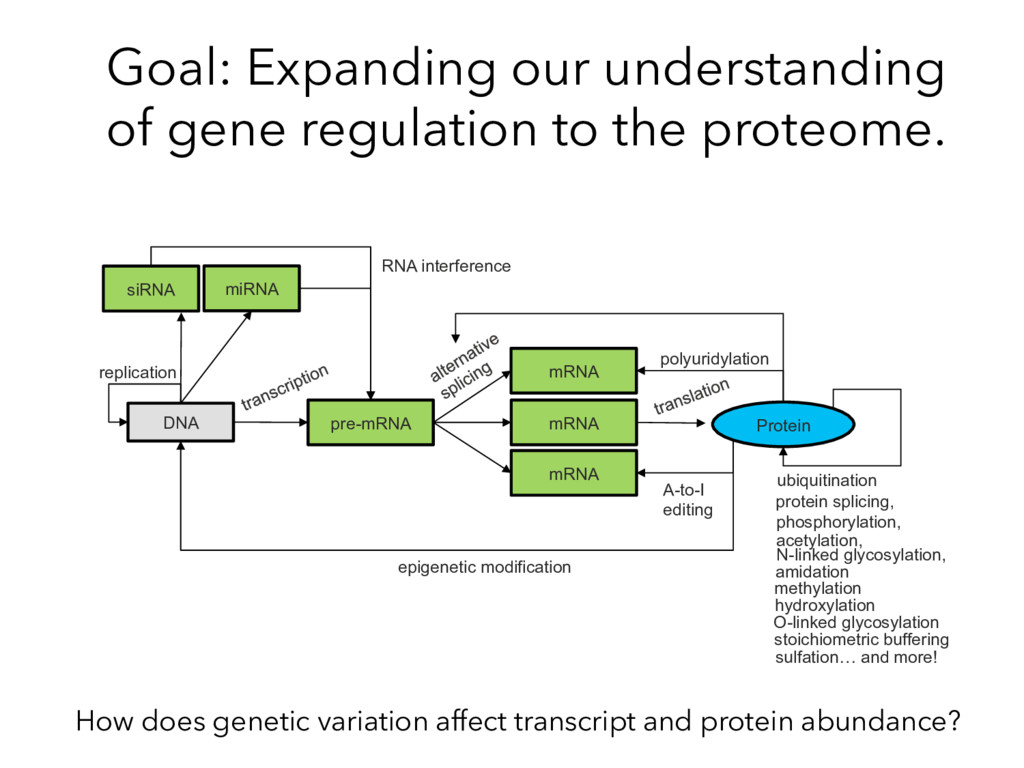
RNA interference protein splicing, phosphorylation, acetylation, N-linked glycosylation, amidation sulfation… and more! hydroxylation methylation O-linked glycosylation epigenetic modification A-to-I editing replication stoichiometric buffering Goal: Expanding our understanding of gene regulation to the proteome. How does genetic variation affect transcript and protein abundance?
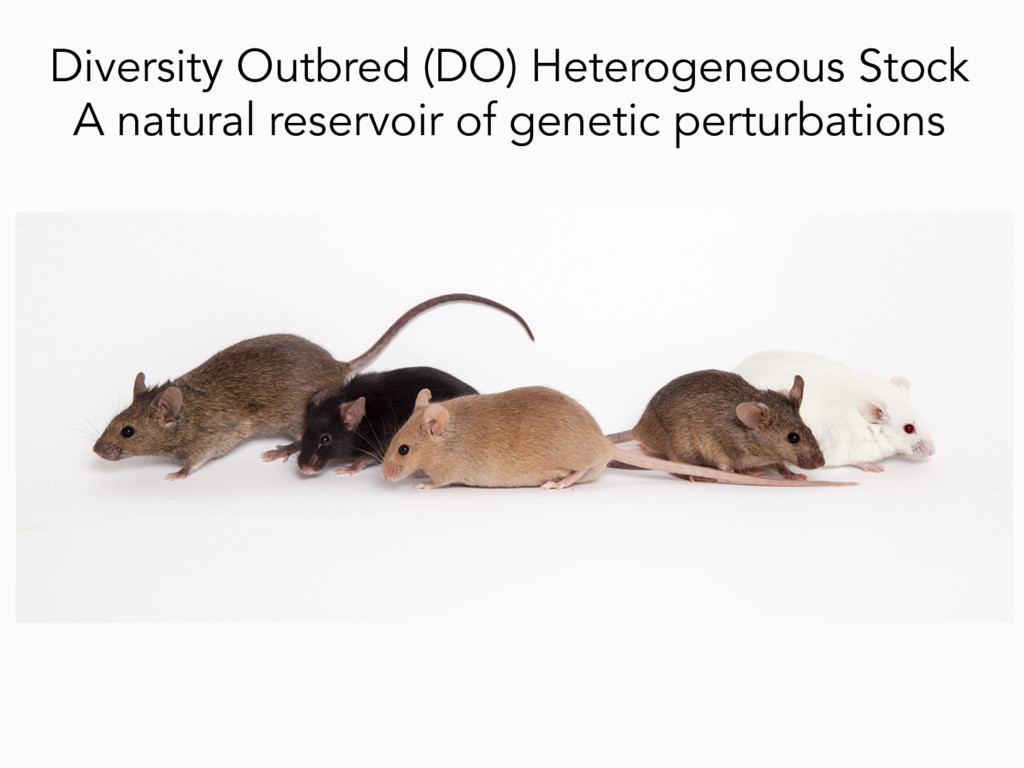
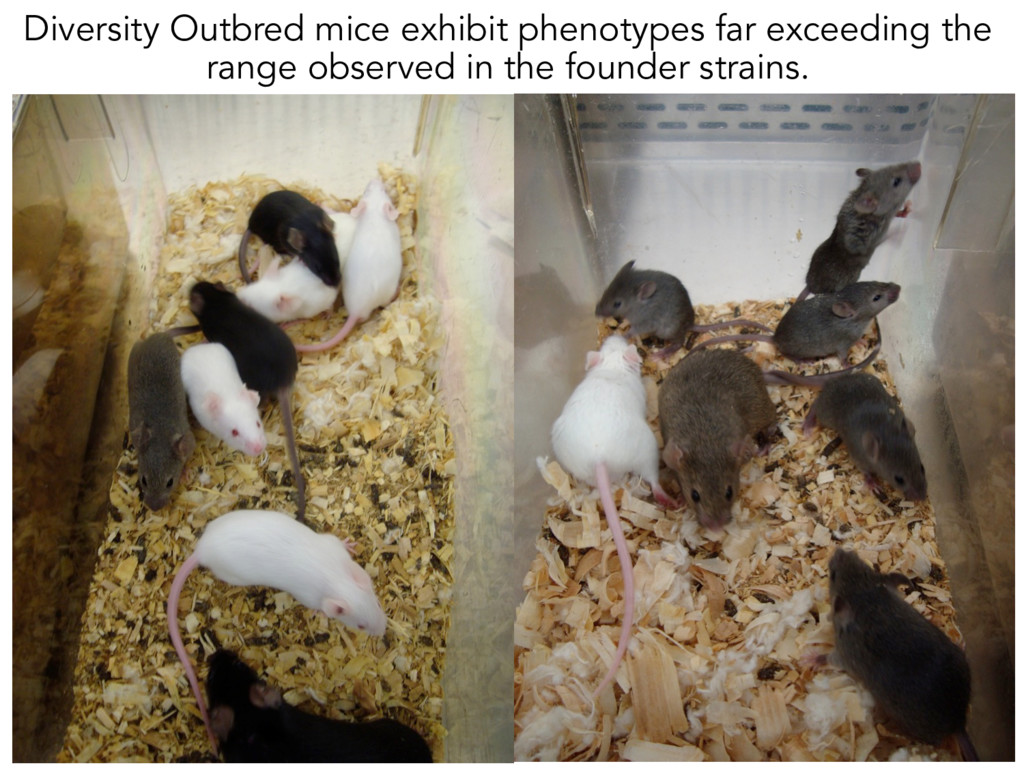
8/20/2014 date 50 40 30 20 10 Body weight (gm) 7/11/2014 7/31/2014 8/20/2014 date female DO mice male DO mice DO mice are genetically and phenotypically diverse Alan Attie & Mark Keller Female DO mice Male DO mice
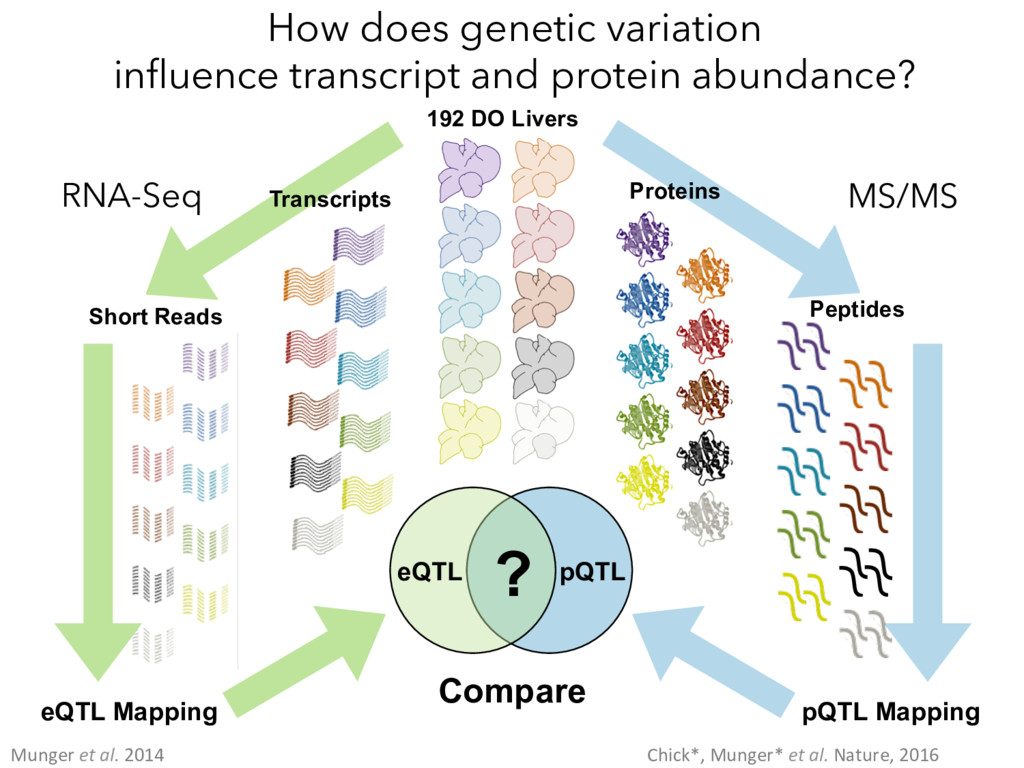
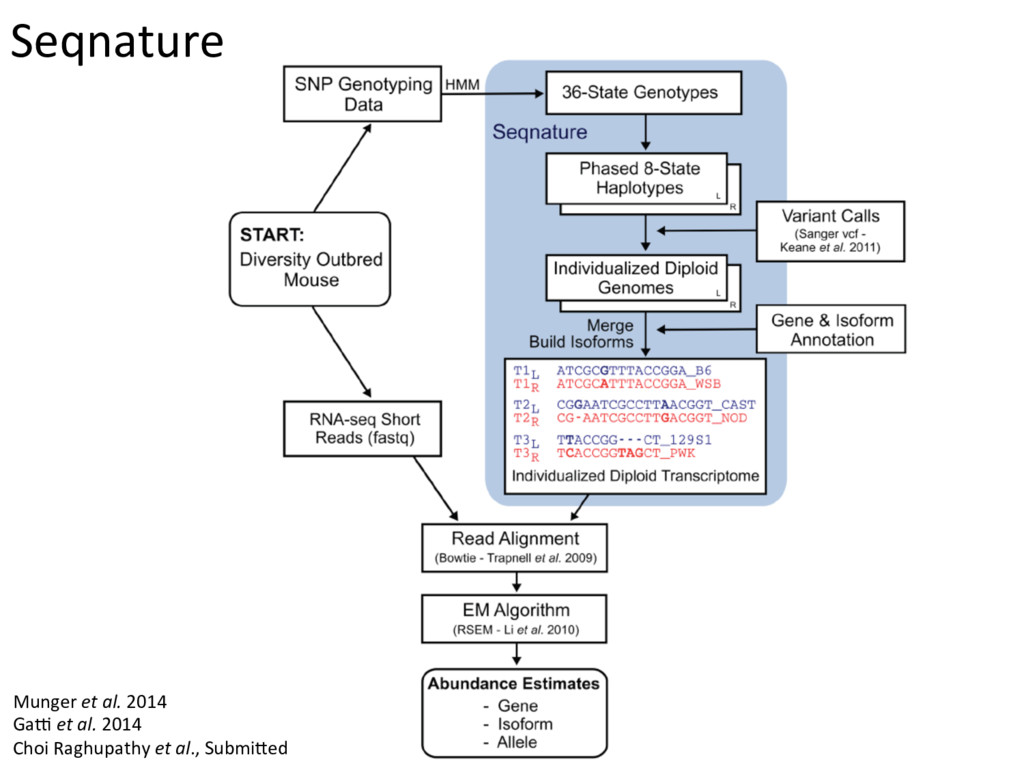
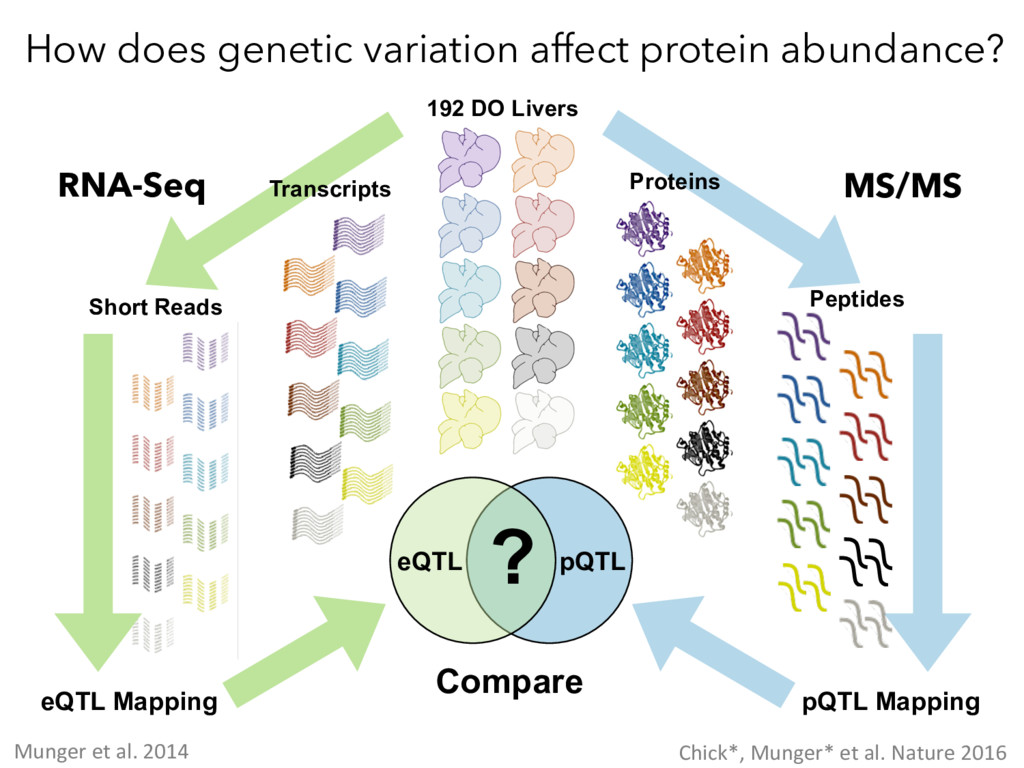
Mapping pQTL Mapping Proteins Peptides MS/MS Compare ? Munger et al. 2014 Chick*, Munger* et al. Nature, 2016 How does genetic variation influence transcript and protein abundance?
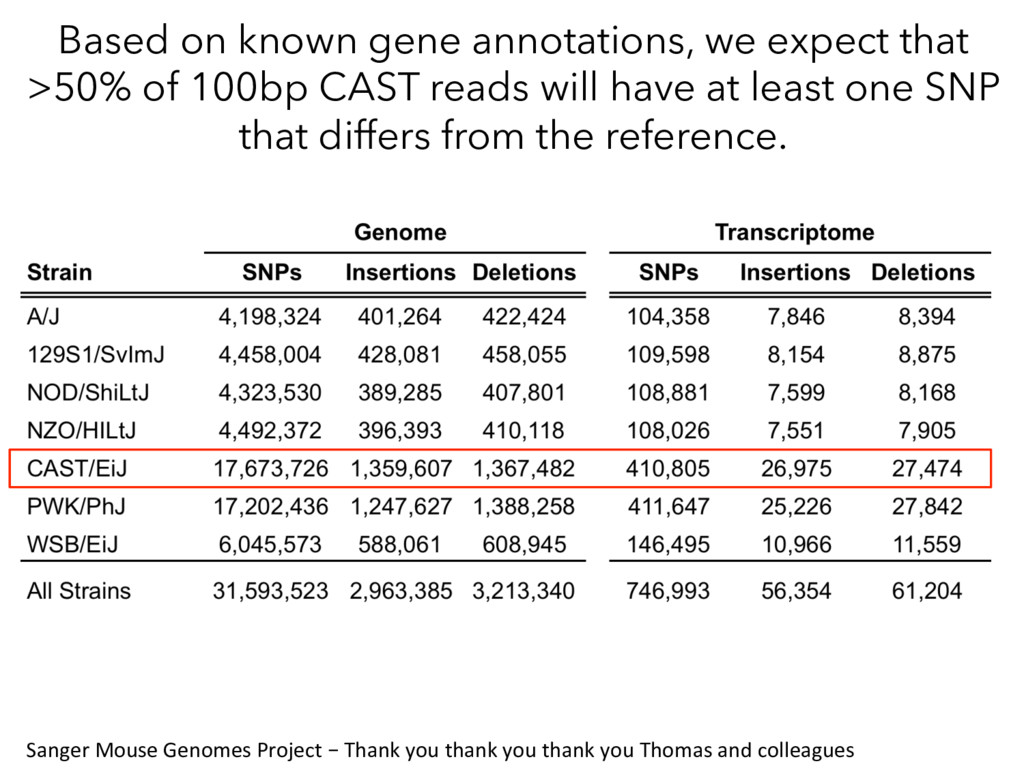
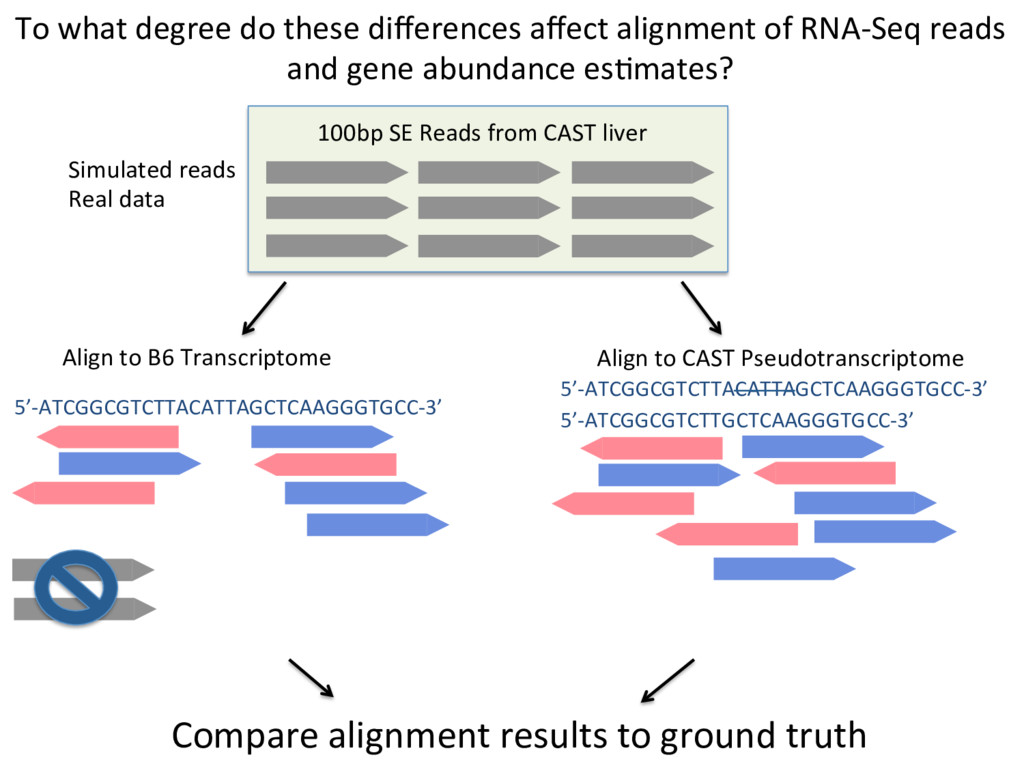
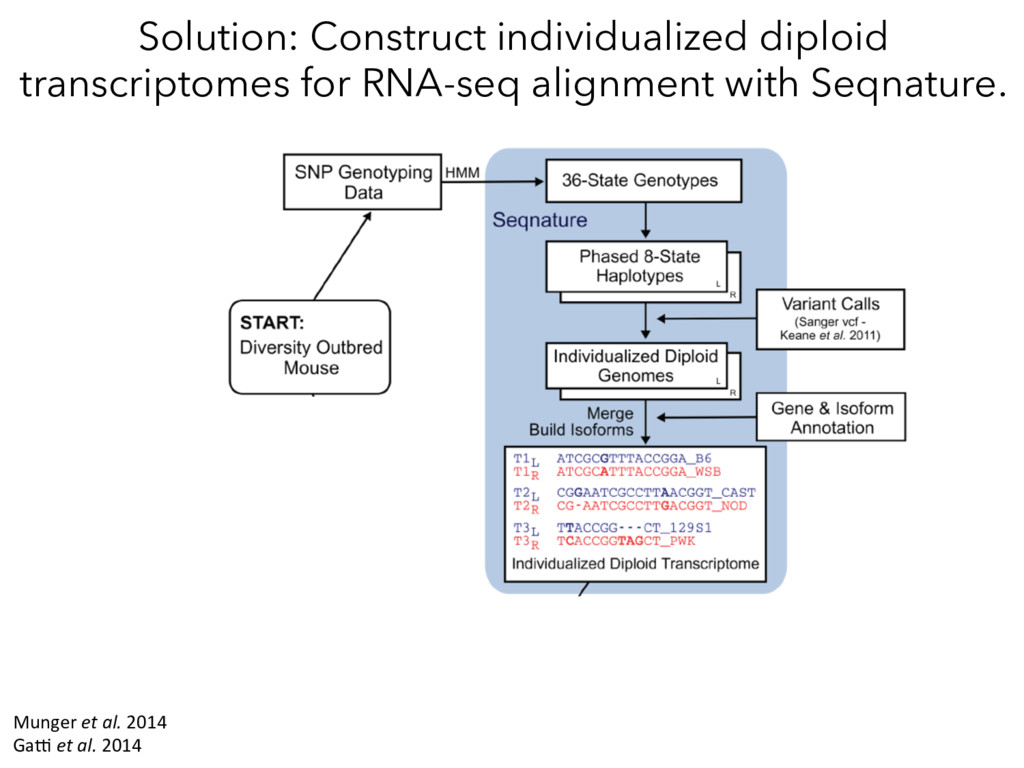
100bp CAST reads will have at least one SNP that differs from the reference. Sanger Mouse Genomes Project – Thank you thank you thank you Thomas and colleagues
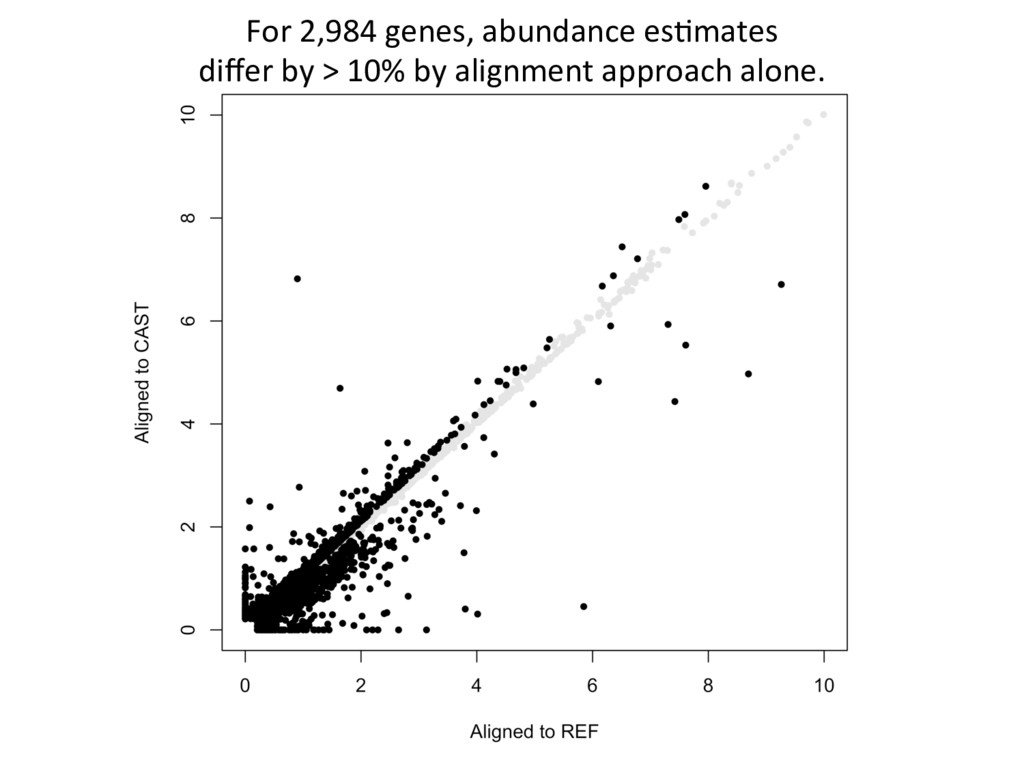
ground truth Align to CAST Pseudotranscriptome 5’-ATCGGCGTCTTACATTAGCTCAAGGGTGCC-3’ 5’-ATCGGCGTCTTGCTCAAGGGTGCC-3’ Align to B6 Transcriptome 5’-ATCGGCGTCTTACATTAGCTCAAGGGTGCC-3’ To what degree do these differences affect alignment of RNA-Seq reads and gene abundance es7mates? Simulated reads Real data
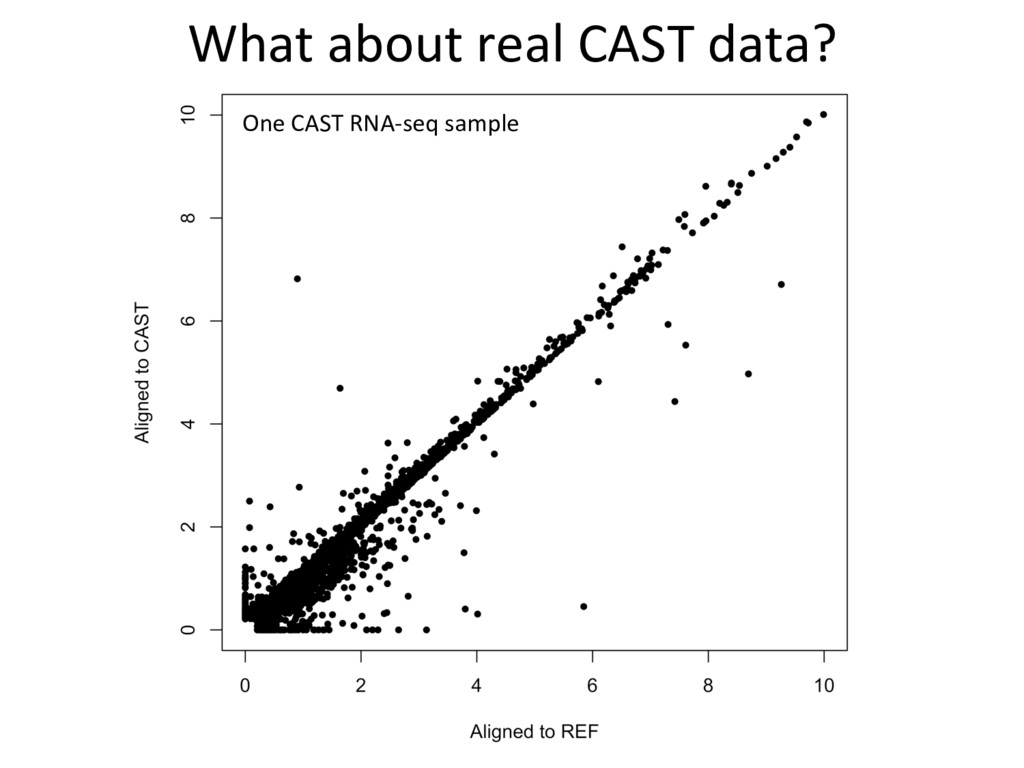
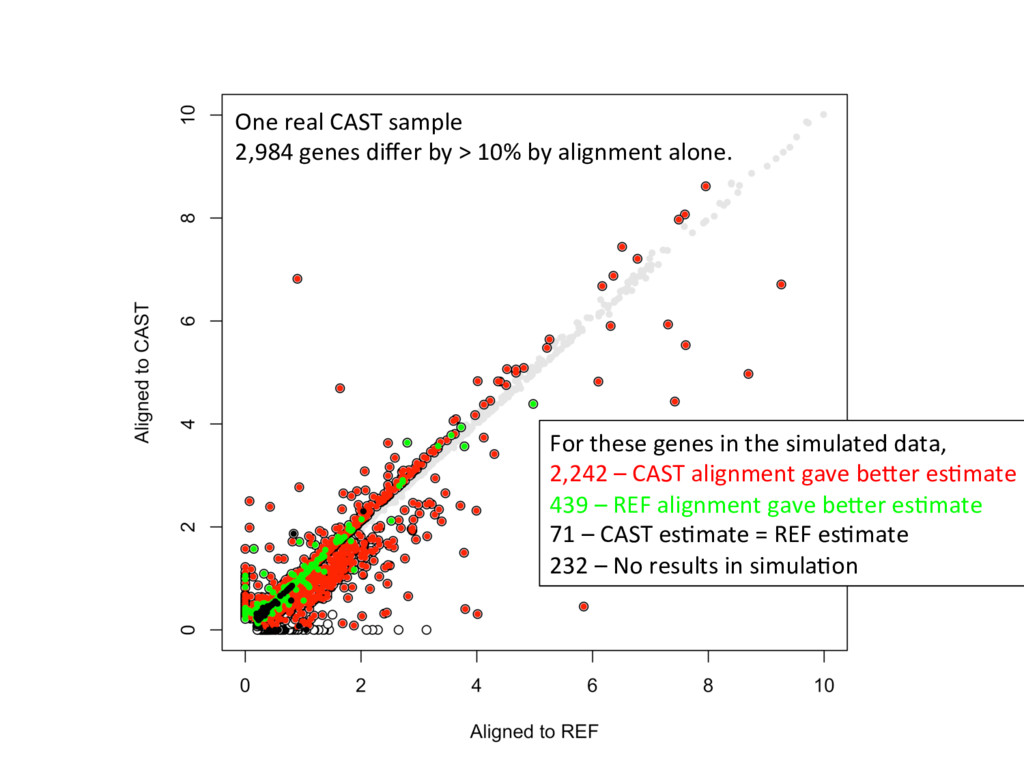
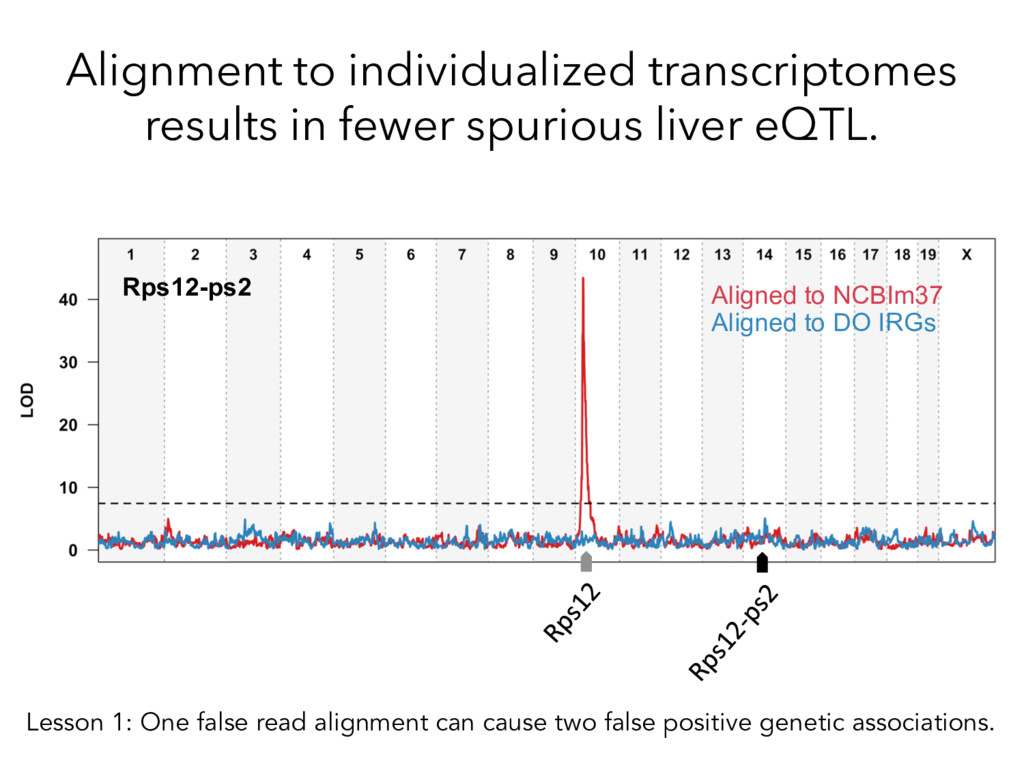
alignment gave beier es7mate 439 – REF alignment gave beier es7mate 71 – CAST es7mate = REF es7mate 232 – No results in simula7on One real CAST sample 2,984 genes differ by > 10% by alignment alone.
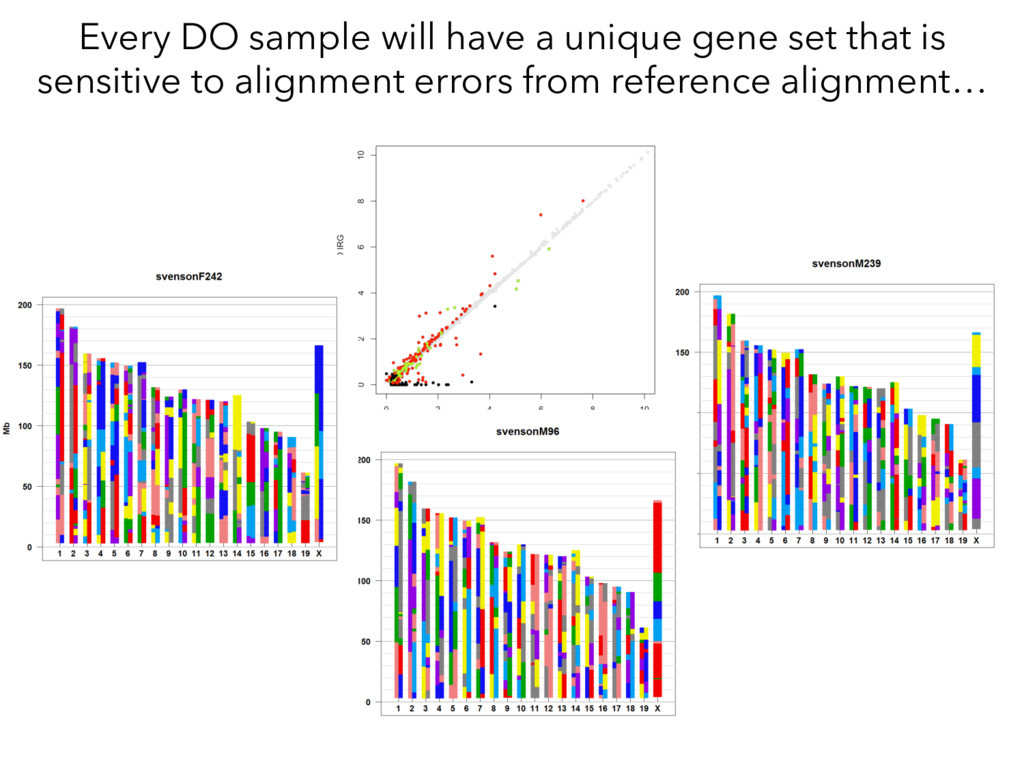
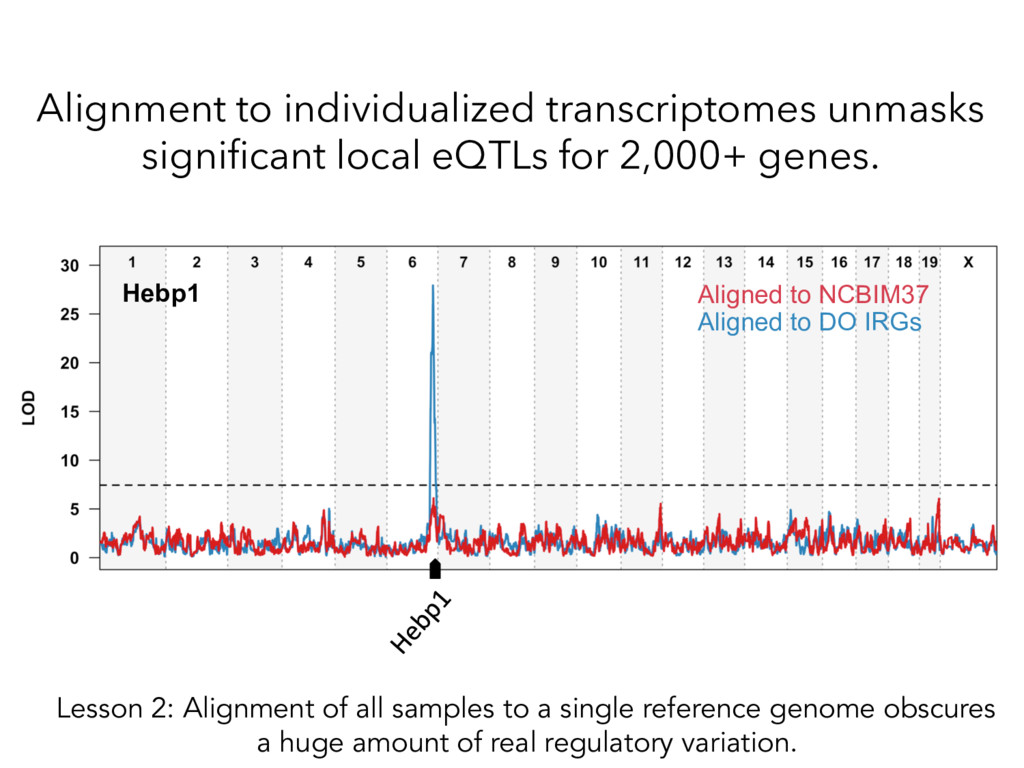
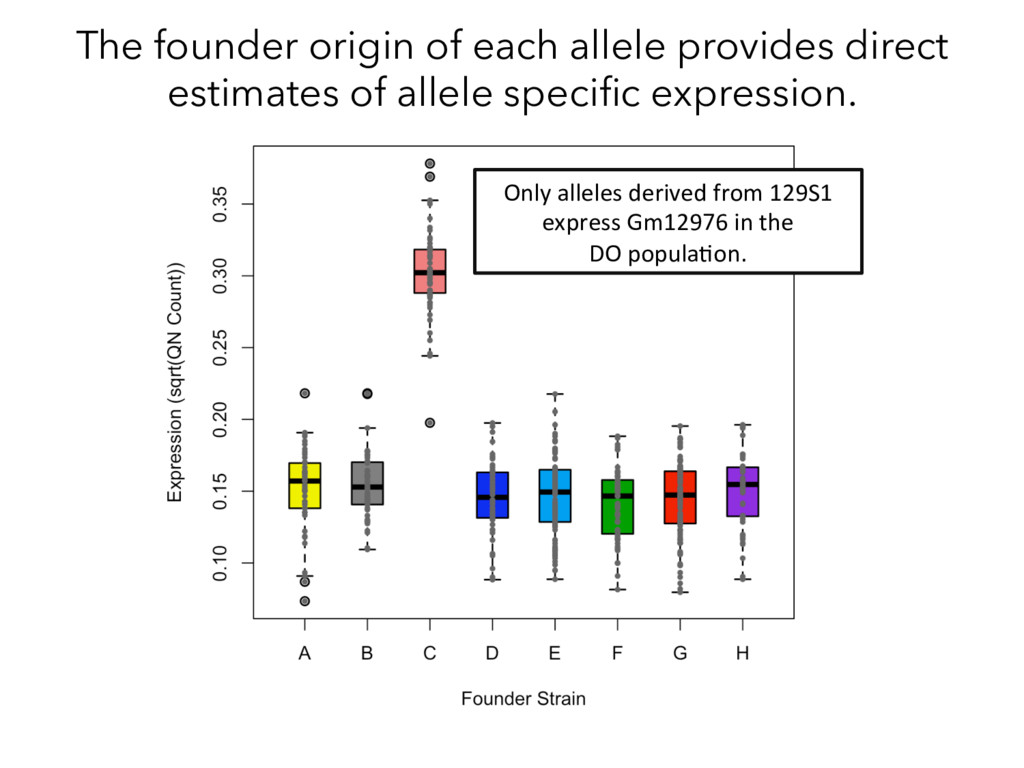
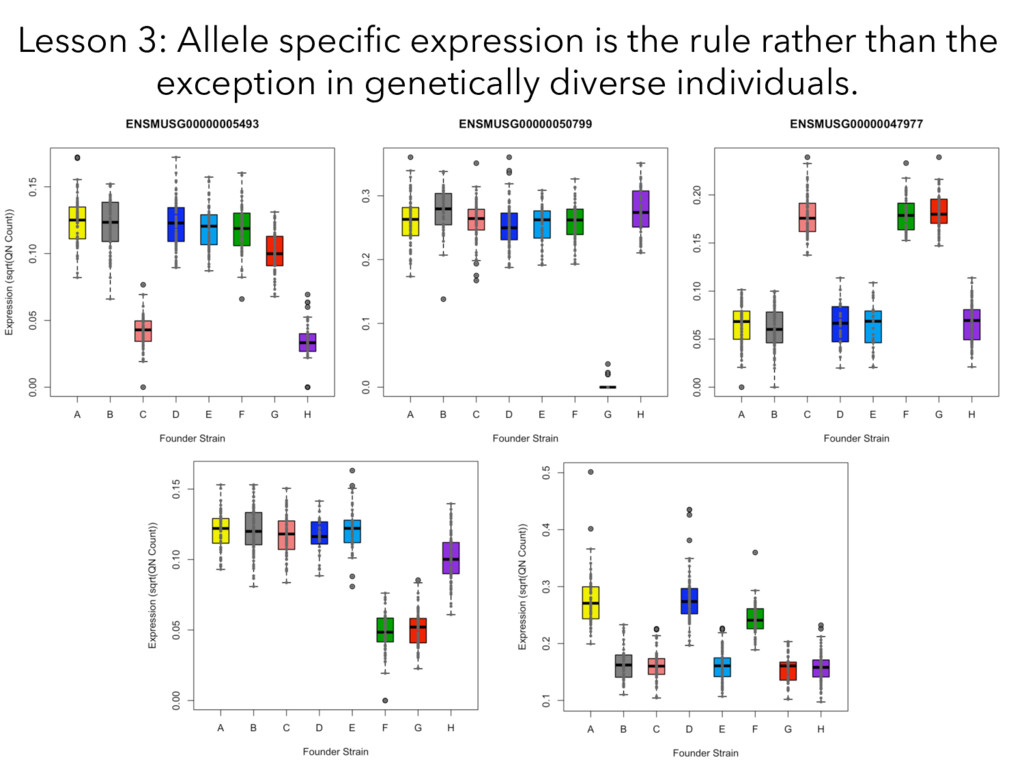
individualized transcriptomes unmasks significant local eQTLs for 2,000+ genes. Lesson 2: Alignment of all samples to a single reference genome obscures a huge amount of real regulatory variation.
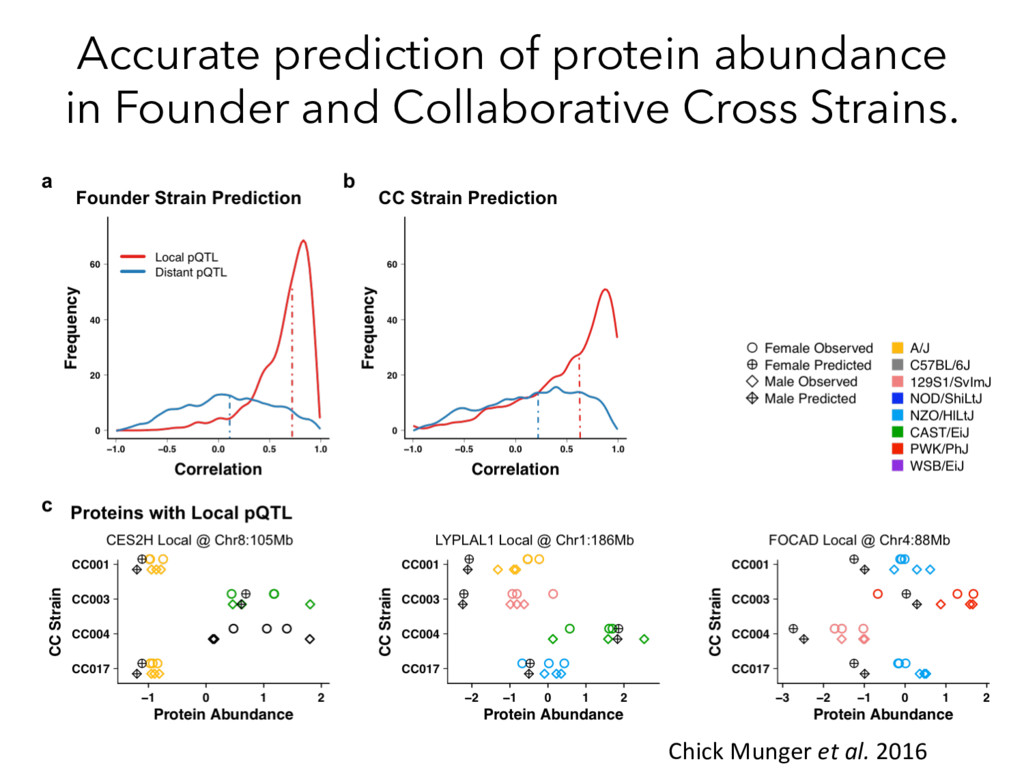
Mapping pQTL Mapping Proteins Peptides MS/MS Compare ? Munger et al. 2014 Chick*, Munger* et al. Nature 2016 How does genetic variation affect protein abundance?
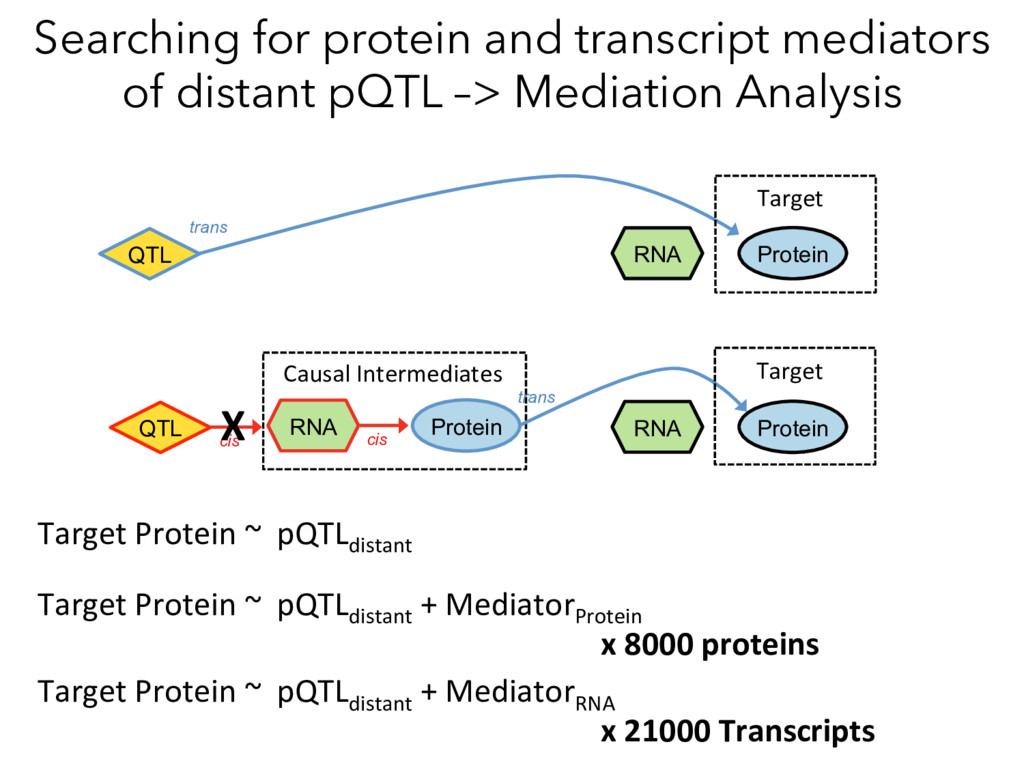
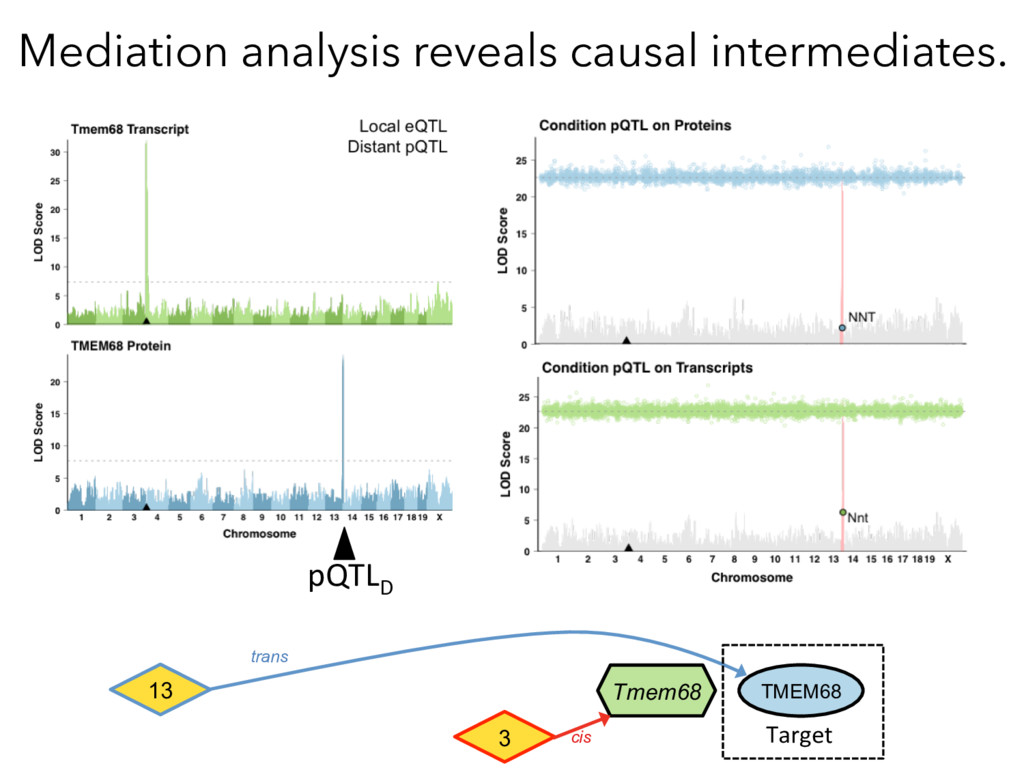
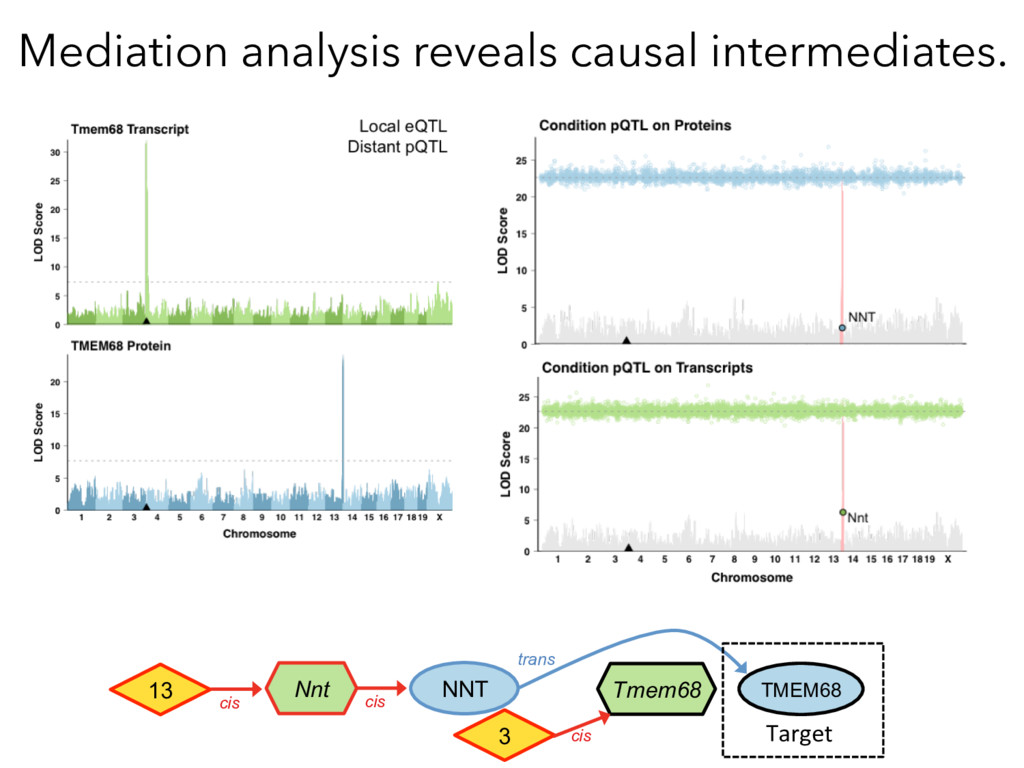
Mediation Analysis RNA Protein QTL trans cis RNA Protein Target Causal Intermediates RNA Protein trans QTL cis Target Target Protein ~ pQTLdistant Target Protein ~ pQTLdistant + MediatorProtein x 8000 proteins Target Protein ~ pQTLdistant + MediatorRNA x 21000 Transcripts X
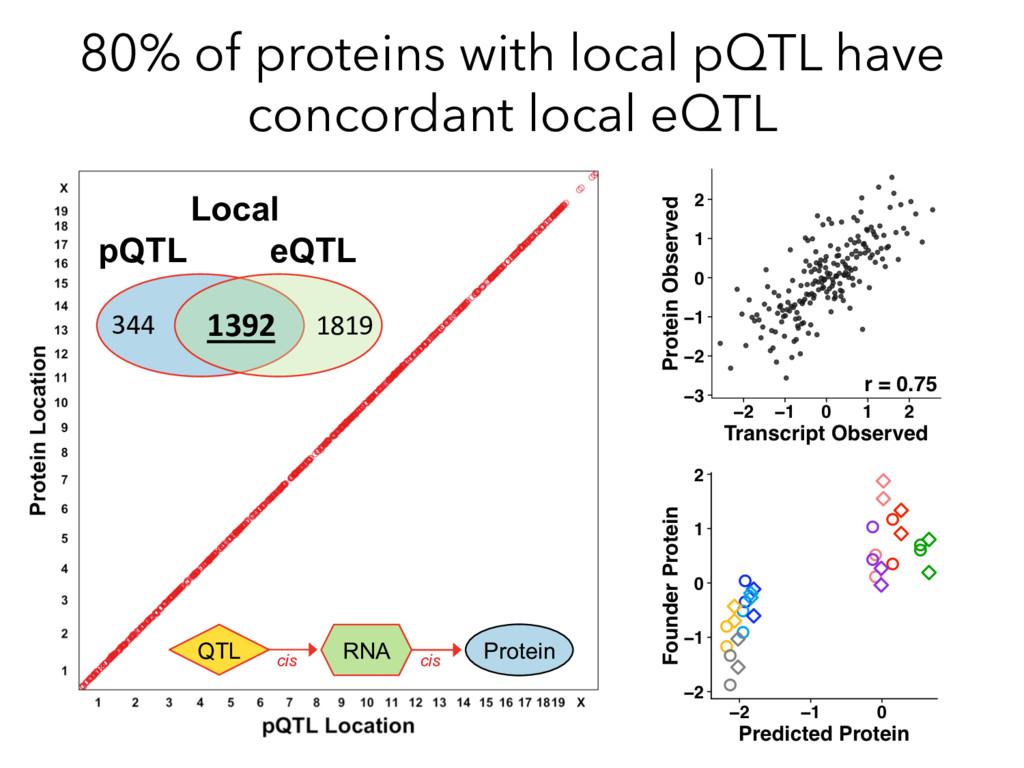
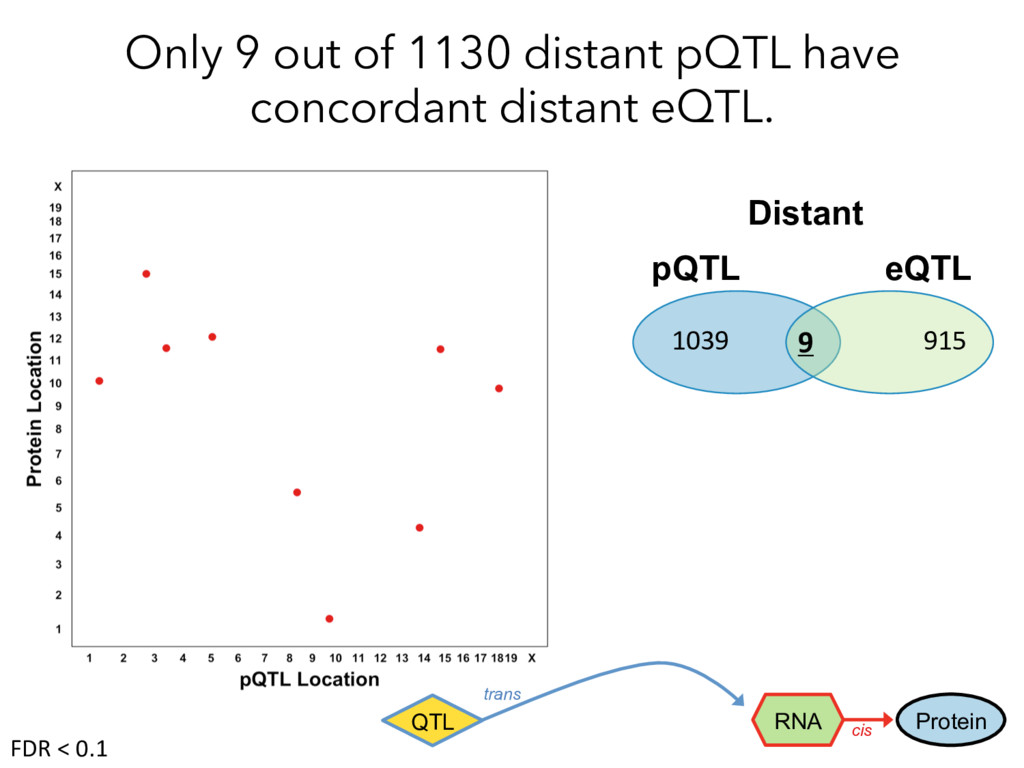
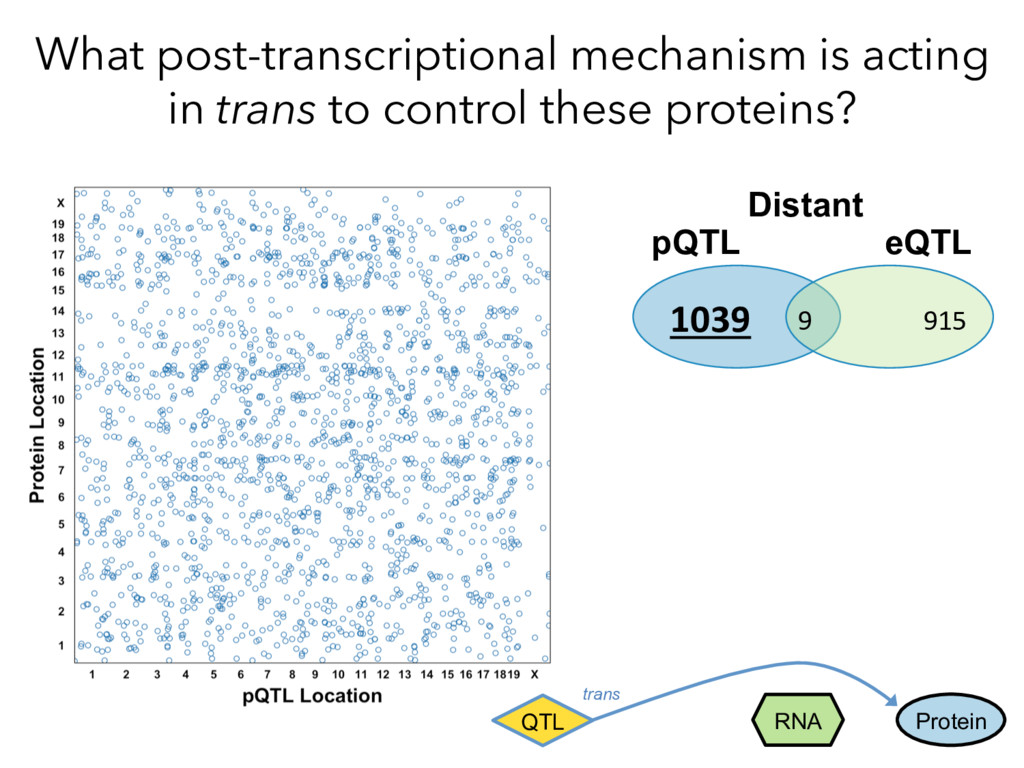
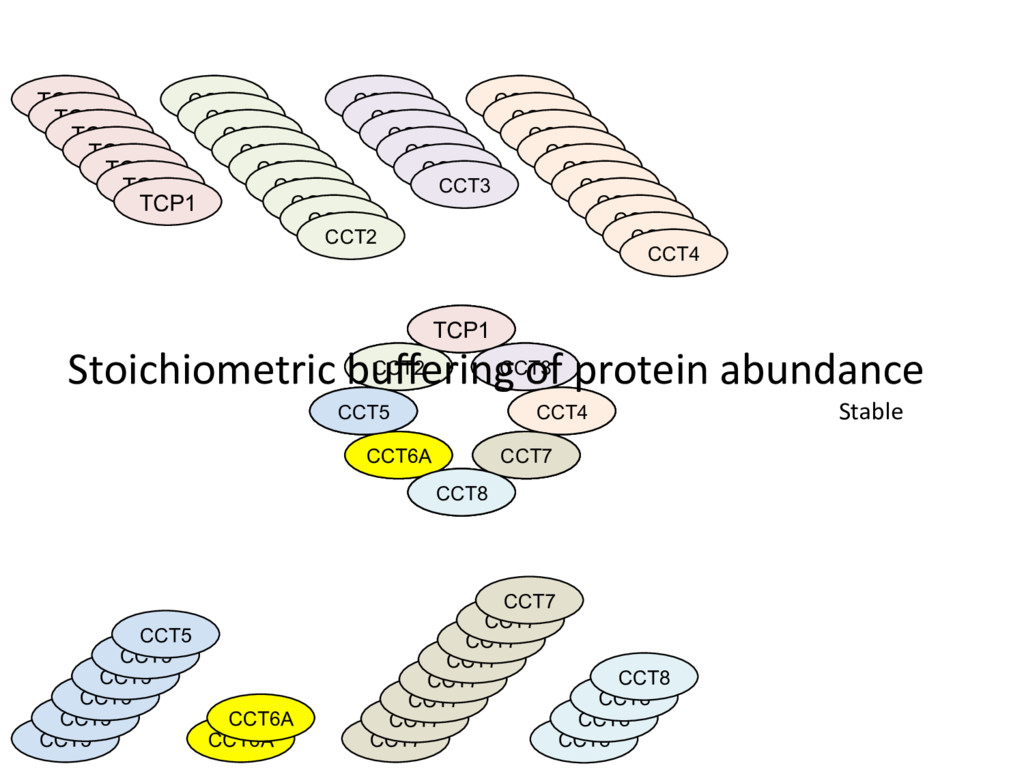
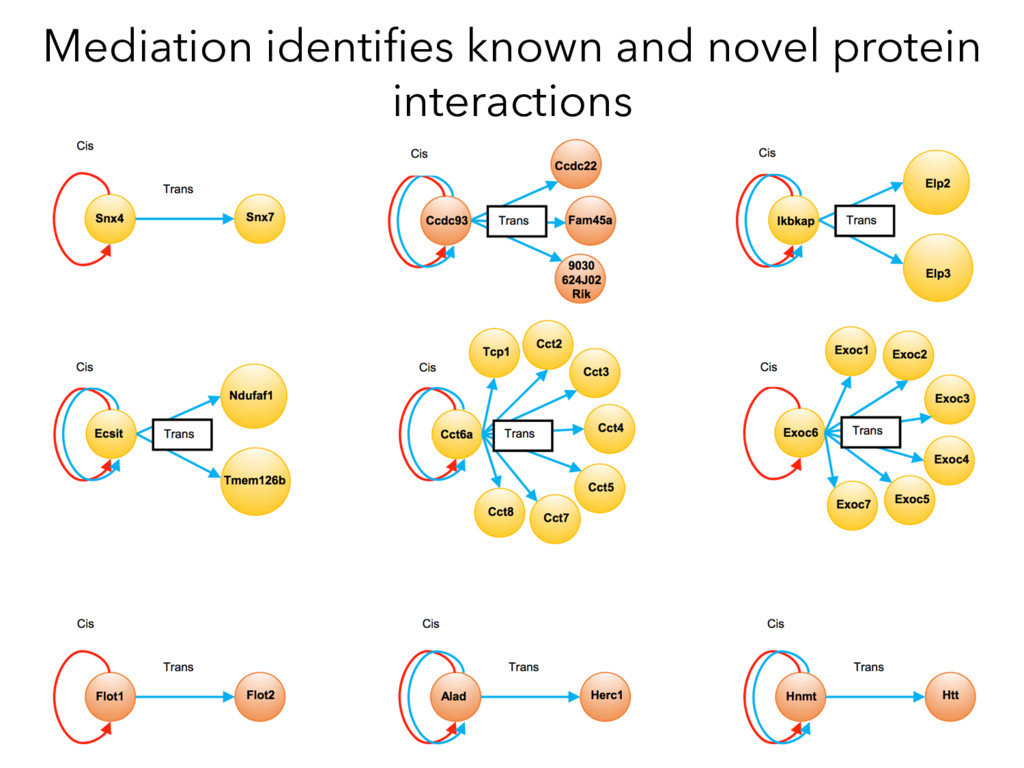
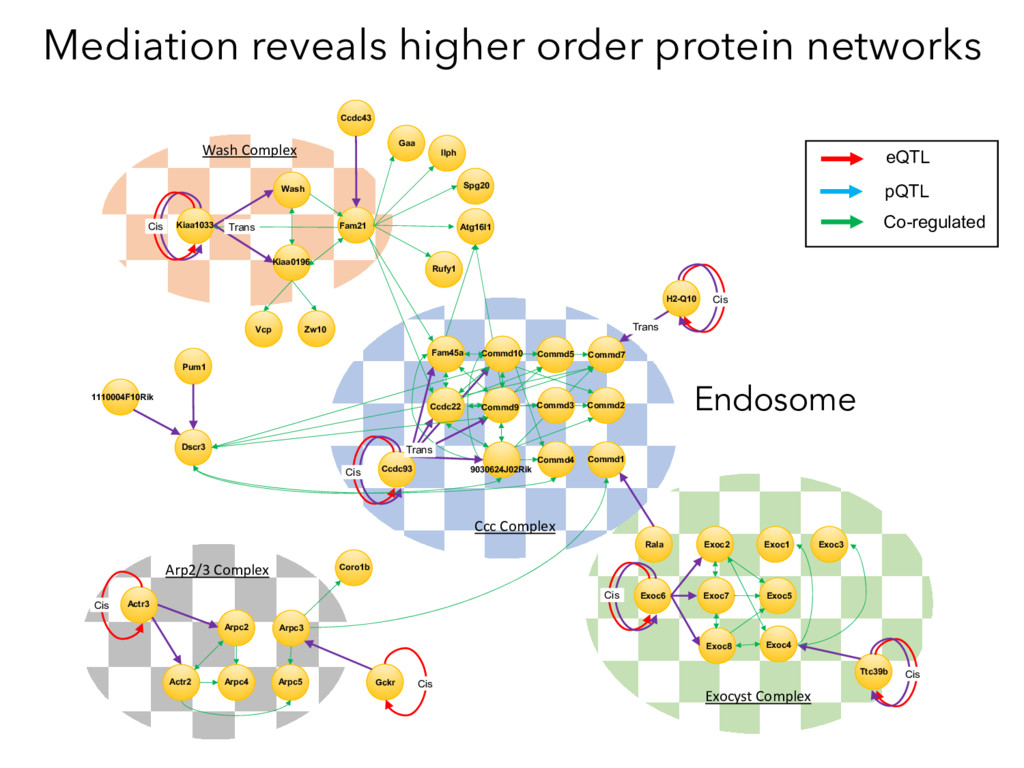
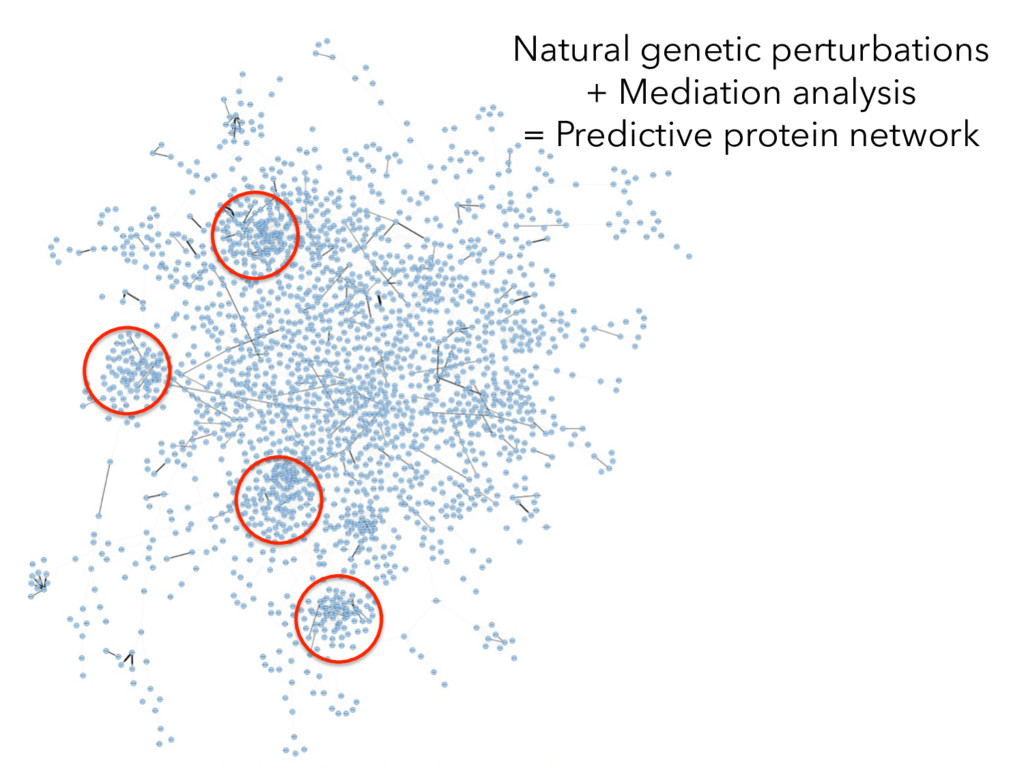
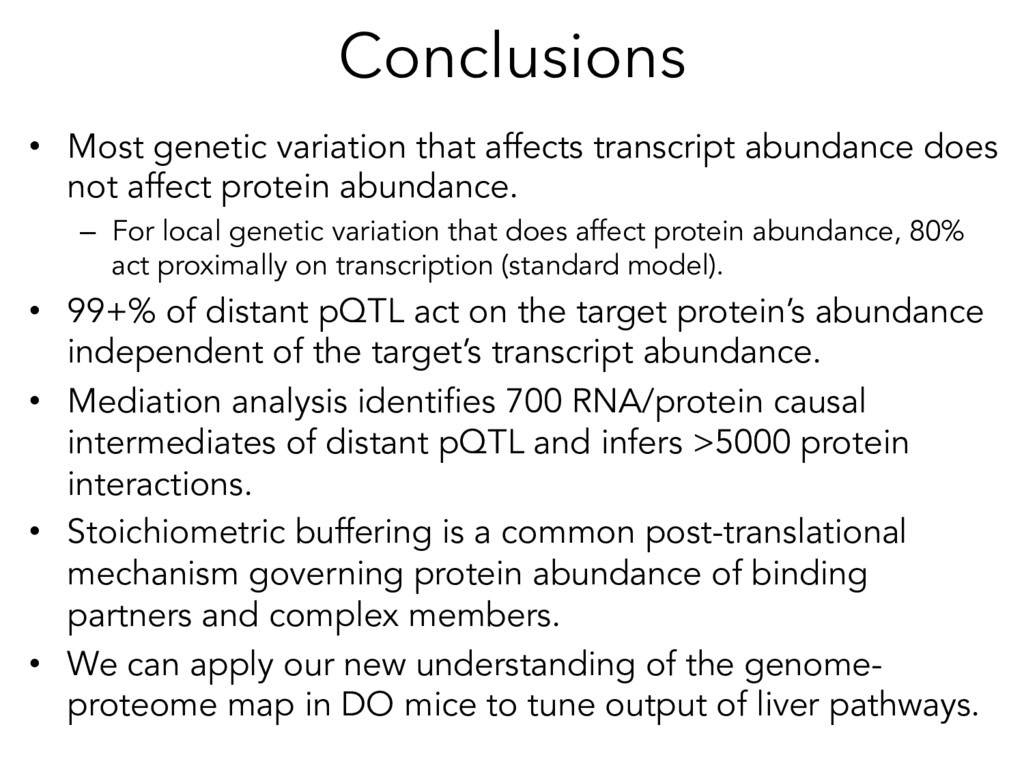
not affect protein abundance. – For local genetic variation that does affect protein abundance, 80% act proximally on transcription (standard model). • 99+% of distant pQTL act on the target protein’s abundance independent of the target’s transcript abundance. • Mediation analysis identifies 700 RNA/protein causal intermediates of distant pQTL and infers >5000 protein interactions. • Stoichiometric buffering is a common post-translational mechanism governing protein abundance of binding partners and complex members. • We can apply our new understanding of the genome- proteome map in DO mice to tune output of liver pathways.