Upgrade to Pro — share decks privately, control downloads, hide ads and more …

From Strategy to Outcomes

From Strategy to Outcomes

In this talk I expand upon ways to measure the movement of your users’ or segments of users interactions with digital software products, towards our vision, strategic objectives and product goals.

Noble Ackerson

February 11, 2022
Tweet

More Decks by Noble Ackerson

Other Decks in Business

Transcript

  1. @nobleackerson
    From Strategy to Outcomes
    The virtuous cycle of Product Strategy through measurable Product Outcomes
    Noble Ackerson, Director of Product,
    AI/ML Practice, Ventera Corporation

    View Slide

  2. @nobleackerson

    STRATEGY
    Contents
    What to look forward to
    1
    2
    3

    DATA, INFO, INSIGHTS

    OUTCOMES

    View Slide

  3. Your product strategy defines how
    your product achieves its goals and
    how that supports the business.
    It is visualized through a road map.

    View Slide

  4. @nobleackerson
    What are outcomes?

    View Slide

  5. 01
    Strategy
    1 2 3

    View Slide

  6. 6
    Roadmaps bind user behavior to your strategy
    Your Strategy:
    Outcomes based
    impacts
    Your outputs:
    Behavioral analytics
    bound to outcomes
    Vision
    Product Goal
    #1
    Product Goal
    #2

    View Slide

  7. @nobleackerson
    The connective tissue between strategy and outcomes
    Enabling rapid insights by enabling the
    team to focus on ONE key metric at a
    time depending on the stage and the
    current focus of the company.

    View Slide

  8. Measuring the outcomes towards your strategy in a nutshell
    8

    View Slide

  9. 02
    Data,
    Information,
    & Insights
    1 2 3

    View Slide

  10. Pre-processed raw statistics
    made up of words, characters,
    and numbers. 
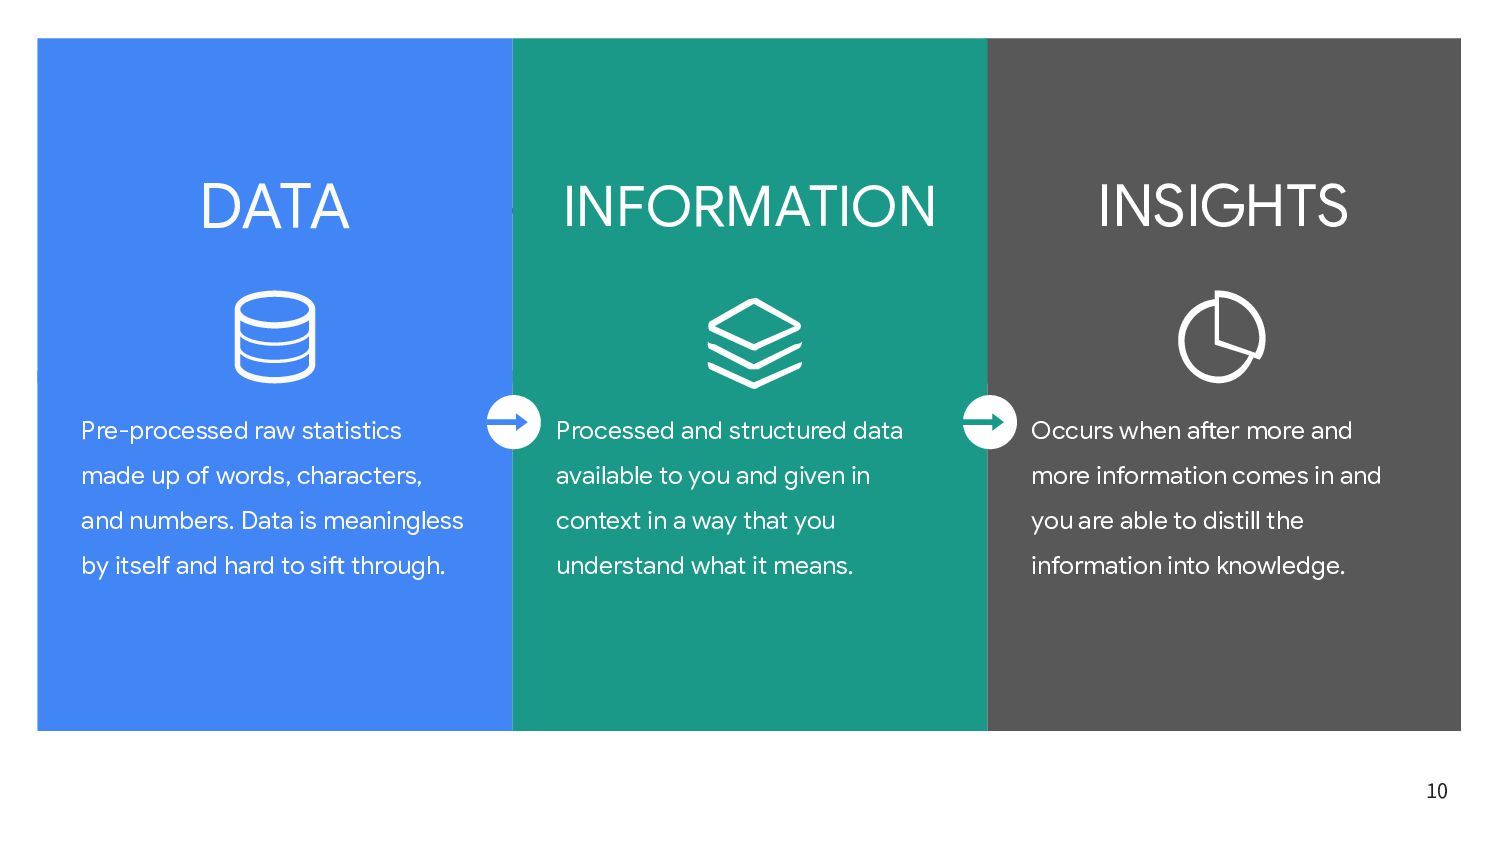
Data is meaningless
    by itself and hard to sift through.
    Processed and structured data
    available to you and given in
    context in a way that you
    understand what it means.
    Occurs when after more and
    more information comes in and
    you are able to distill the
    information into knowledge.
    INSIGHTS
    INFORMATION
    DATA
    10

    View Slide

  11. Case Study
    11

    View Slide

  12. Product Signals
    ❏ Abandonment rate
    ❏ Number of
    successful shares.
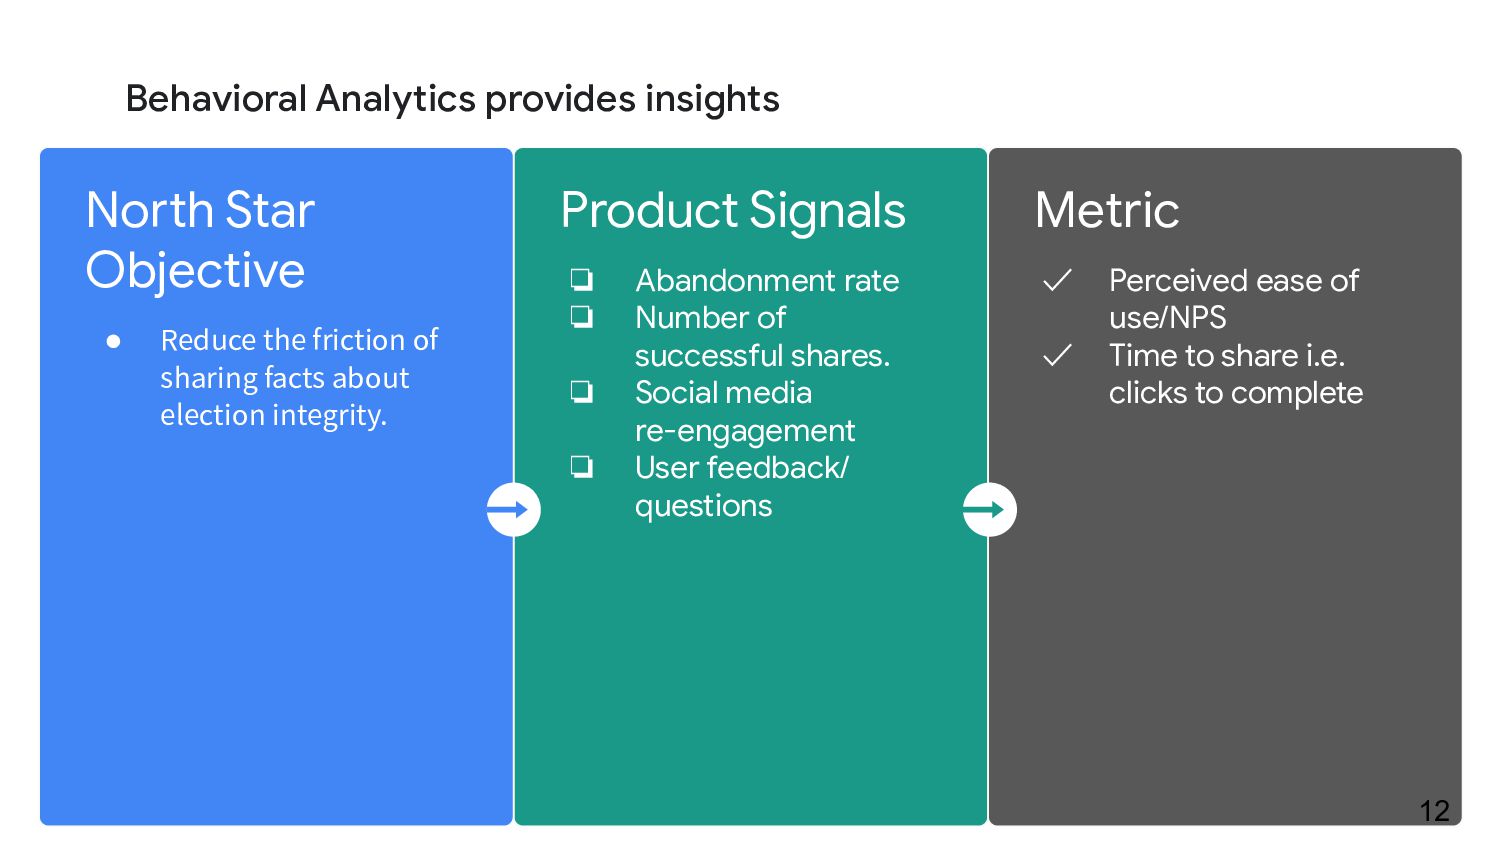
    ❏ Social media
    re-engagement
    ❏ User feedback/
    questions
    North Star
    Objective
    ● Reduce the friction of
    sharing facts about
    election integrity.
    Metric
    ✓ Perceived ease of
    use/NPS
    ✓ Time to share i.e.
    clicks to complete
    12
    Behavioral Analytics provides insights

    View Slide

  13. 13
    Vanity Metric
    # of page views
    Movement towards our
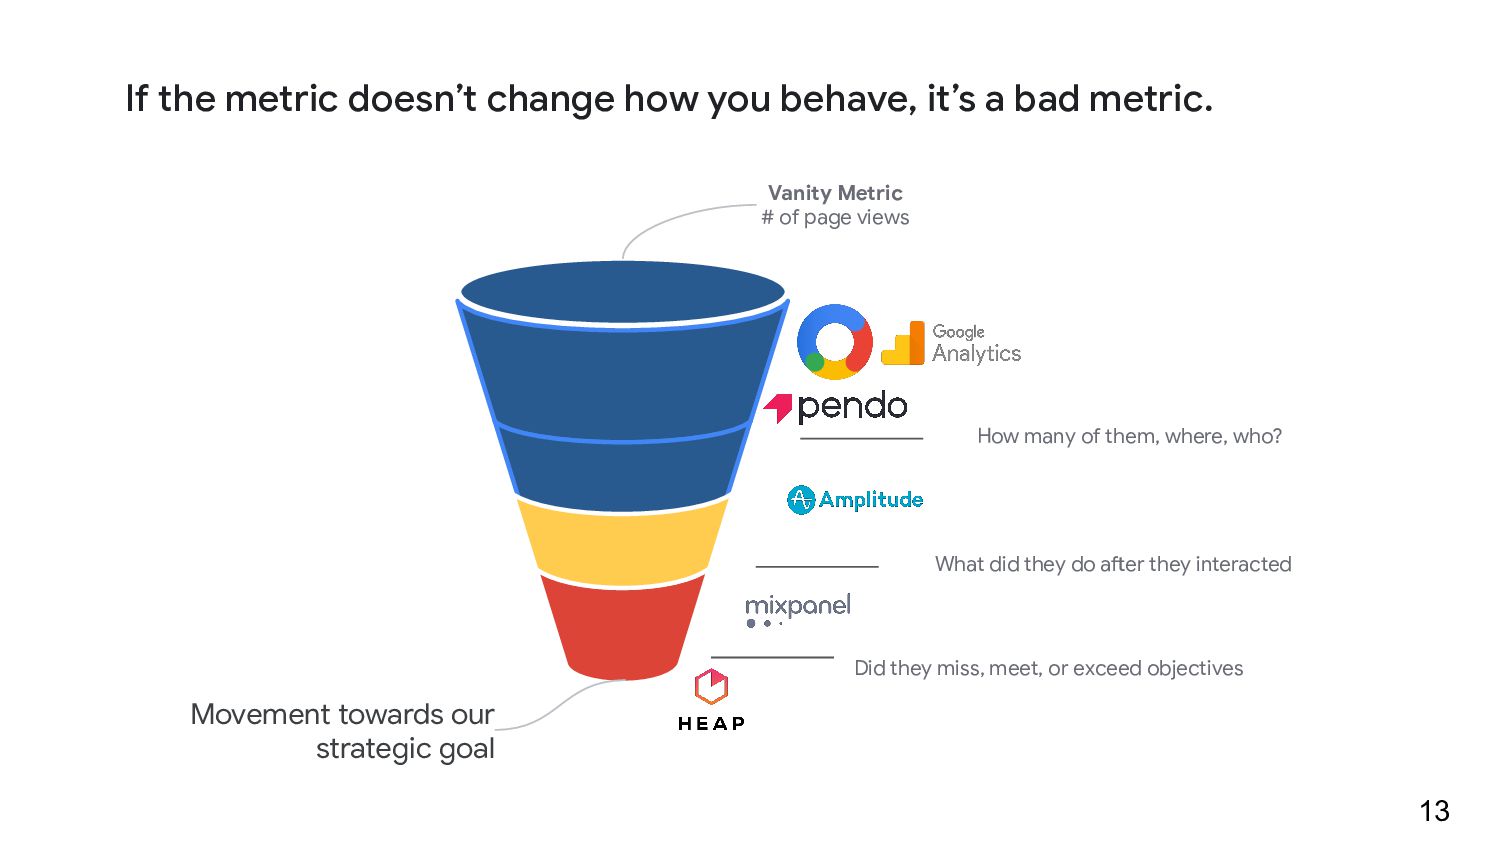
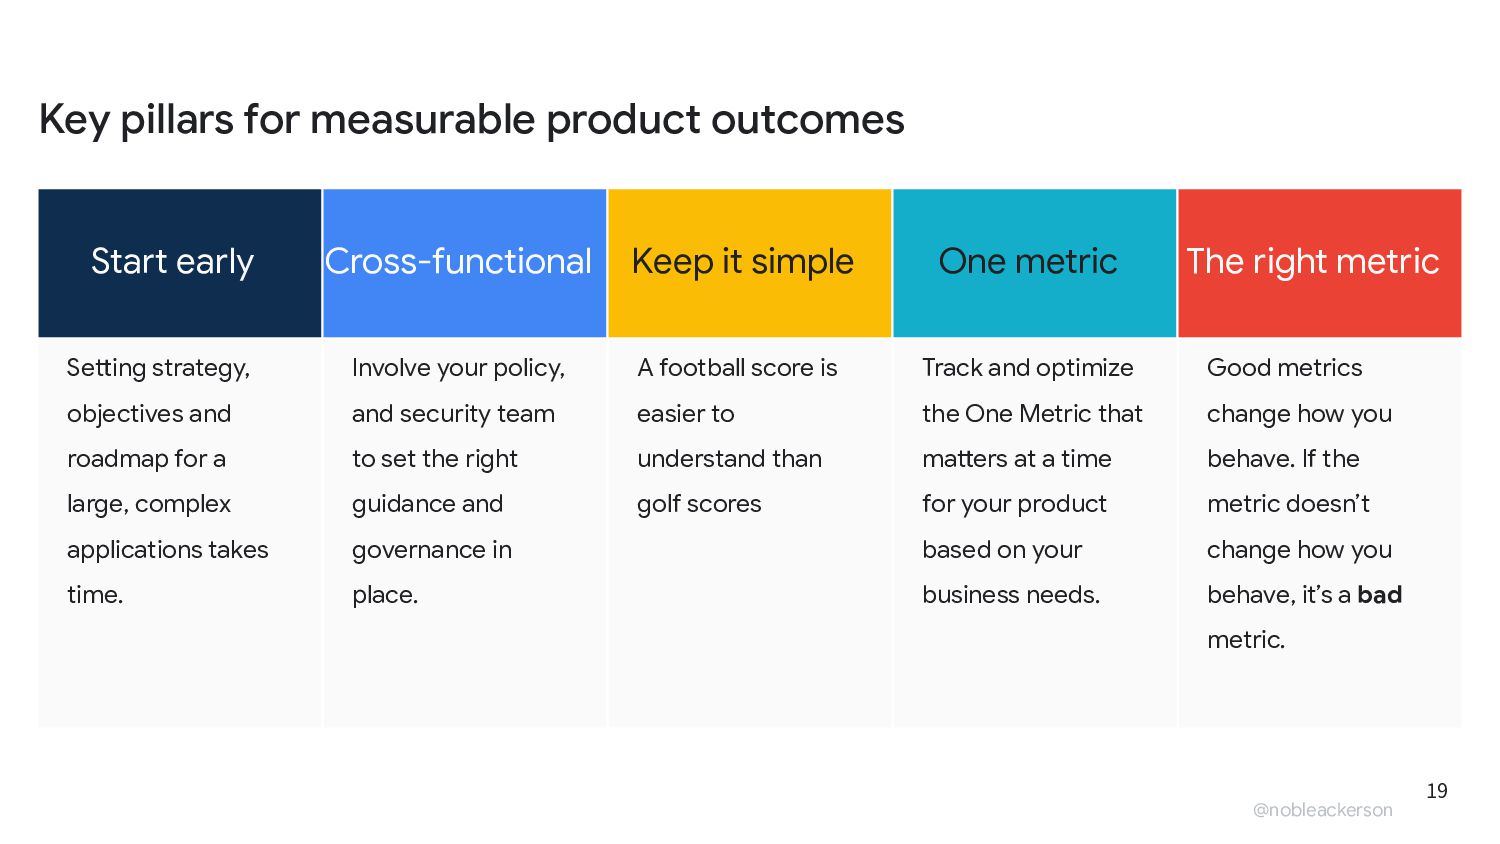
    strategic goal
    What did they do after they interacted
    Did they miss, meet, or exceed objectives
    How many of them, where, who?
    If the metric doesn’t change how you behave, it’s a bad metric.

    View Slide

  14. Set Strategy &
    Pick a KPI Map back to
    strategy
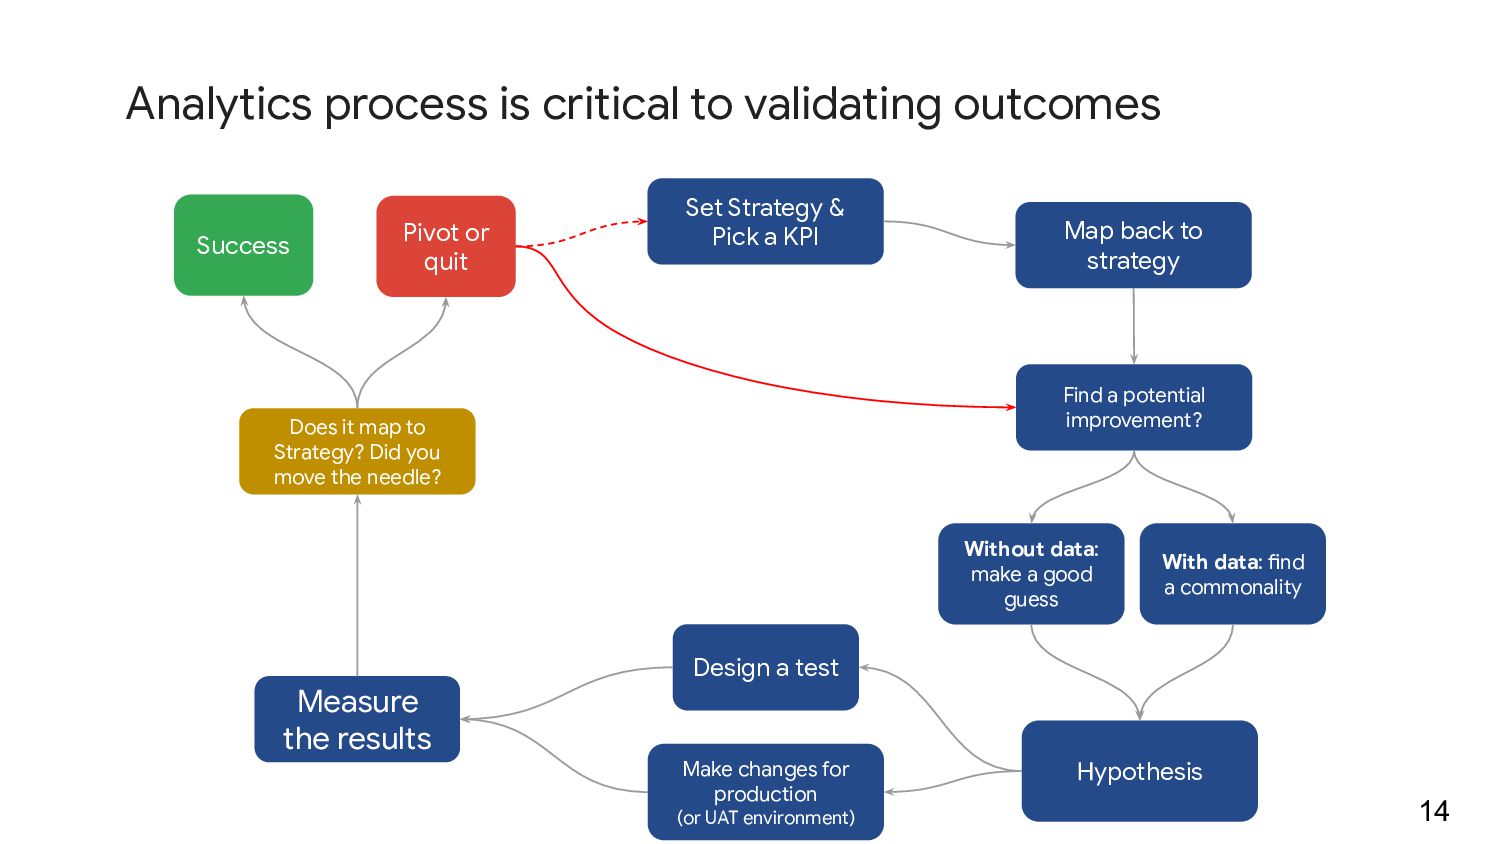
    Find a potential
    improvement?
    Without data:
    make a good
    guess
    With data: find
    a commonality
    Hypothesis
    Design a test
    Make changes for
    production
    (or UAT environment)
    Measure
    the results
    Does it map to
    Strategy? Did you
    move the needle?
    Pivot or
    quit
    Success
    Analytics process is critical to validating outcomes
    14

    View Slide

  15. What actually gets collected with these tools?
    15

    View Slide

  16. ● Simple to understand,
    ● comparative,
    ● a ratio or rate,
    ● compliments user feedback,
    ● ultimately behavior changing.
    16
    5 Principles to Make an Actionable Metric

    View Slide

  17. 03
    Outcomes
    1 2 3

    View Slide

  18. “Outcomes mean the direct
    and indirect end results that
    occur 
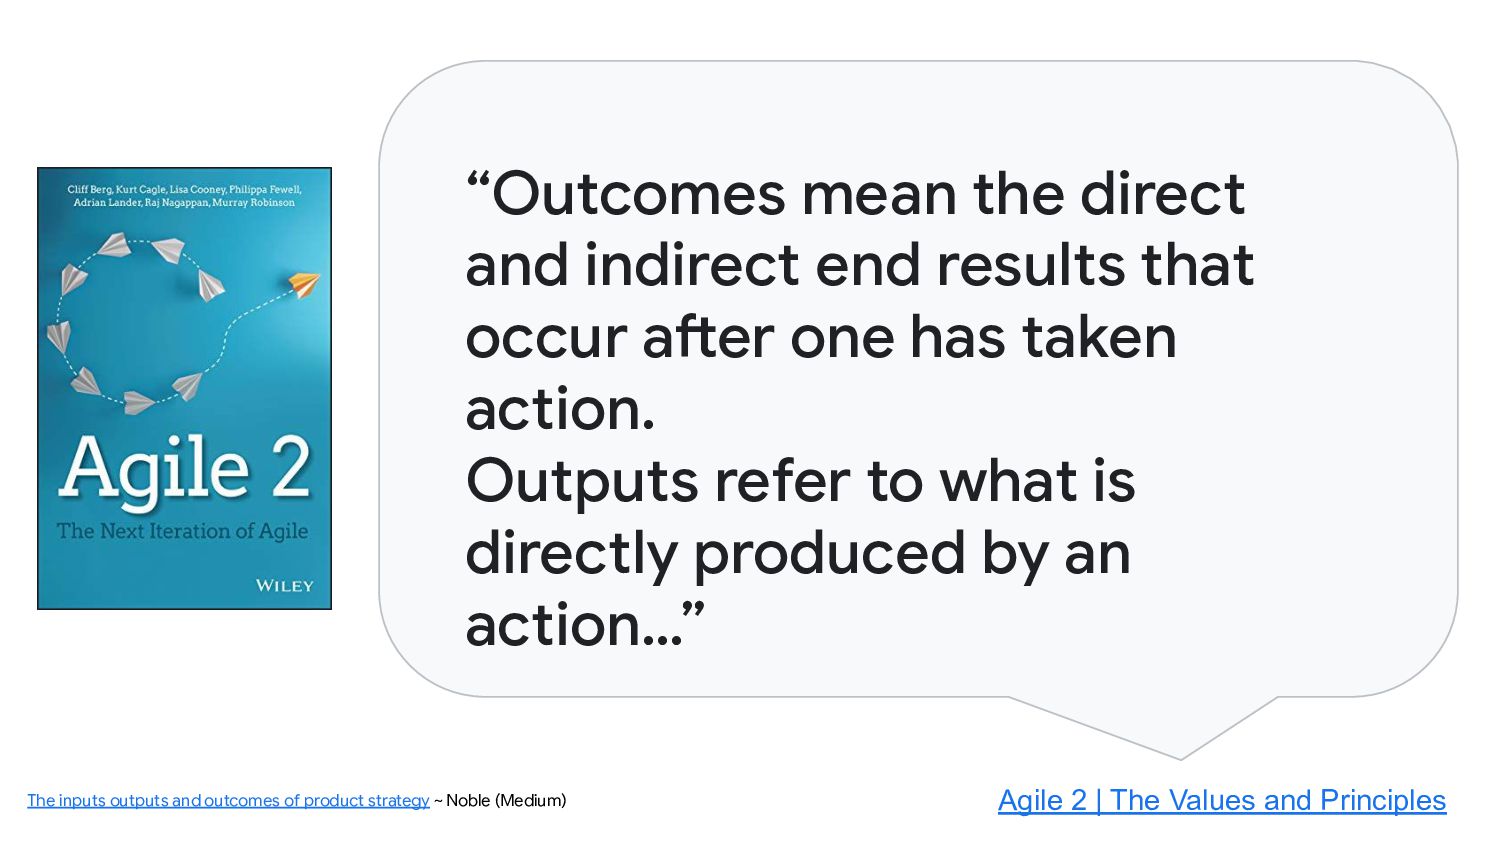
after one has taken
    action.
    Outputs refer to what is
    directly produced by an
    action…”
    Agile 2 | The Values and Principles
    The inputs outputs and outcomes of product strategy ~ Noble (Medium)

    View Slide

  19. @nobleackerson
    Good metrics
    change how you
    behave. If the
    metric 
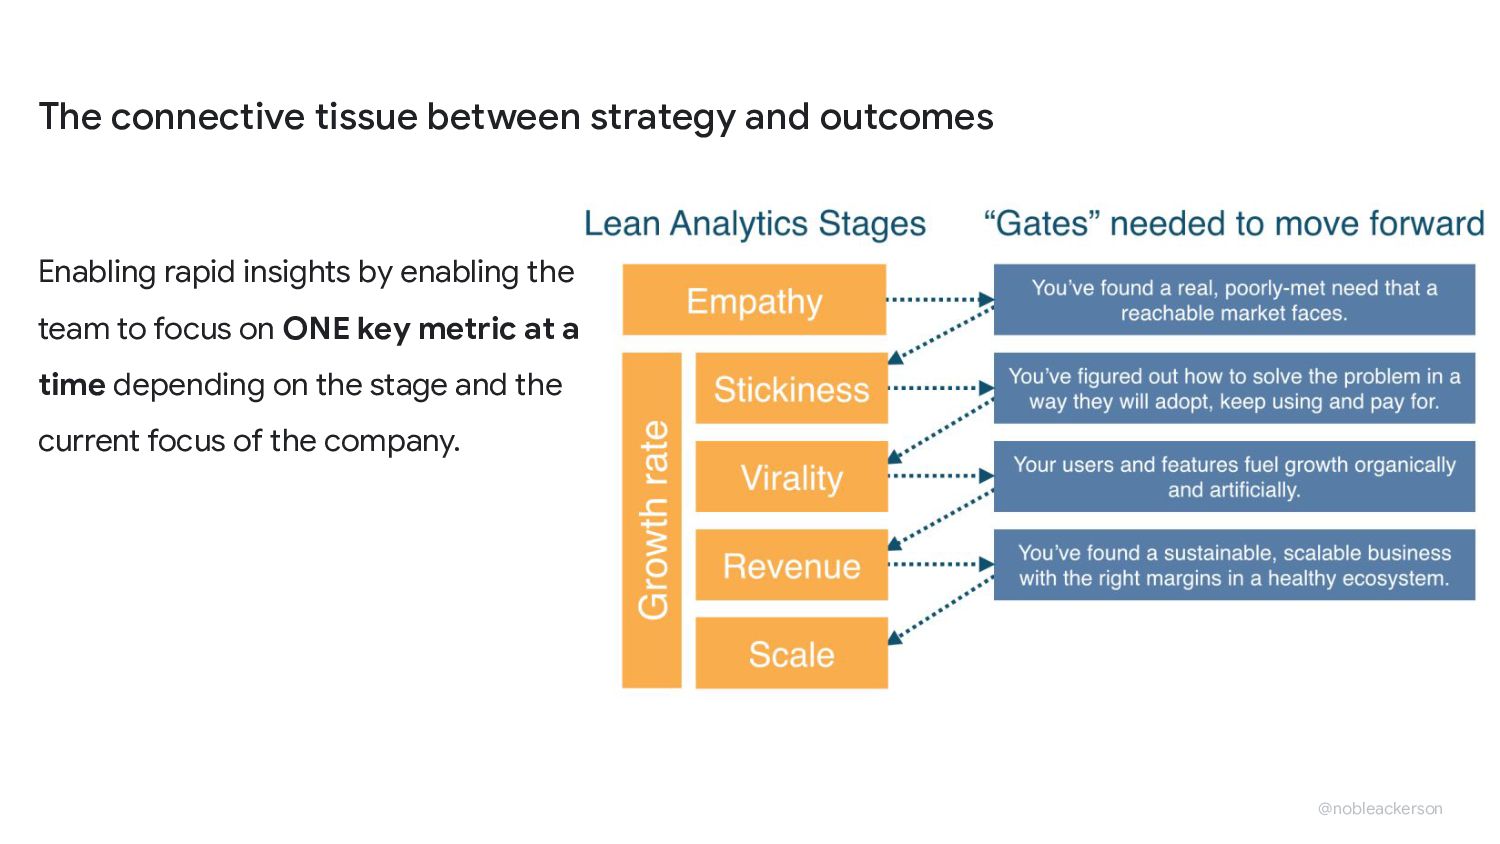
doesn’t
    change how you
    behave, it’s a bad
    metric.
    Track and optimize
    the One Metric that
    matters at a time
    for your product
    based on your
    business needs.
    A football score is
    easier to
    understand than
    golf scores
    Involve your policy,
    and security team
    to set the right
    guidance and
    governance in
    place.
    Setting strategy,
    objectives and
    roadmap for a
    large, complex
    applications takes
    time.
    Key pillars for measurable product outcomes
    19
    Lorem ipsum Lorem ipsum Lorem ipsum Lorem ipsum
    Start early Cross-functional Keep it simple One metric The right metric

    View Slide

  20. “Outputs without user insights will lead
    you to the same outcomes.
    Always seek insights”
    The inputs outputs and outcomes of product strategy ~ Noble (medium.com/@nobleackerson)

    View Slide

  21. @nobleackerson
    Thanks for listening!
    02/10/2022

    View Slide