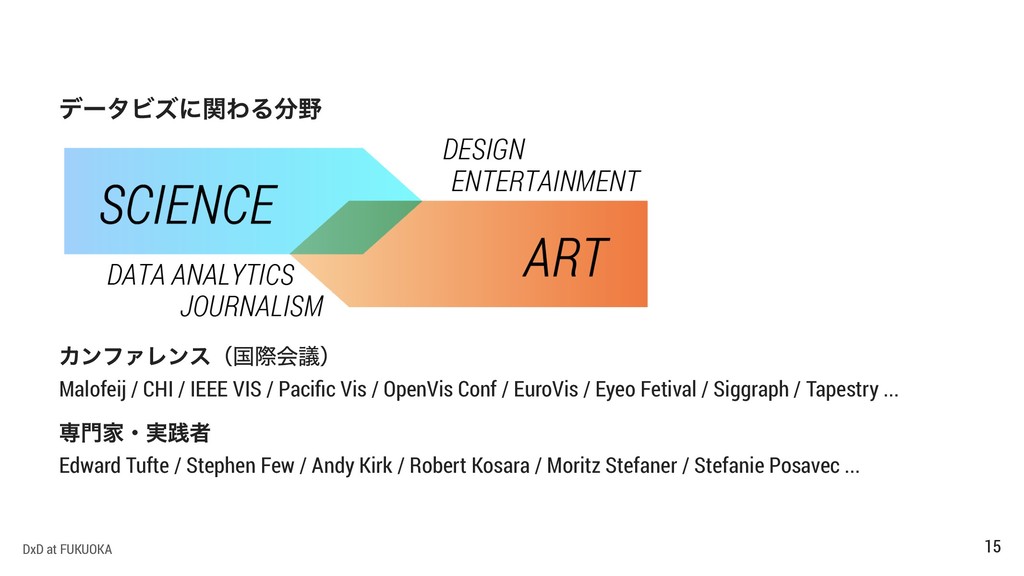
OpenVis Conf / EuroVis / Eyeo Fetival / Siggraph / Tapestry ... Edward Tufte / Stephen Few / Andy Kirk / Robert Kosara / Moritz Stefaner / Stefanie Posavec ... DxD at FUKUOKA 15
& Genest, Aaron & Mcdine, David & Brooks, Christopher. (2010). Useful Junk? The effects of visual embellishment on comprehension and memorability of charts. Conference on Human Factors in Computing Systems - Proceedings. 4. 2573-2582. 10.1145/1753326.1753716. DxD at FUKUOKA 41