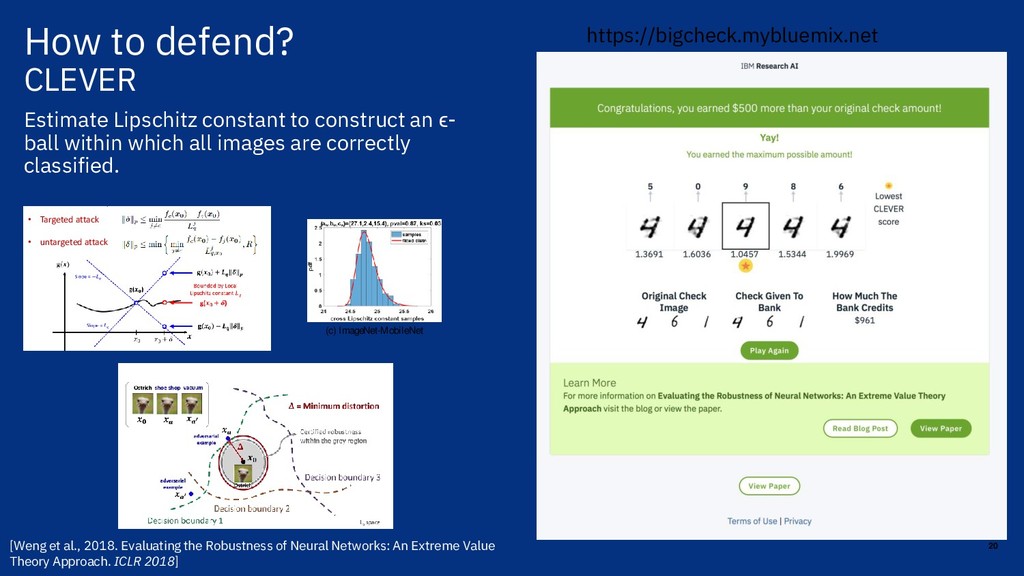
ϵ- ball within which all images are correctly classified. 20 https://bigcheck.mybluemix.net We fit the cross Lipschitz constant samples in S (see Algorithm 1) with reverse Weibull class dis- tribution to obtain the maximum likelihood estimate of the location parameter ˆ aW , scale parameter ˆ bW and shape parameter ˆ cW , as introduced in Theorem 4.1. To validate that reverse Weibull distri- bution isagood fit to theempirical distribution of thecross Lipschitz constant samples, weconduct Kolmogorov-Smirnov goodness-of-fit test (a.k.a. K-S test) to calculate the K-S test statistics D and corresponding p-values. Thenull hypothesis isthat samples S follow areverseWeibull distribution. Figure 2 plots the probability distribution function of the cross Lipschitz constant samples and the fitted Reverse Weibull distribution for images from various data sets and network architectures. The estimated MLE parameters, p-values, and the K-S test statistics D are also shown. We also calculate thepercentage of exampleswhoseestimation havep-valuesgreater than 0.05, asillustrated in Figure 3. If the p-value is greater than 0.05, the null hypothesis cannot be rejected, meaning that the underlying data samples fit a reverse Weibull distribution well. Figure 3 shows that all numbers are close to 100%, validating the use of reverse Weibull distribution as an underlying distribution of gradient norm samples empirically. Therefore, the fitted location parameter of reverse Weibull distribution (i.e., the extreme value), ˆ aW , can be used as a good estimation of local cross Lipschitz constant to calculate theCLEVER score. Theexact numbers areshown in Table 5 in Appendix E. (a) CIFAR-MLP (b) MNIST-CNN (c) ImageNet-MobileNet Figure2: ThecrossLipschitz constant samplesfor threeimagesfrom CIFAR, MNIST and ImageNet datasets, and their fitted Reverse Weibull distributions with the corresponding MLE estimates of location, scale and shape parameters (aW , bW , cW ) shown on the top of each plot. The D-statistics of K-Stest and p-valuesaredenoted asksand pval. With small ksand high p-value, thehypothesized reverse Weibull distribution fits the empirical distribution of cross Lipschitz constant samples well. 80 85 90 95 100 percentage (%) MobileNet Resnet Inception CIFAR-BReLU CIFAR-DD CIFAR-CNN CIFAR-MLP MNIST-BReLU MNIST-DD MNIST-CNN MNIST-MLP p = 1 p = 2 (a) Least likely target 80 85 90 95 100 percentage (%) MobileNet Resnet Inception CIFAR-BReLU CIFAR-DD CIFAR-CNN CIFAR-MLP MNIST-BReLU MNIST-DD MNIST-CNN MNIST-MLP p = 1 p = 2 (b) Random target 80 85 90 95 100 percentage (%) MobileNet Resnet Inception CIFAR-BReLU CIFAR-DD CIFAR-CNN CIFAR-MLP MNIST-BReLU MNIST-DD MNIST-CNN MNIST-MLP p = 1 p = 2 (c) Top 2 target Proposal Highlights & Preliminary Results Abstract: Although neural networks are becoming the core engine for driving Artificial Intelligence (AI) research and technology at an unprecedented speed, recent studies have highlighted their lack of model robustness to adversarial attacks, giving rise to new safety/security challenges in both the digital space and the physical world. In order to address the emerging AI-security issue, this proposal aims to provide a certified robustness evaluation framework that jointly takes into consideration an arbitrary neural network model and its underlying datasets. Specifically, we aim at developing an attack-agnostic robustness metric to evaluate the robustness of neural network classifiers. We further aim at providing efficient data-driven schemes to improve model robustness by pinpointing exemplary anchor points inferred from the underlying datasets. Introduction Neural network classifiers are easily fooled by adversarial perturbations Visual illustration of adversarial examples crafted by adversarial attack algorithms in [2]. The original example (a) is an ostrich image selected from the ImageNet dataset. The adversarial examples in (b) are classified as the target class labels (safe, shoe shop and vacuum respectively) by the Inception-v3 model Motivations How do we evaluate the robustness of a neural network? • Upper bounds: Current robustness measure of neural network models are mostly dependent on attack methods e.g. distortions found by FGSM, I-FGSM, DeepFool, C&W attacks, etc. • Lower bounds: Theoretical robustness guarantees are limited Our goal: Devise attack-agnostic robustness metric for neural networks We proved that the robustness of a network is related to its local Lipschitz constant, which can be evaluated numerically via extreme value theory. Our approach [1]: • Targeted attack • untargeted attack Our approach – Cross Lipschitz Extreme Value for nEtwork Robustness (more results in [1]): [3, Hein] [4, Bastani] MNIST: least likely target CIFAR: least likely target ImageNet: least likely target Comparison of L-inf distortion l (
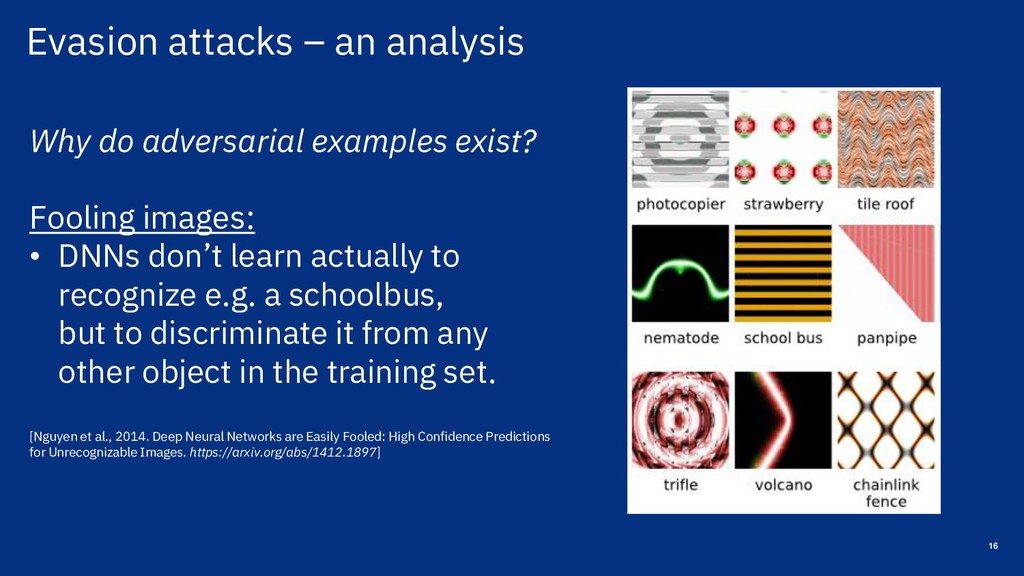
[email protected]), Lily Weng (
[email protected]), Pin-Yu Chen (Pin- models are mostly dependent on attack methods e.g. distortions found by FGSM, I-FGSM, DeepFool, C&W attacks, etc. • Lower bounds: Theoretical robustness guarantees are limited We proved that the robustness of a network is related to its local Lipschitz constant, which can be evaluated numerically via extreme value theory. Our approach [1]: • Targeted attack • untargeted attack Etwork Robustness (more results in [1]): of Neural Networks: An Extreme Value Theory Approach,“ ICLR 2018 s of a classifier against adversarial manipulation,“ NIPS 2017 s,“ NIPS 2016 [3, Hein] [4, Bastani] ia adversarial examples,“ AAAI 2018 likely target ImageNet: least likely target Comparison of the CLEVER score calculated with {50,100,250,500} samples and the L2 distortion by CW attack on ImageNet models nal of Global Optimization, 1996 [Weng et al., 2018. Evaluating the Robustness of Neural Networks: An Extreme Value Theory Approach. ICLR 2018]