Institute for Environmental Analytics: How Data Drives Environmental Decisions
This presentation is by Jon Blower, CTO at the Institute for Environmental Analytics. It supported his talk at Swirrl's 2016 data conference 'Data-Driven Decisions'.
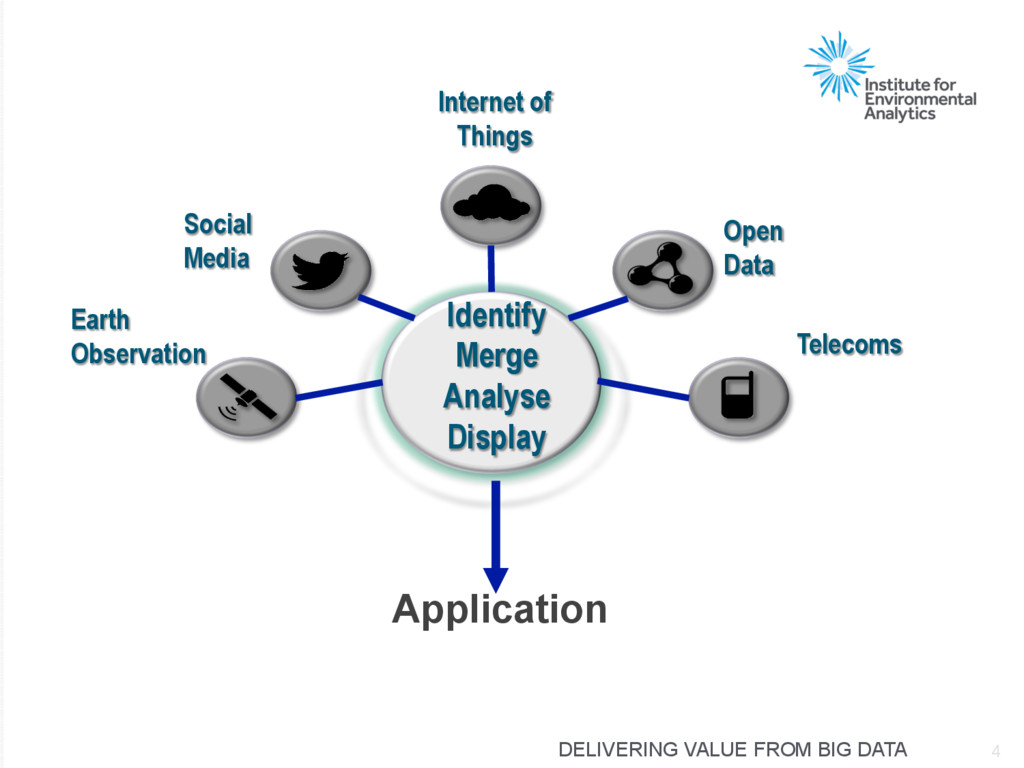
ENVIRONMENTAL ANALYTICS? • Established mid-2015 with c.£6m start-up funding from HEFCE • Aim to be a leading worldwide centre of excellence for big data analytics focussed on environmental challenges. • Expert team with knowledge of data science, algorithm development, software engineering and data visualisation. • Growing partnership with diverse expertise (science, technology, remote sensing, supercomputing, ...) • Focus on development of pre-commercial big data technology applications with industry and public sector • Helping users to make decisions using environmental data • We work with all kinds of environmental data, not just satellite data
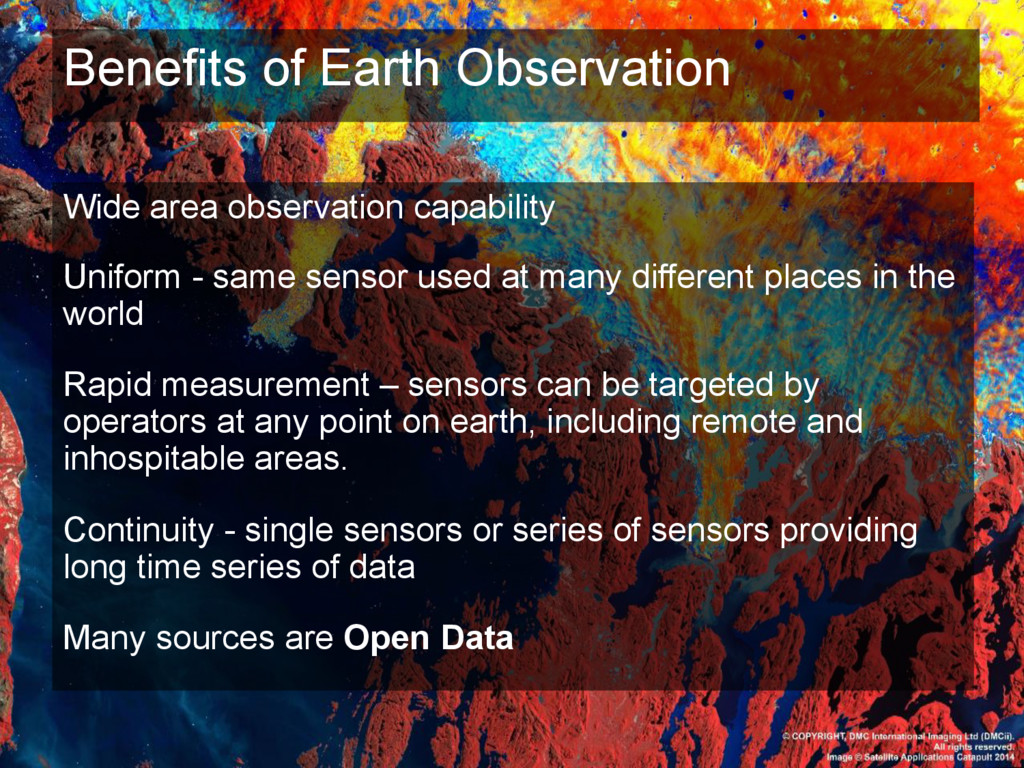
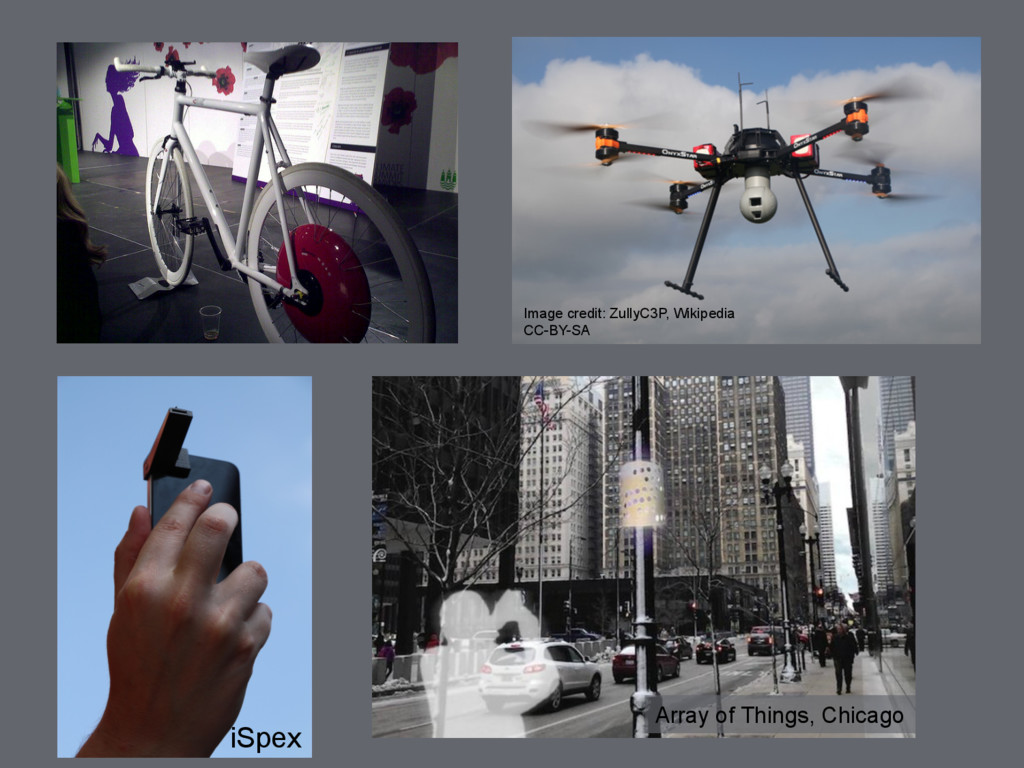
same sensor used at many different places in the world Rapid measurement – sensors can be targeted by operators at any point on earth, including remote and inhospitable areas. Continuity - single sensors or series of sensors providing long time series of data Many sources are Open Data
land use S2-A launched 23 June 2015, • 13 Bands (VIR, NIR, SWIR, red edge), • 290km swath, • 10-20-60m resolution, • 10d revisit. Image of Pavia acquired on 27 June 2015 at 10:25 UTC, Credit: Copernicus data (2015) / ESA 11
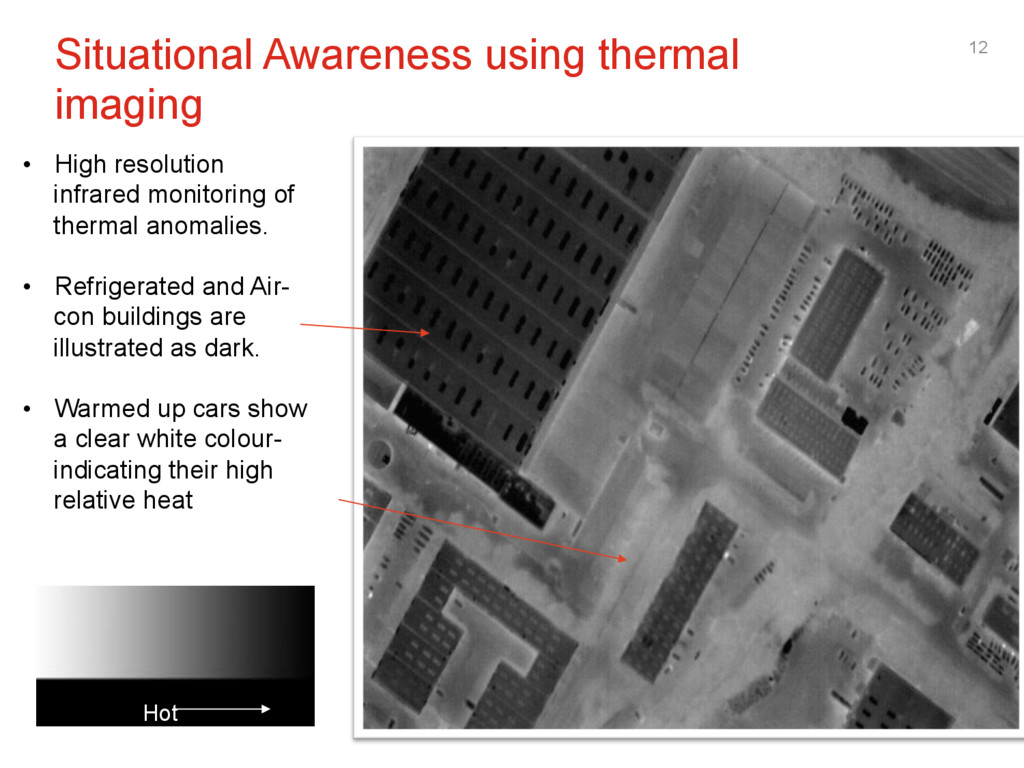
monitoring of thermal anomalies. • Refrigerated and Air- con buildings are illustrated as dark. • Warmed up cars show a clear white colour- indicating their high relative heat Hot Cold
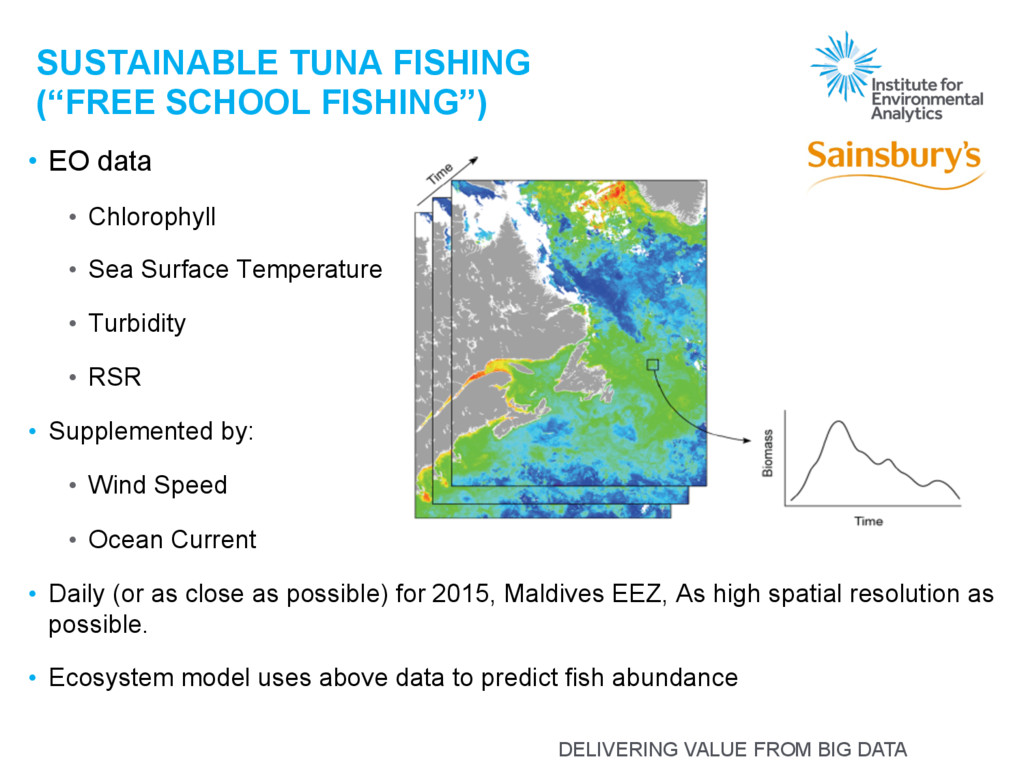
FISHING”) • EO data • Chlorophyll • Sea Surface Temperature • Turbidity • RSR • Supplemented by: • Wind Speed • Ocean Current • Daily (or as close as possible) for 2015, Maldives EEZ, As high spatial resolution as possible. • Ecosystem model uses above data to predict fish abundance
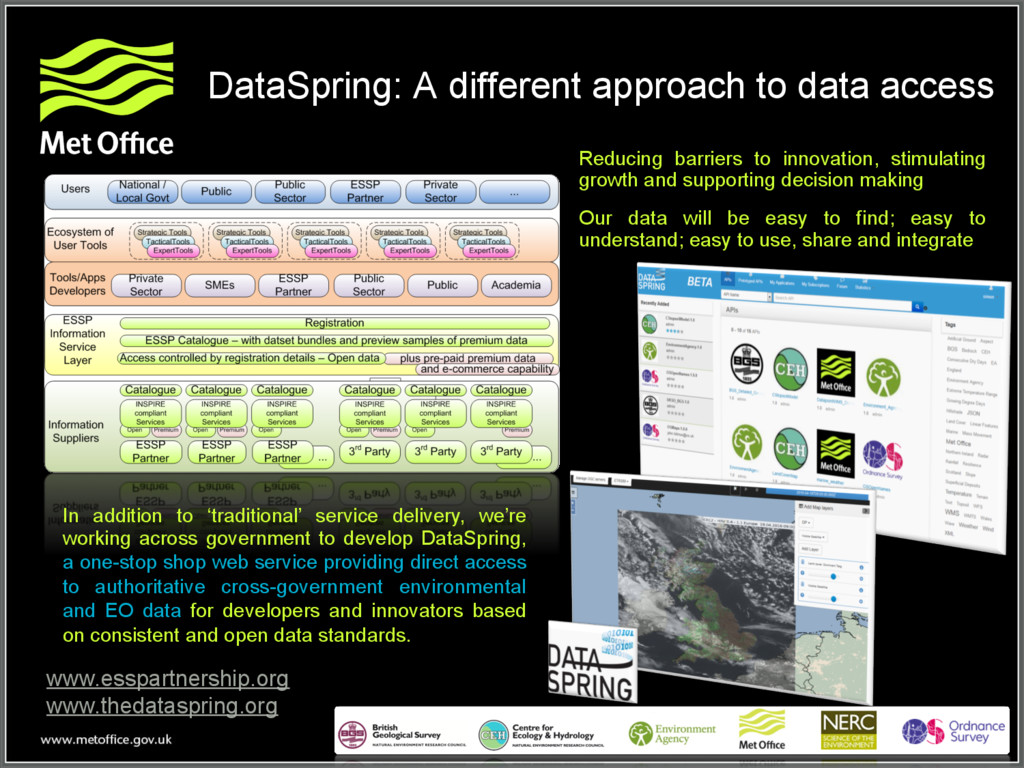
addition to ‘traditional’ service delivery, we’re working across government to develop DataSpring, a one-stop shop web service providing direct access to authoritative cross-government environmental and EO data for developers and innovators based on consistent and open data standards. Reducing barriers to innovation, stimulating growth and supporting decision making Our data will be easy to find; easy to understand; easy to use, share and integrate
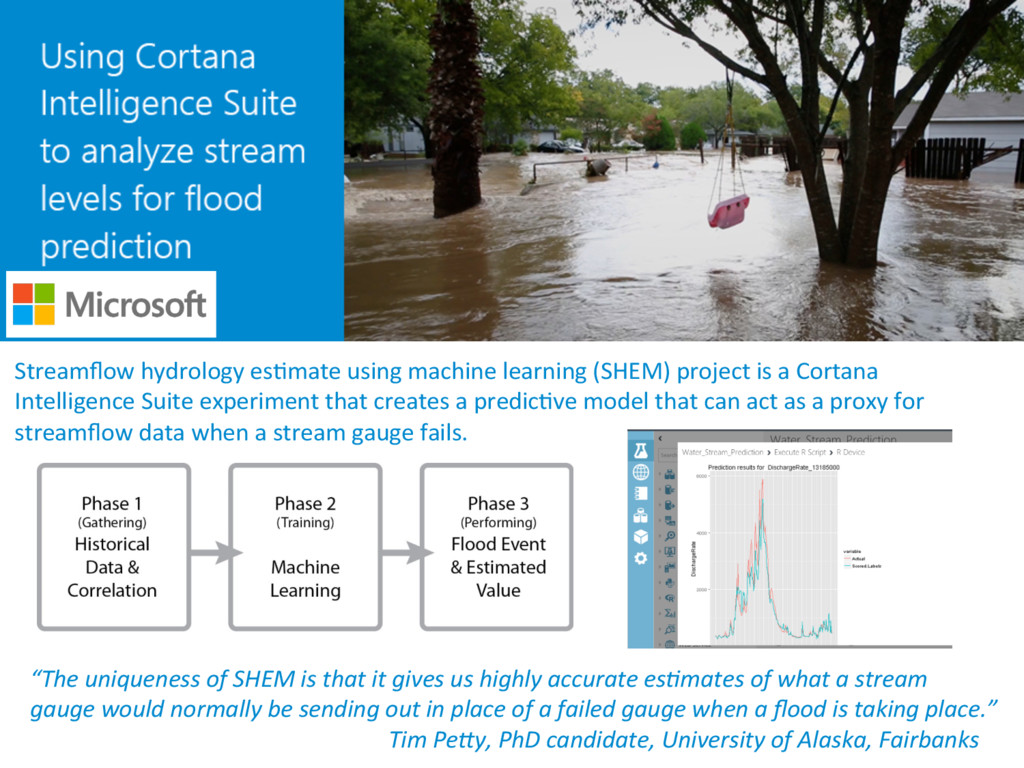
accurate es9mates of what a stream gauge would normally be sending out in place of a failed gauge when a flood is taking place.” Tim PeDy, PhD candidate, University of Alaska, Fairbanks Streamflow hydrology es)mate using machine learning (SHEM) project is a Cortana Intelligence Suite experiment that creates a predic)ve model that can act as a proxy for streamflow data when a stream gauge fails.
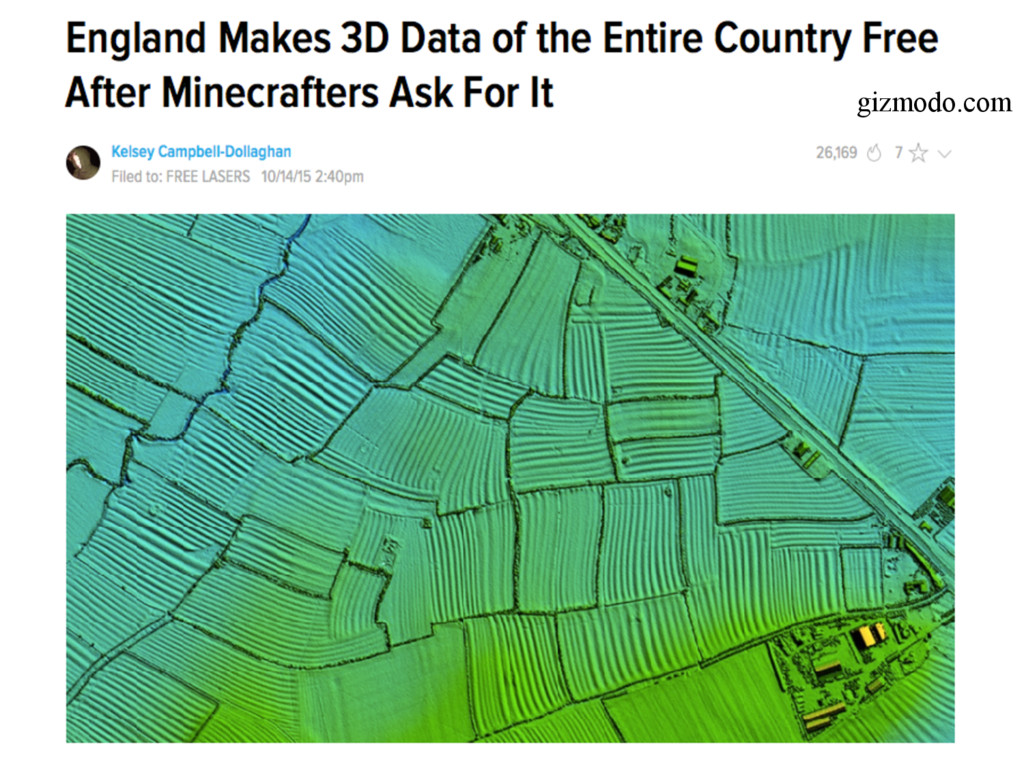
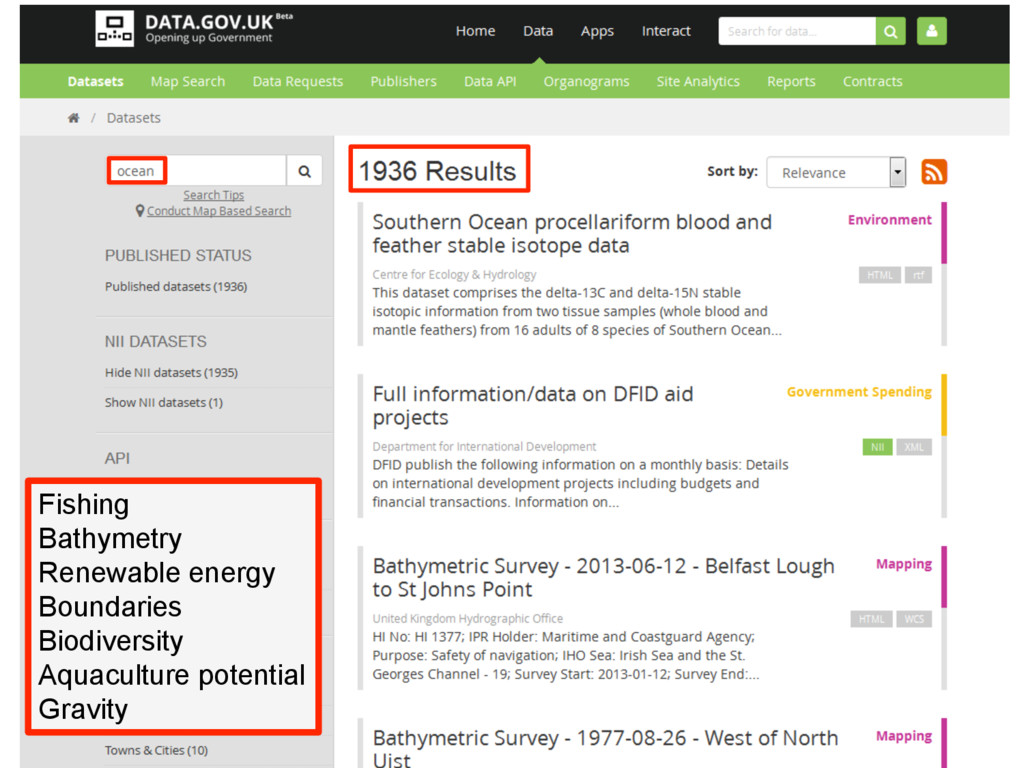
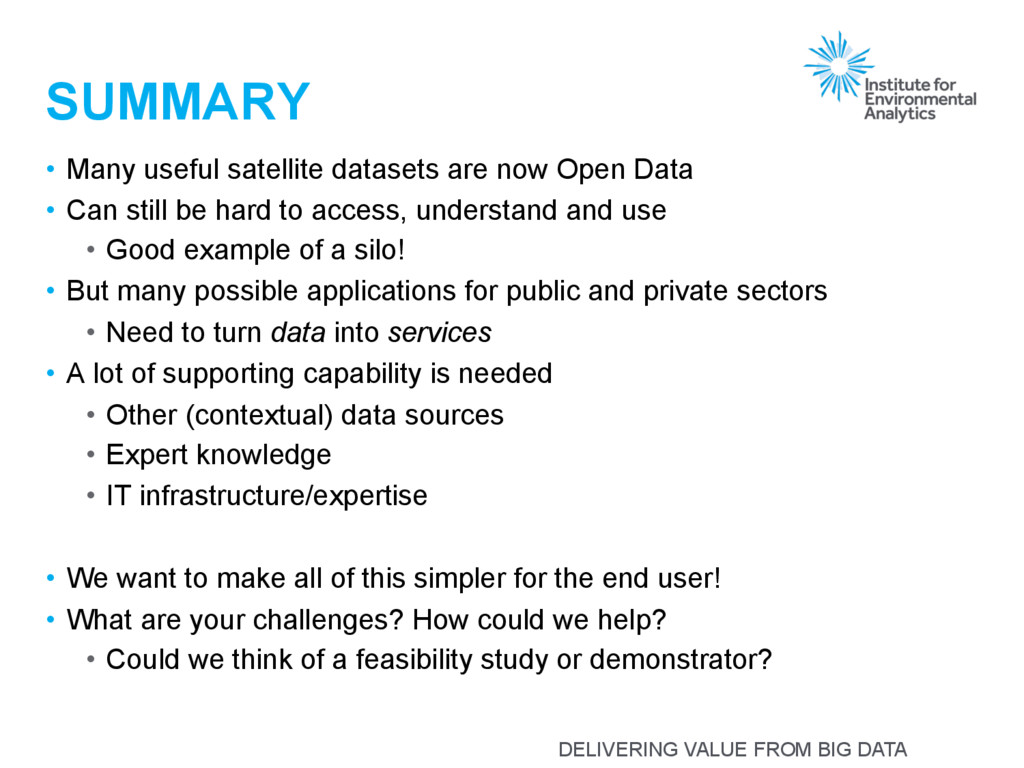
datasets are now Open Data • Can still be hard to access, understand and use • Good example of a silo! • But many possible applications for public and private sectors • Need to turn data into services • A lot of supporting capability is needed • Other (contextual) data sources • Expert knowledge • IT infrastructure/expertise • We want to make all of this simpler for the end user! • What are your challenges? How could we help? • Could we think of a feasibility study or demonstrator?
is a unique flagship centre, formed in January 2015 with £5.6m from the HEFCE Catalyst Fund and coordinated by the University of Reading. [email protected] @Jon_Blower