Upgrade to Pro — share decks privately, control downloads, hide ads and more …

The Impact of Automation at Scale

The Impact of Automation at Scale

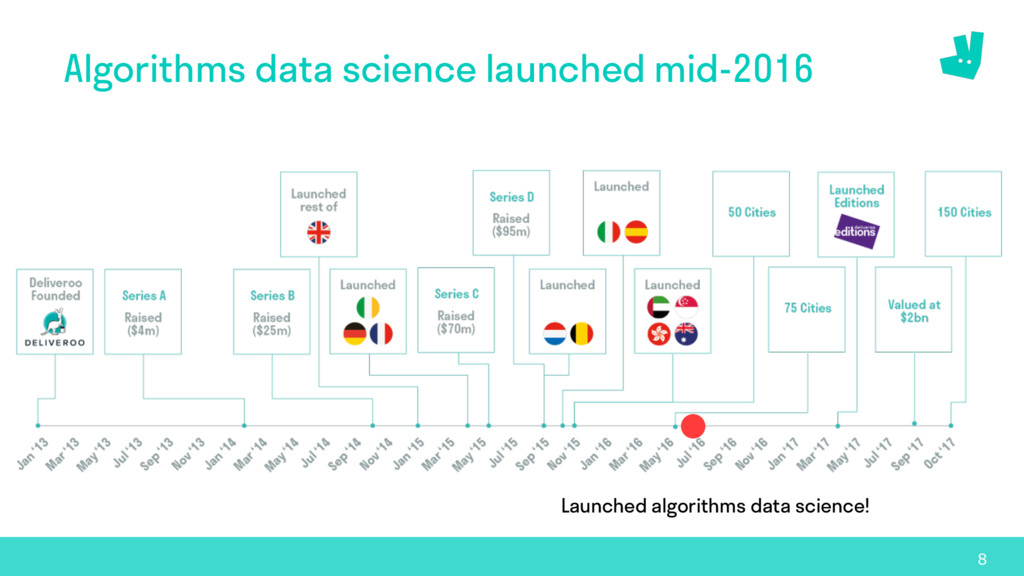
Deliveroo presents a rare glimpse at the impact of automation, because it reached international scale before automating much of its core delivery processes.

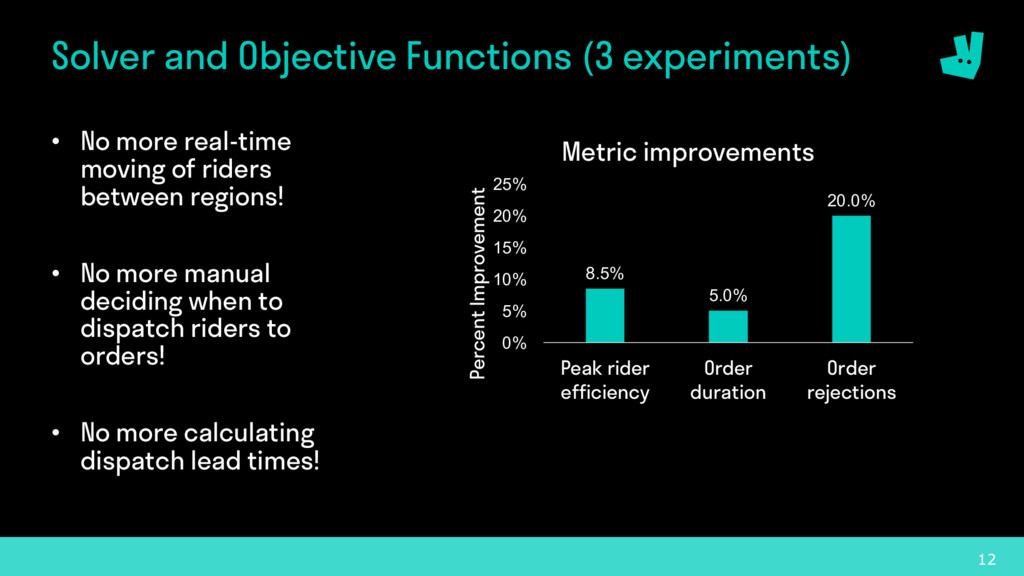
Automating dispatch and delivery rider booking machinery continues to have massive, experimentally measurable impact.

This journey highlights the power of incrementalism, because replacing elaborate, regionally specific, manual processes with simple, central, automatic processes is incredibly successful.

techsessions

December 07, 2017
Tweet

More Decks by techsessions

Other Decks in Technology

Transcript

  1. The Impact of Automation at Scale Mike Todd Chief Scientist,

    Deliveroo December, 2017 Mike Todd Chief Scientist
  2. 4 …THEN THINGS WENT ONLINE… WAVE I Offline WAVE II

    Online Marketplace (no logistics)
  3. 5 DELIVEROO AND THE BIRTH OF WAVE III WAVE I

    Offline WAVE II Online Marketplace (no logistics) WAVE III Logistics-Enabled Marketplace
  4. 7 One of the most common types of advice we

    give at Y Combinator is to do things that don’t scale. -Paul Graham
  5. 9 Algorithms Data Science is a specialized role • Specialization

    • Build production automation with ML & optimization • No data engineering • No ad hoc analytics • Embedded on product teams • Work flow • Develop hypotheses about, design, and prototype algorithms • Productionize model re-training pipelines • Help engineers to productionize live model and algorithm code • Run and analyze algorithm experiment
  6. 10 Core logistics were manual in May, 2016 • Calculations

    • Travel time parameter estimation • Food preparation time estimation • Dispatch lead time estimation • How many riders to get on the road • Real-time decisions • Delivery delay time estimation • When to dispatch riders for each order • When to close portions of the delivery network due to rider undersupply • When to move riders from one delivery region to another
  7. 12 Solver and Objective Functions (3 experiments) • No more

    real-time moving of riders between regions! • No more manual deciding when to dispatch riders to orders! • No more calculating dispatch lead times! 8.5% 5.0% 20.0% 0% 5% 10% 15% 20% 25% Peak rider efficiency Order duration Order rejections Percent Improvement Metric improvements
  8. 13 Travel and Delay Models (3 experiments) • No more

    manual calculation of velocity parameters! • No more manual, real- time decisions about delay!! 22.8% 27.9% 0% 5% 10% 15% 20% 25% 30% Delivery time error Late orders Percent improvement Metric improvements
  9. 14 Food preparation time model (3 experiments) • No more

    manual calculation of prep time estimates! 27.4% 14.3% 1.3% 0% 5% 10% 15% 20% 25% 30% Food prep estimate Order duration Peak rider efficiency Percent Improvement Metric improvements
  10. 15 Load management (3 experiments) • No more manual, real-

    time decisions about rider supply! 20.0% 1.2% 3.3% 0% 5% 10% 15% 20% 25% Delivery availability Order duration Late orders Percent Improvement Metric improvements
  11. 16 Where we’re going next • More low hanging fruit

    in core logistics! • Supply forecasting and planning • Personalized recommendations • Delivery network anomaly detection
  12. 17 Essential “before and after” snapshot 0 Rider arrival at

    restaurant vs food prep estimate Order volume
  13. 19 Experiment design Monday Tuesday Wednesday Thursday Friday Saturday Sunday

    Monday Tuesday Wednesday Thursday Friday Saturday Sunday A B A B A B A B A B A B A B
  14. 20 Focus on Frank, core logistics algorithm • Calculations •

    Travel time parameter estimation • Food preparation time estimation • Dispatch lead time estimation • How many riders to get on the road • Real-time decisions • Delivery delay time estimation • When to dispatch riders for each order • When to close portions of the delivery network due to rider undersupply • When to move riders from one delivery region to another