Upgrade to Pro — share decks privately, control downloads, hide ads and more …

Contouring as a Data QA/QC Tool

Contouring as a Data QA/QC Tool

Presented by:
Amy Crowell - Mesquite Groundwater Conservation District (GCD)

More Decks by Texas Natural Resources Information System

Other Decks in Technology

Transcript

  1. – ™ Sorting in Access or Excel and checking highs and

    lows. ™ Displaying in ArcView and using graduated symbols ™ Contouring Data Checks
  2. – ™ Isopleths, or contour lines, connect points of equal value.

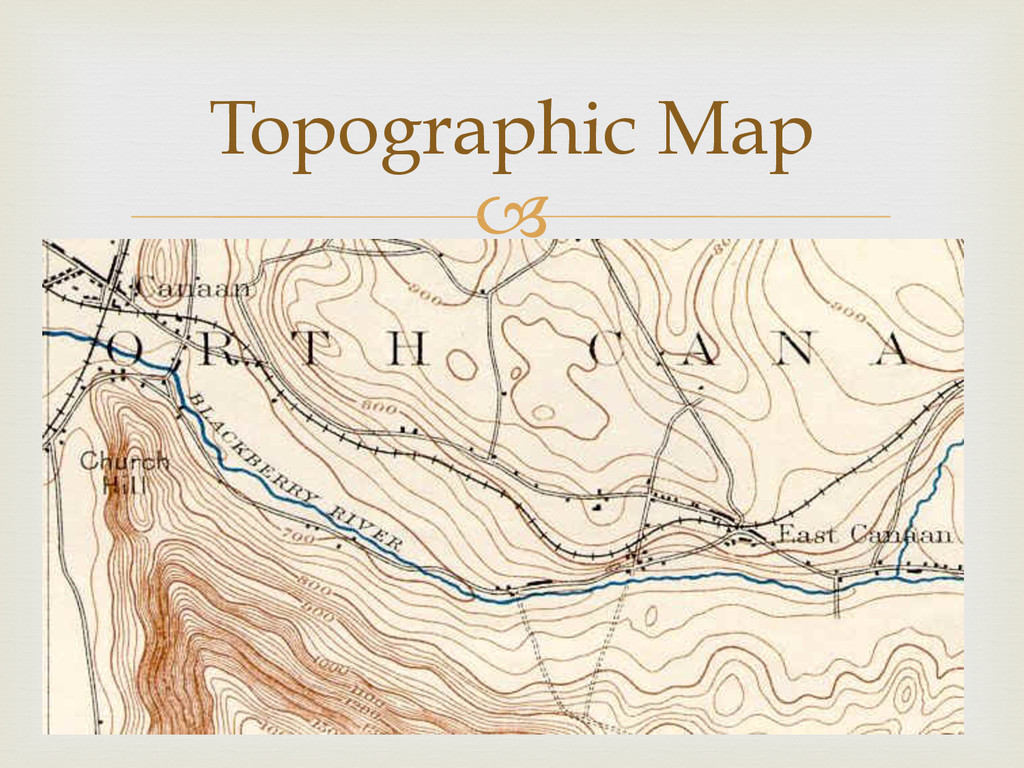
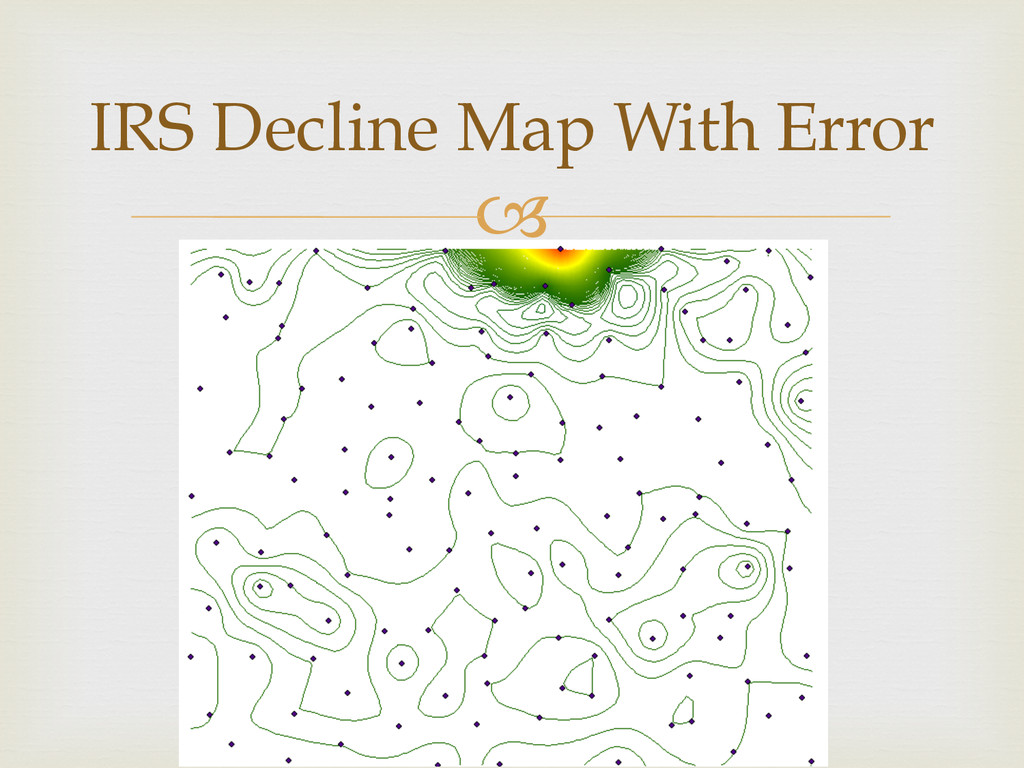
    –  Topographic maps show equal elevation (Z) values. –  Weather maps show equal pressure values. ™ Generally used to analyze and display data. Contouring 101
  3. – “Great discoveries are made accidentally less often than the

    populace likes to think.” (Commenting on how an accident led to the discovery of X-rays) ― William Cecil Dampier, A Shorter History of Science
  4. – ™  Any numeric attribute in a dataset with coordinates

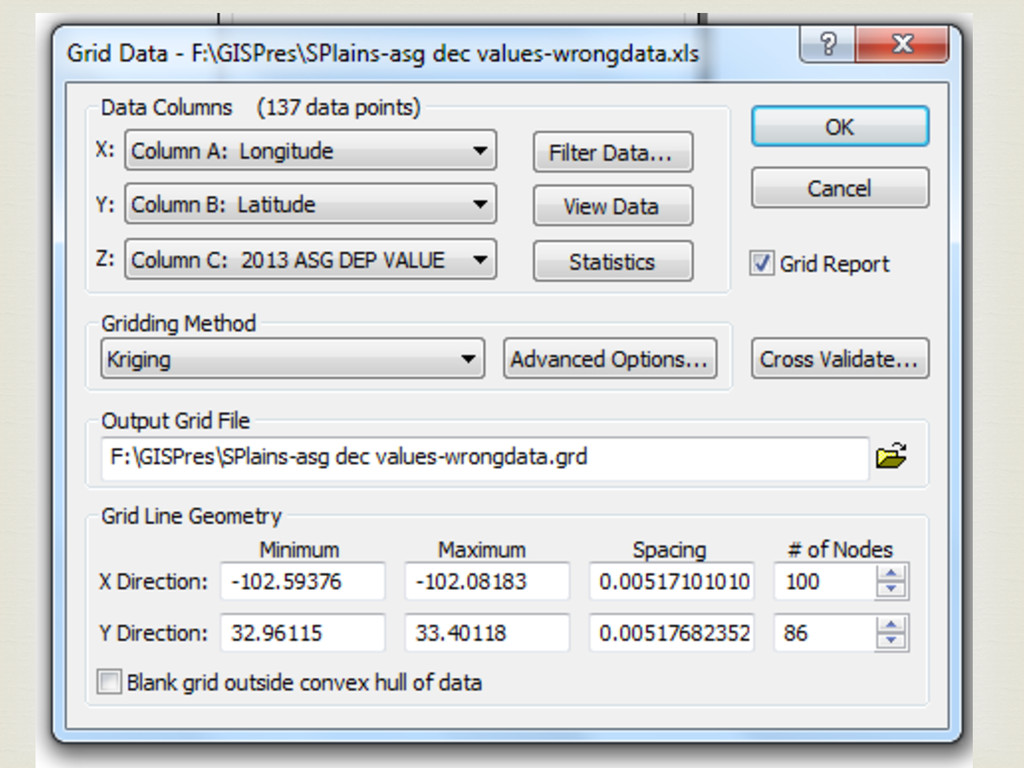
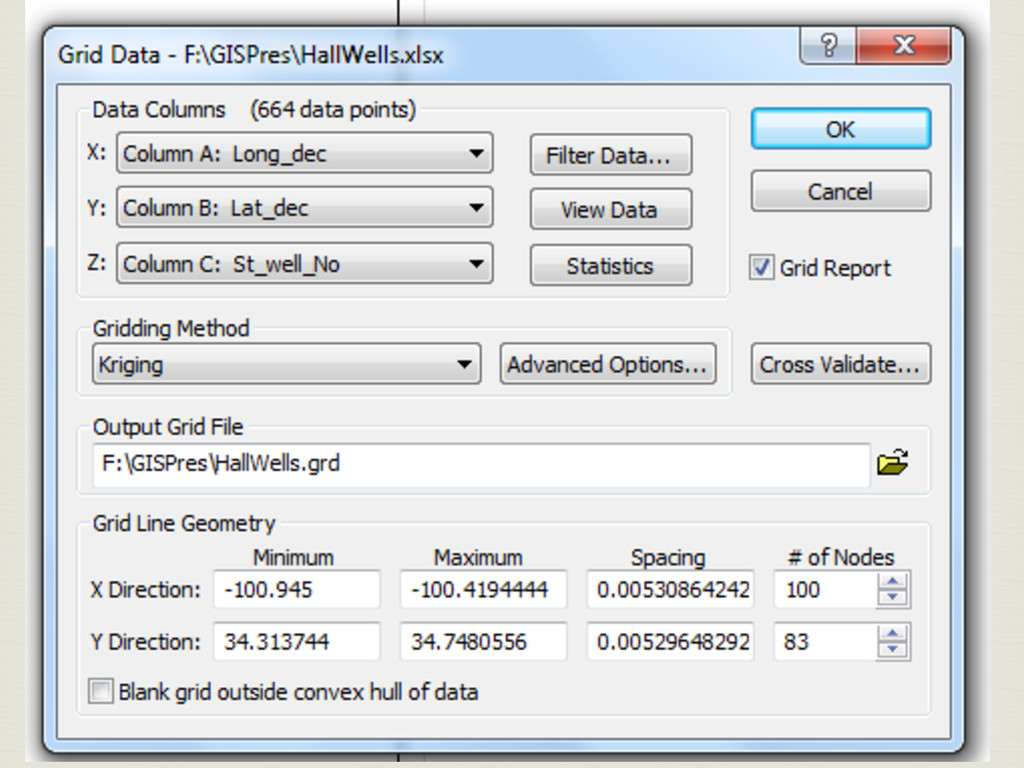
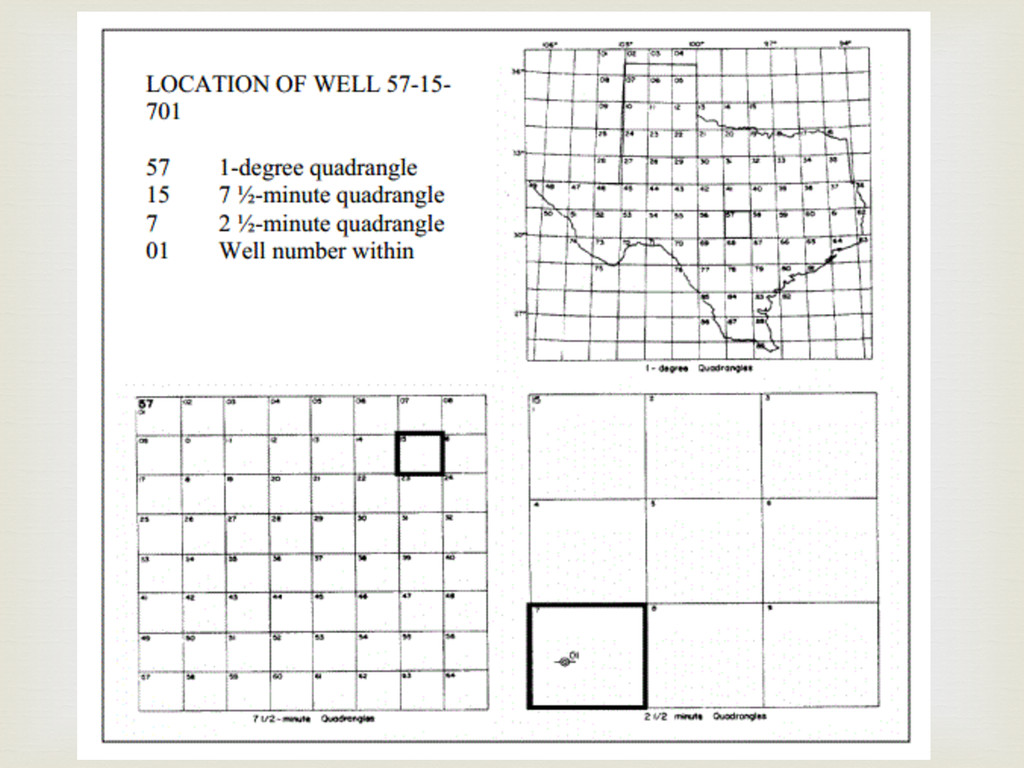
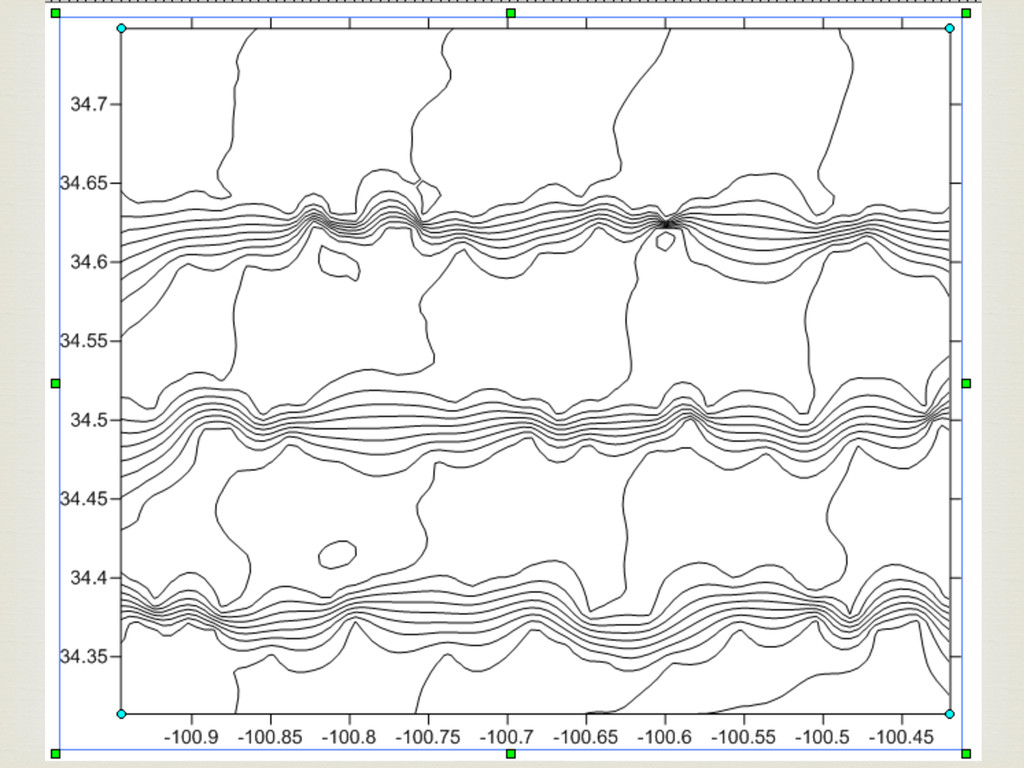
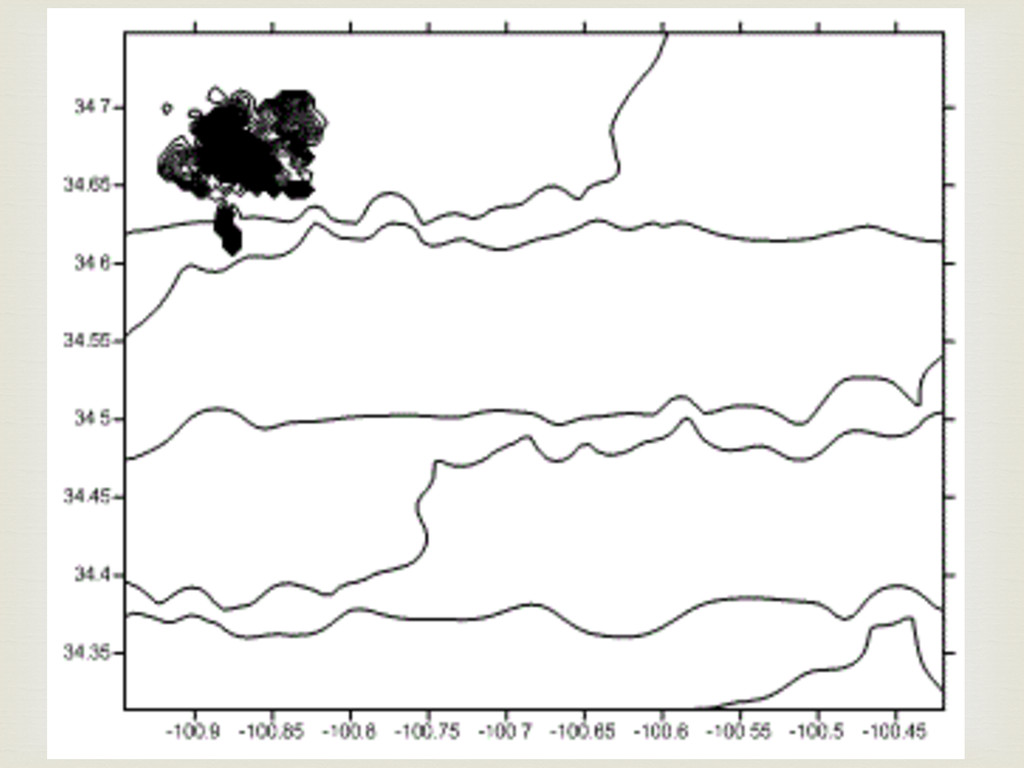
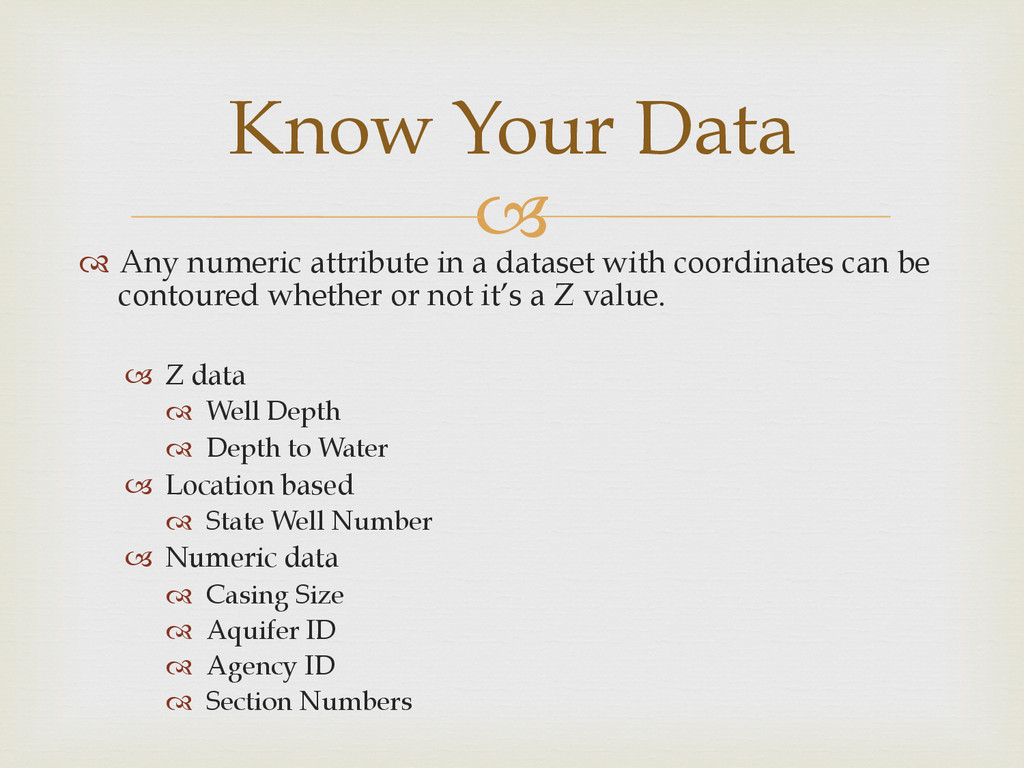
    can be contoured whether or not it’s a Z value. –  Z data ™  Well Depth ™  Depth to Water –  Location based ™  State Well Number –  Numeric data ™  Casing Size ™  Aquifer ID ™  Agency ID ™  Section Numbers Know Your Data
  5. – ™ Rearrange your thinking. –  Instead of contouring for a

    product, contour to check your data. ™ Rearrange your work order. –  Contour first to check data, rather than at the end for a product. Changes