Acquire new geospatial data Update existing geospatial data Define a common mapping standard to ensure consistent, high quality data for the State of Texas and the public. Attract partnerships to increase the purchasing power of public funds. Responsibilities Strategic Mapping Program
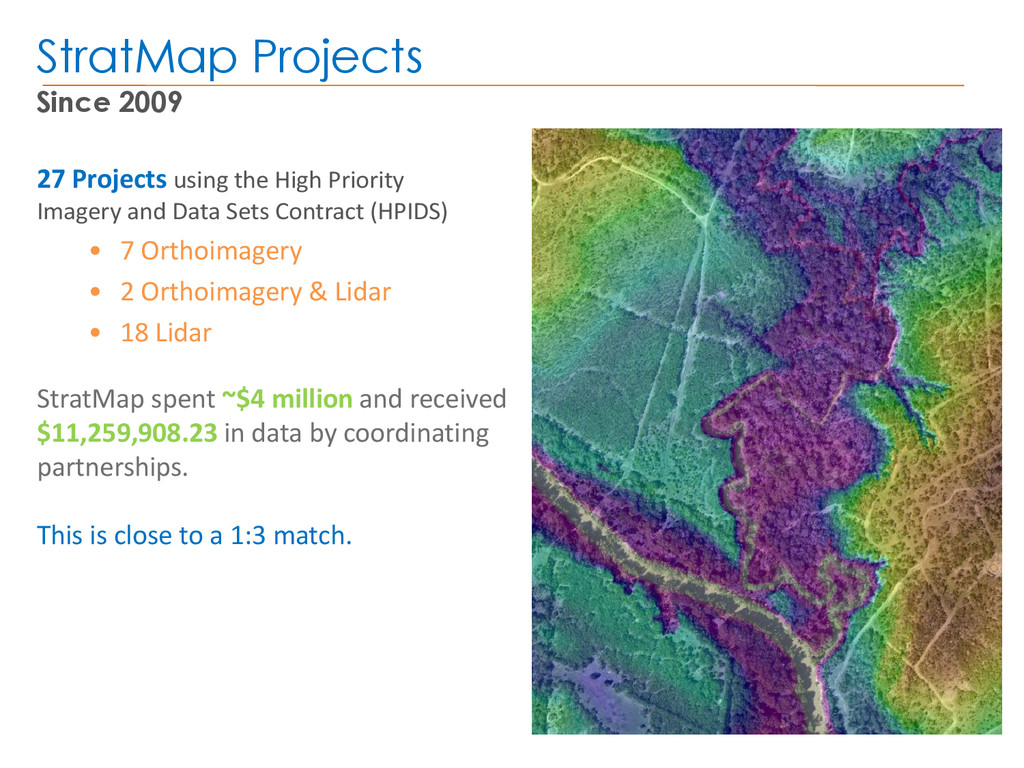
Imagery and Data Sets Contract (HPIDS) • 7 Orthoimagery • 2 Orthoimagery & Lidar • 18 Lidar StratMap spent ~$4 million and received $11,259,908.23 in data by coordinating partnerships. This is close to a 1:3 match.
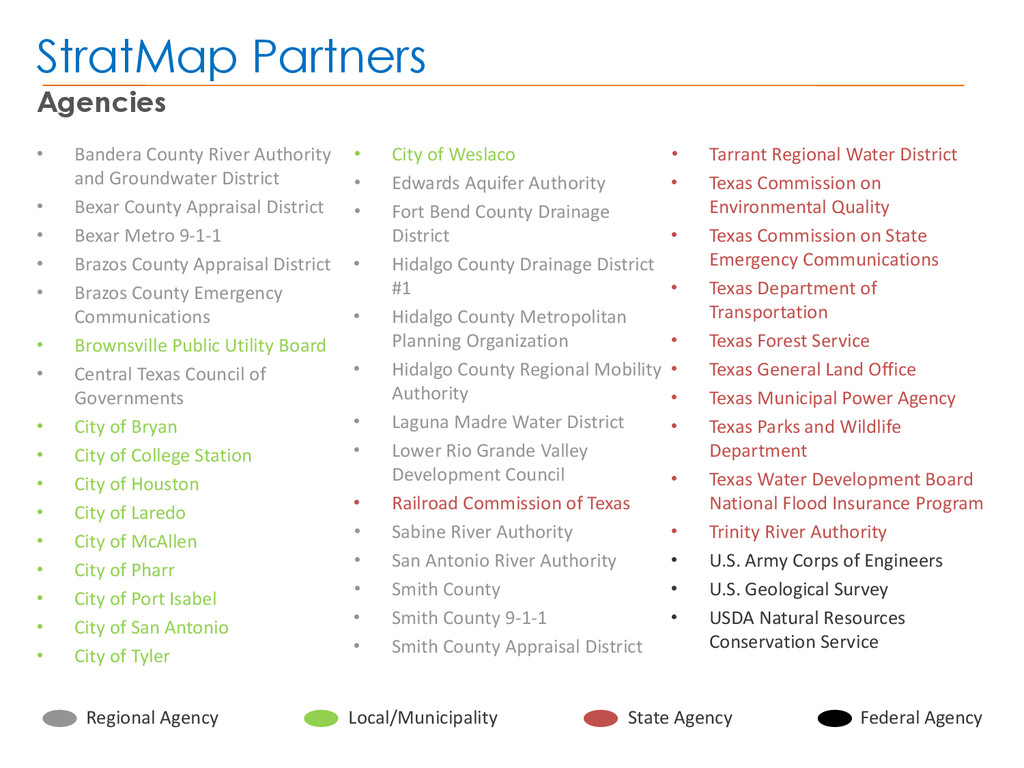
District • Bexar County Appraisal District • Bexar Metro 9-1-1 • Brazos County Appraisal District • Brazos County Emergency Communications • Brownsville Public Utility Board • Central Texas Council of Governments • City of Bryan • City of College Station • City of Houston • City of Laredo • City of McAllen • City of Pharr • City of Port Isabel • City of San Antonio • City of Tyler • City of Weslaco • Edwards Aquifer Authority • Fort Bend County Drainage District • Hidalgo County Drainage District #1 • Hidalgo County Metropolitan Planning Organization • Hidalgo County Regional Mobility Authority • Laguna Madre Water District • Lower Rio Grande Valley Development Council • Railroad Commission of Texas • Sabine River Authority • San Antonio River Authority • Smith County • Smith County 9-1-1 • Smith County Appraisal District • Tarrant Regional Water District • Texas Commission on Environmental Quality • Texas Commission on State Emergency Communications • Texas Department of Transportation • Texas Forest Service • Texas General Land Office • Texas Municipal Power Agency • Texas Parks and Wildlife Department • Texas Water Development Board National Flood Insurance Program • Trinity River Authority • U.S. Army Corps of Engineers • U.S. Geological Survey • USDA Natural Resources Conservation Service State Agency Local/Municipality Regional Agency Federal Agency
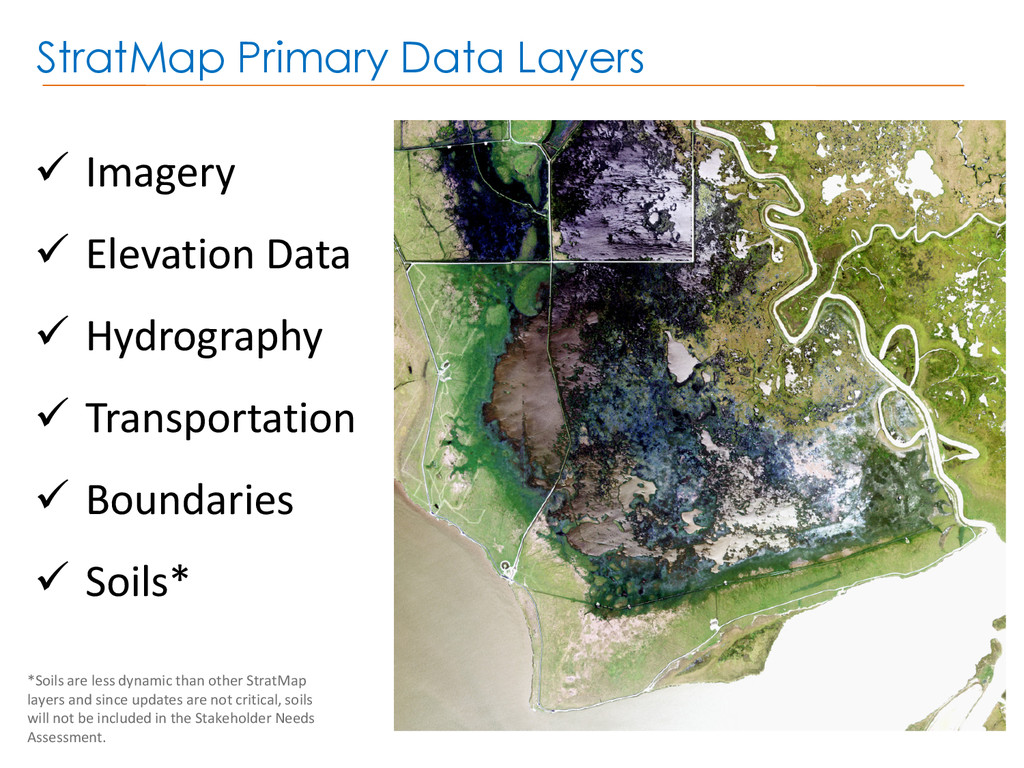
Hydrography Transportation Boundaries Soils* *Soils are less dynamic than other StratMap layers and since updates are not critical, soils will not be included in the Stakeholder Needs Assessment.
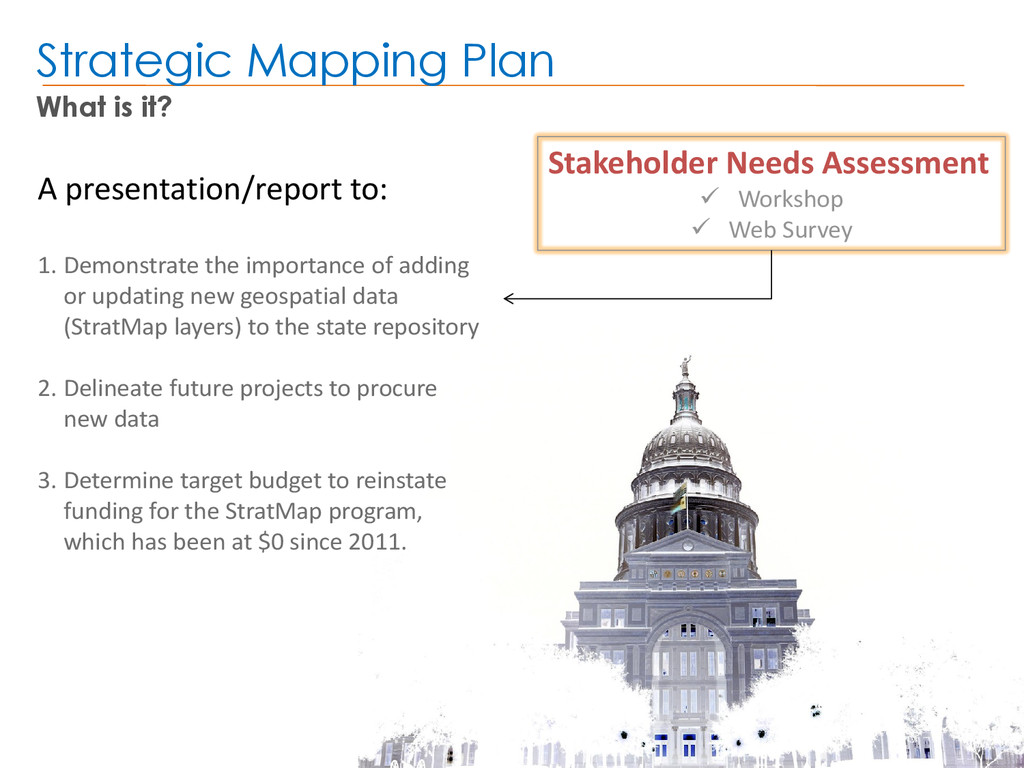
Demonstrate the importance of adding or updating new geospatial data (StratMap layers) to the state repository 2. Delineate future projects to procure new data 3. Determine target budget to reinstate funding for the StratMap program, which has been at $0 since 2011. Stakeholder Needs Assessment Workshop Web Survey
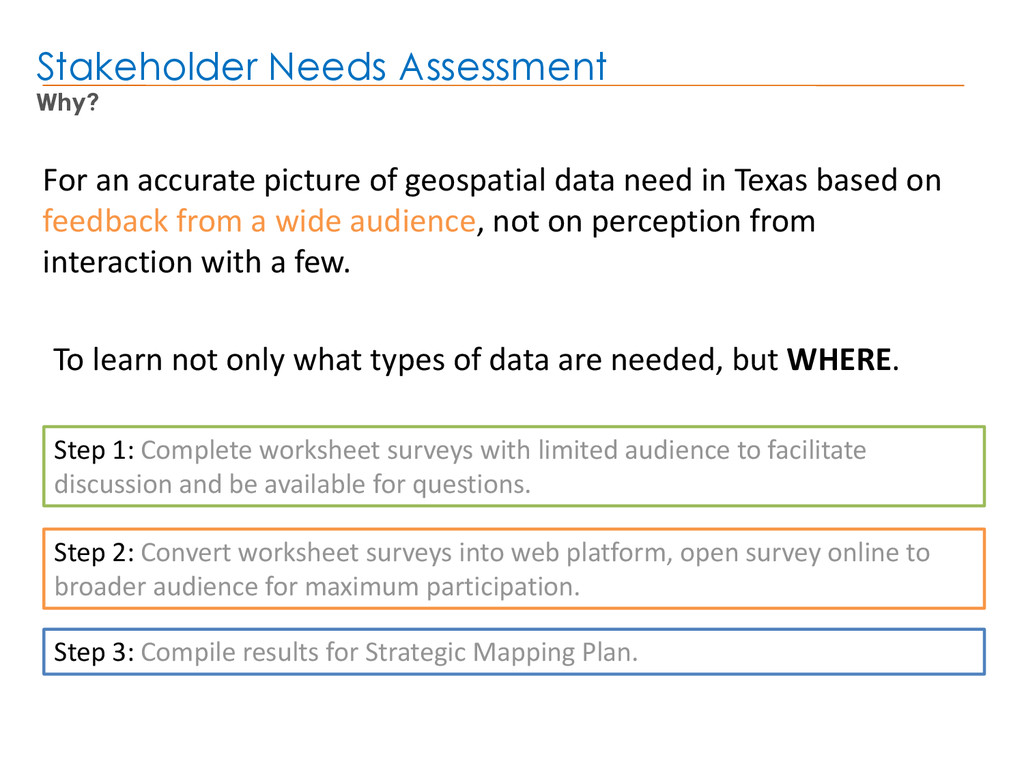
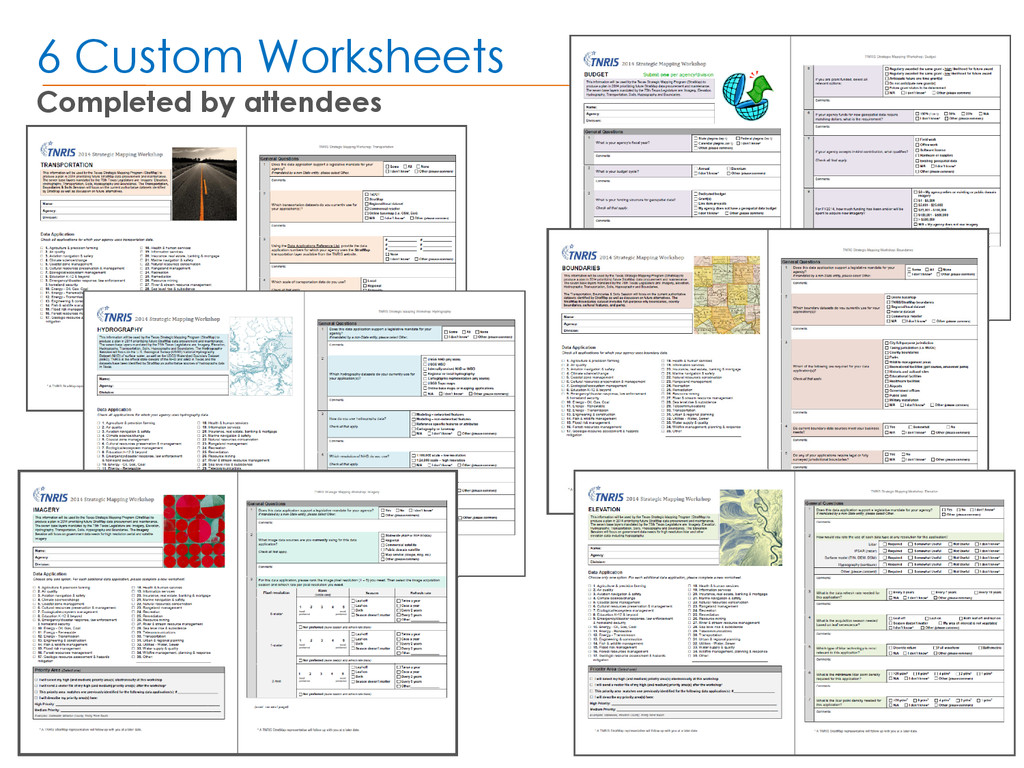
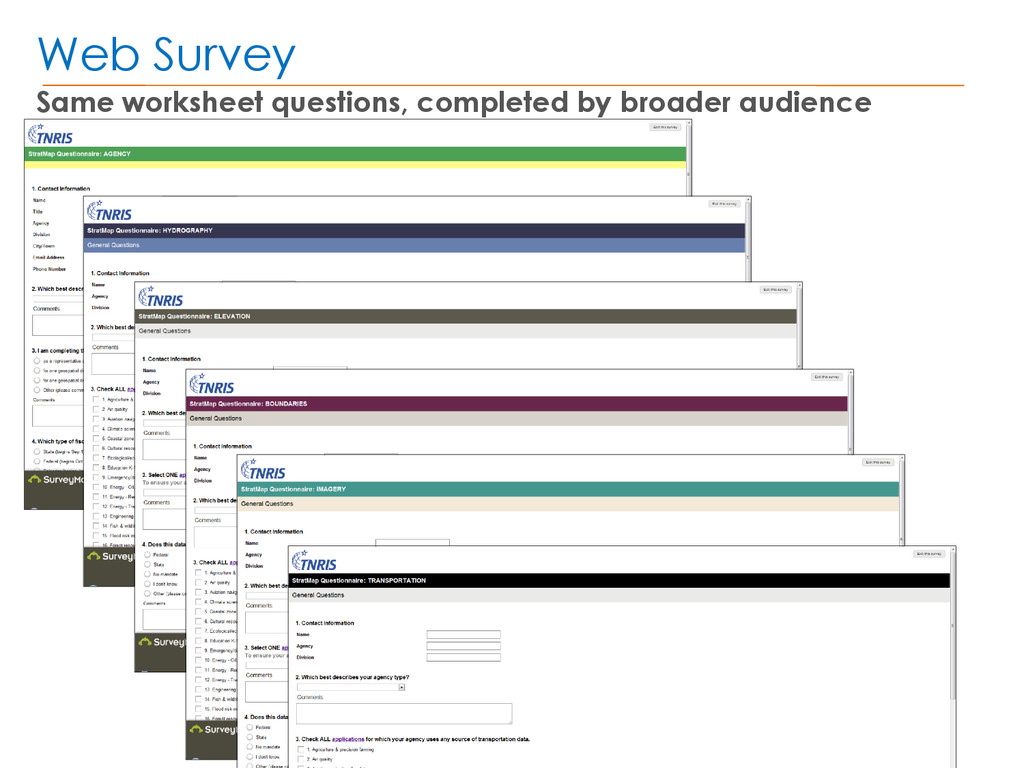
data need in Texas based on feedback from a wide audience, not on perception from interaction with a few. To learn not only what types of data are needed, but WHERE. Step 1: Complete worksheet surveys with limited audience to facilitate discussion and be available for questions. Step 2: Convert worksheet surveys into web platform, open survey online to broader audience for maximum participation. Step 3: Compile results for Strategic Mapping Plan.
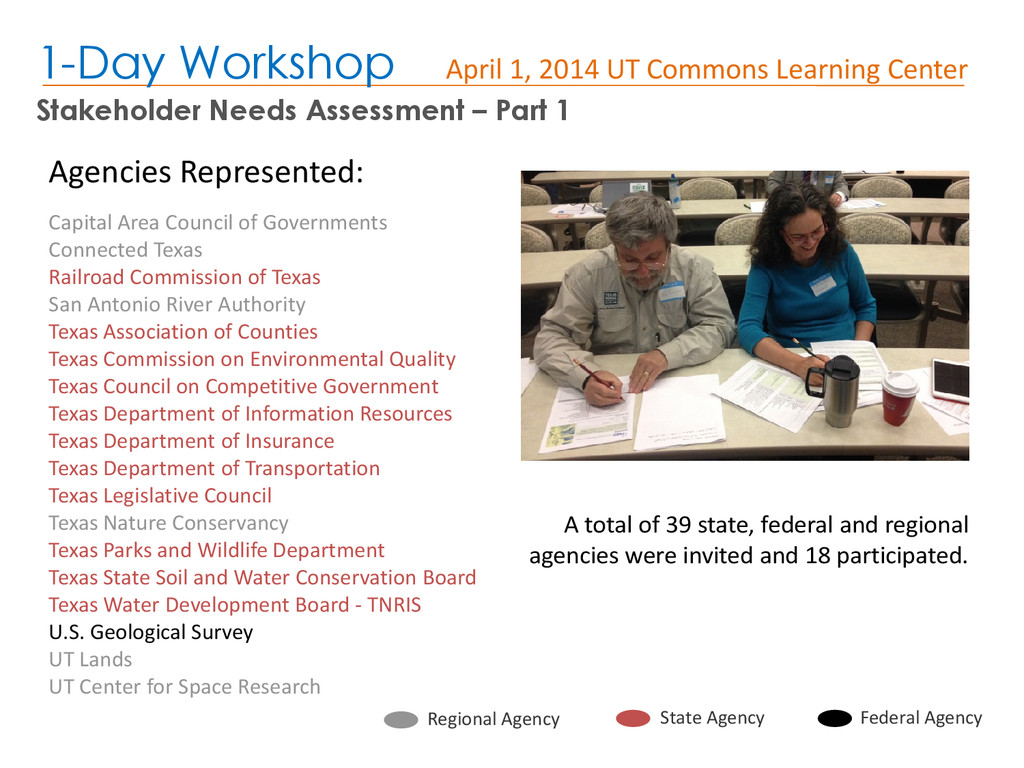
Needs Assessment – Part 1 Agencies Represented: Capital Area Council of Governments Connected Texas Railroad Commission of Texas San Antonio River Authority Texas Association of Counties Texas Commission on Environmental Quality Texas Council on Competitive Government Texas Department of Information Resources Texas Department of Insurance Texas Department of Transportation Texas Legislative Council Texas Nature Conservancy Texas Parks and Wildlife Department Texas State Soil and Water Conservation Board Texas Water Development Board - TNRIS U.S. Geological Survey UT Lands UT Center for Space Research A total of 39 state, federal and regional agencies were invited and 18 participated. State Agency Regional Agency Federal Agency
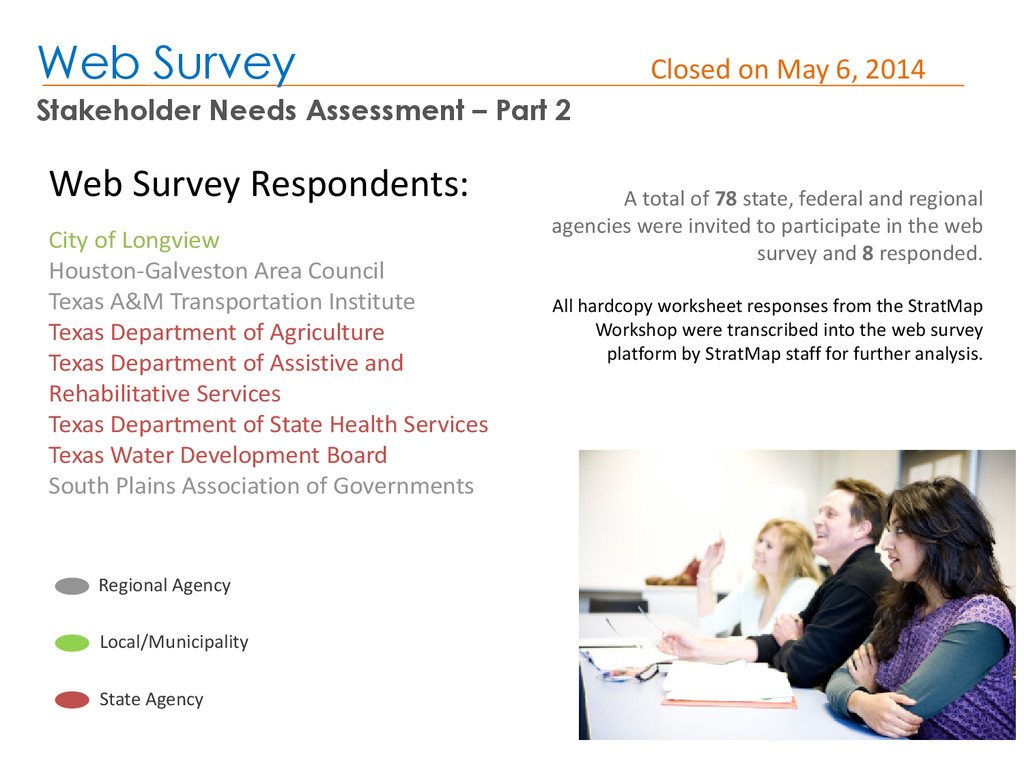
– Part 2 Web Survey Respondents: City of Longview Houston-Galveston Area Council Texas A&M Transportation Institute Texas Department of Agriculture Texas Department of Assistive and Rehabilitative Services Texas Department of State Health Services Texas Water Development Board South Plains Association of Governments A total of 78 state, federal and regional agencies were invited to participate in the web survey and 8 responded. All hardcopy worksheet responses from the StratMap Workshop were transcribed into the web survey platform by StratMap staff for further analysis. State Agency Local/Municipality Regional Agency
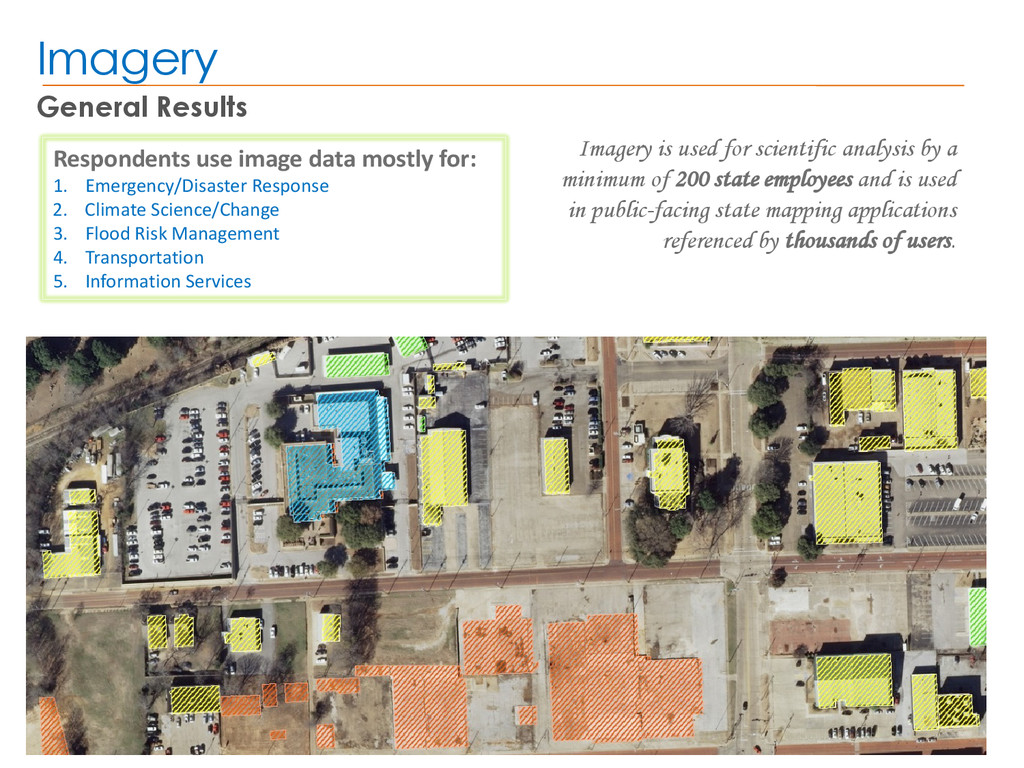
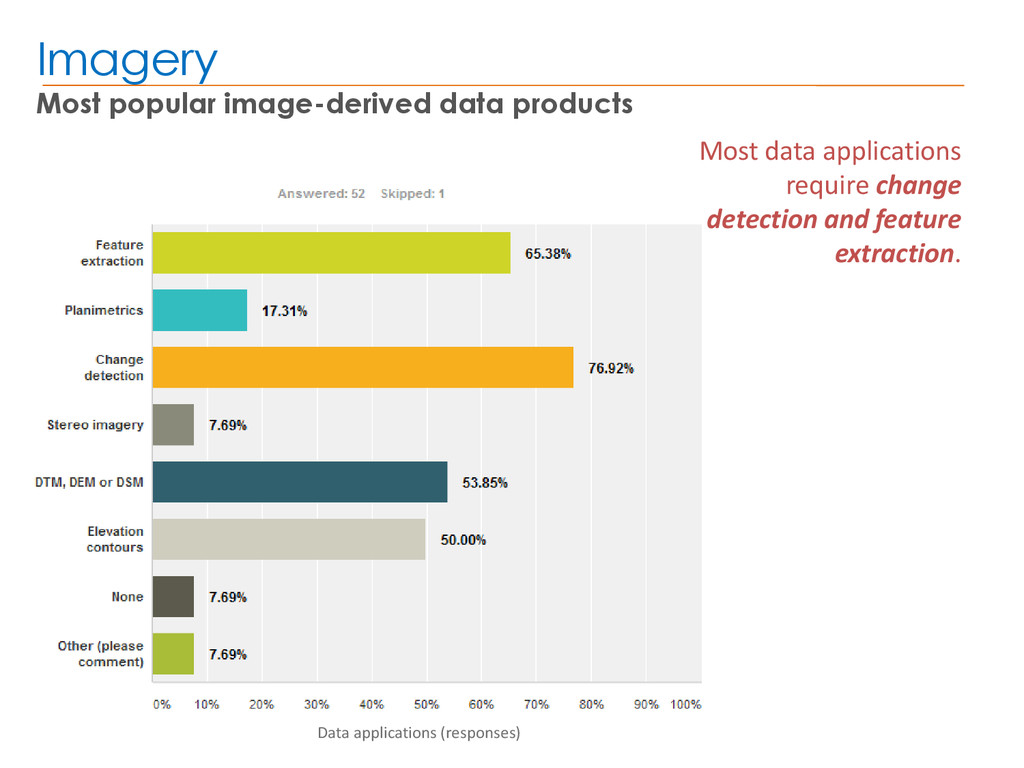
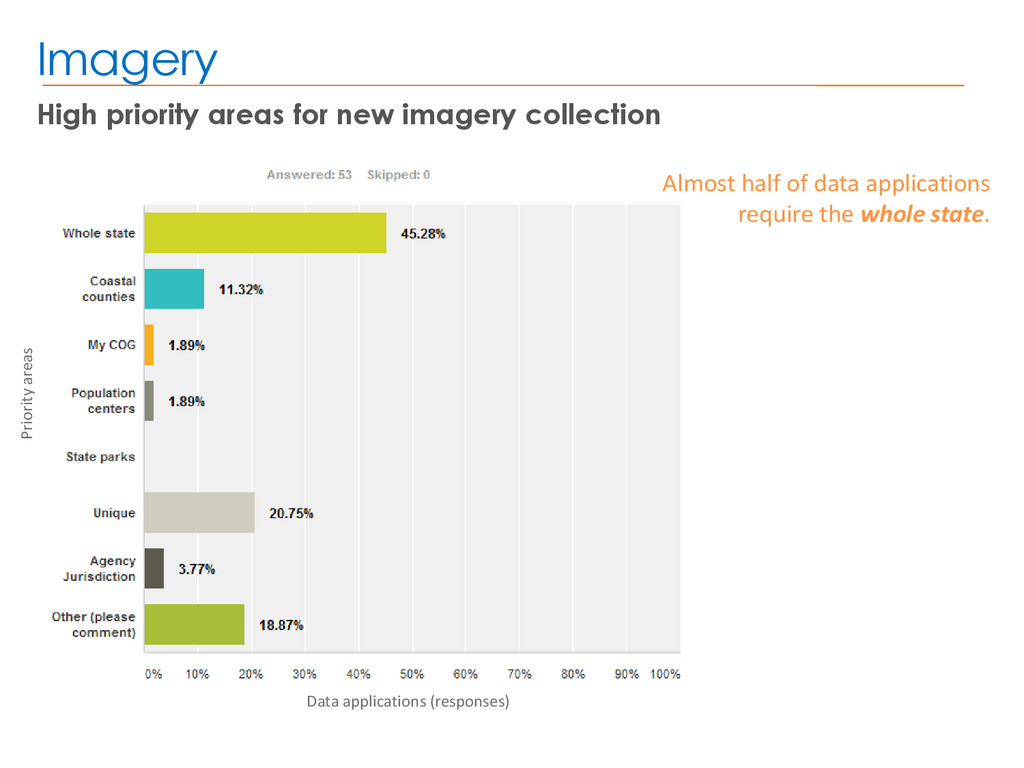
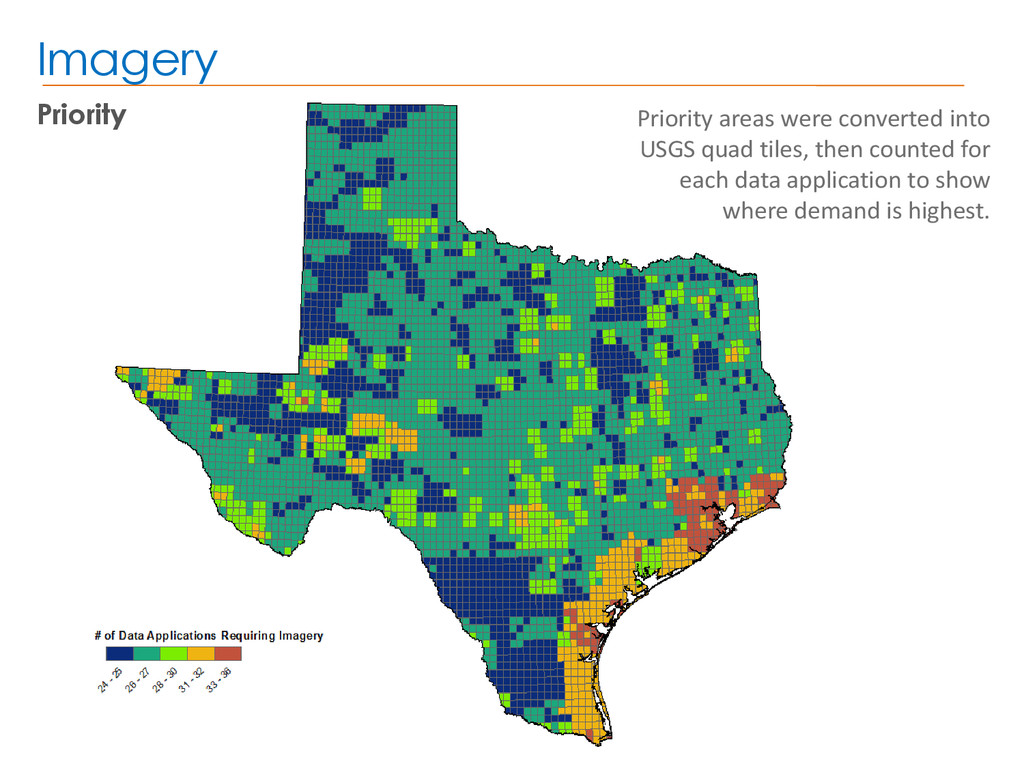
a minimum of 200 state employees and is used in public-facing state mapping applications referenced by thousands of users. Respondents use image data mostly for: 1. Emergency/Disaster Response 2. Climate Science/Change 3. Flood Risk Management 4. Transportation 5. Information Services
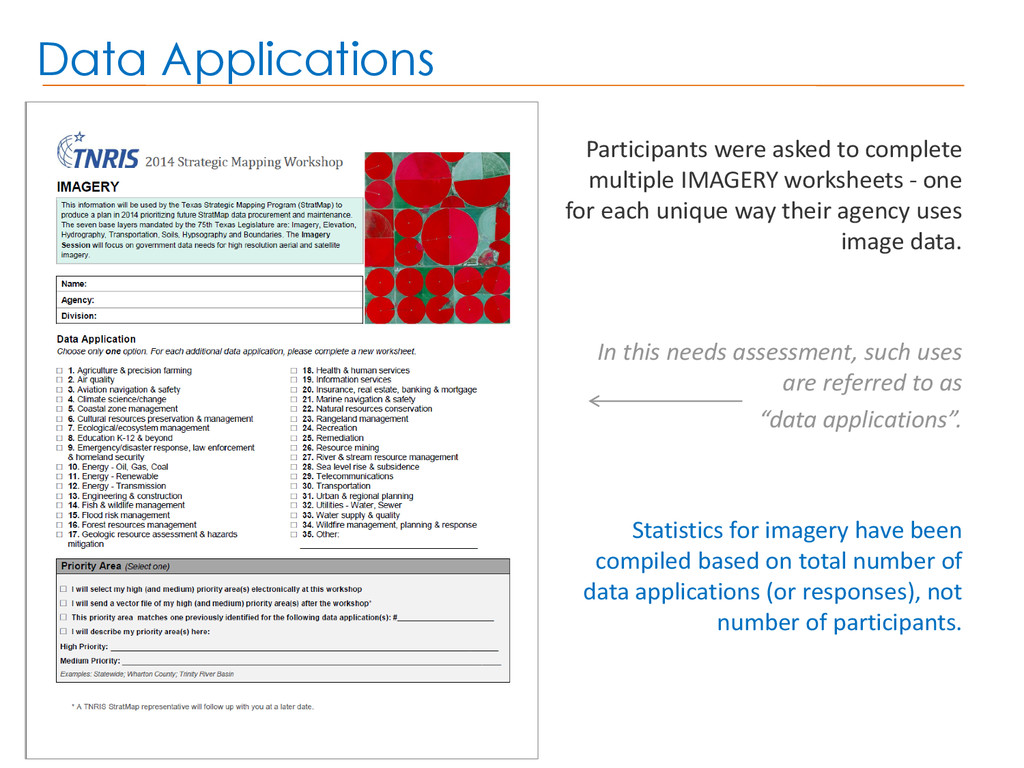
- one for each unique way their agency uses image data. In this needs assessment, such uses are referred to as “data applications”. Statistics for imagery have been compiled based on total number of data applications (or responses), not number of participants.
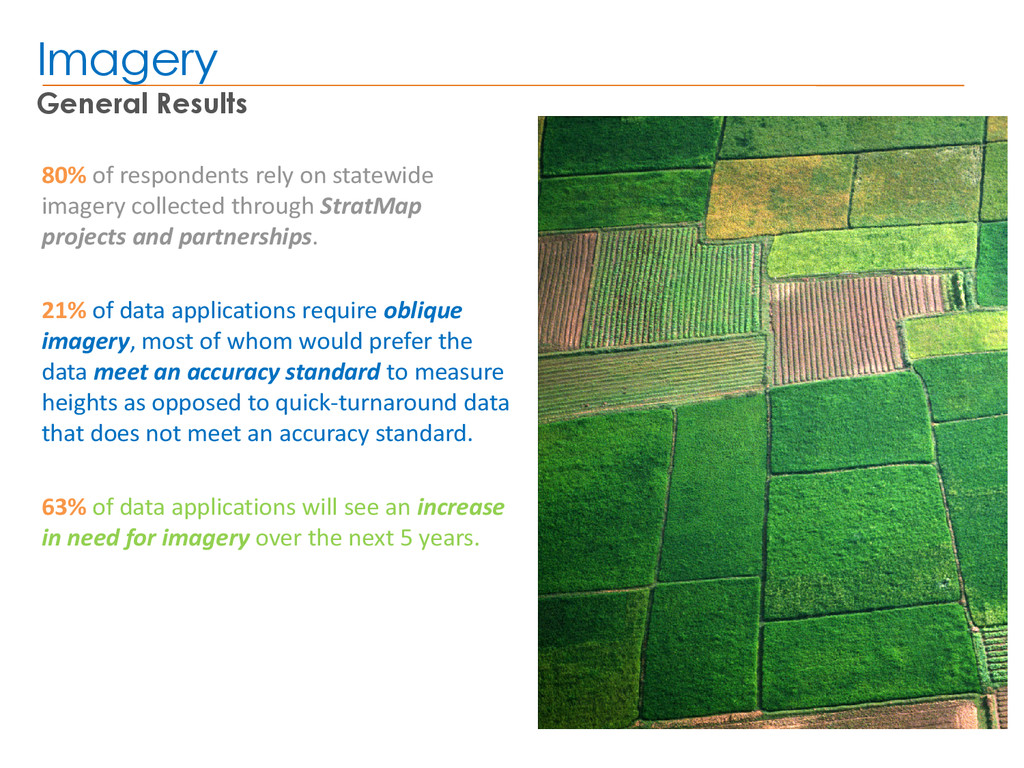
collected through StratMap projects and partnerships. 21% of data applications require oblique imagery, most of whom would prefer the data meet an accuracy standard to measure heights as opposed to quick-turnaround data that does not meet an accuracy standard. 63% of data applications will see an increase in need for imagery over the next 5 years.
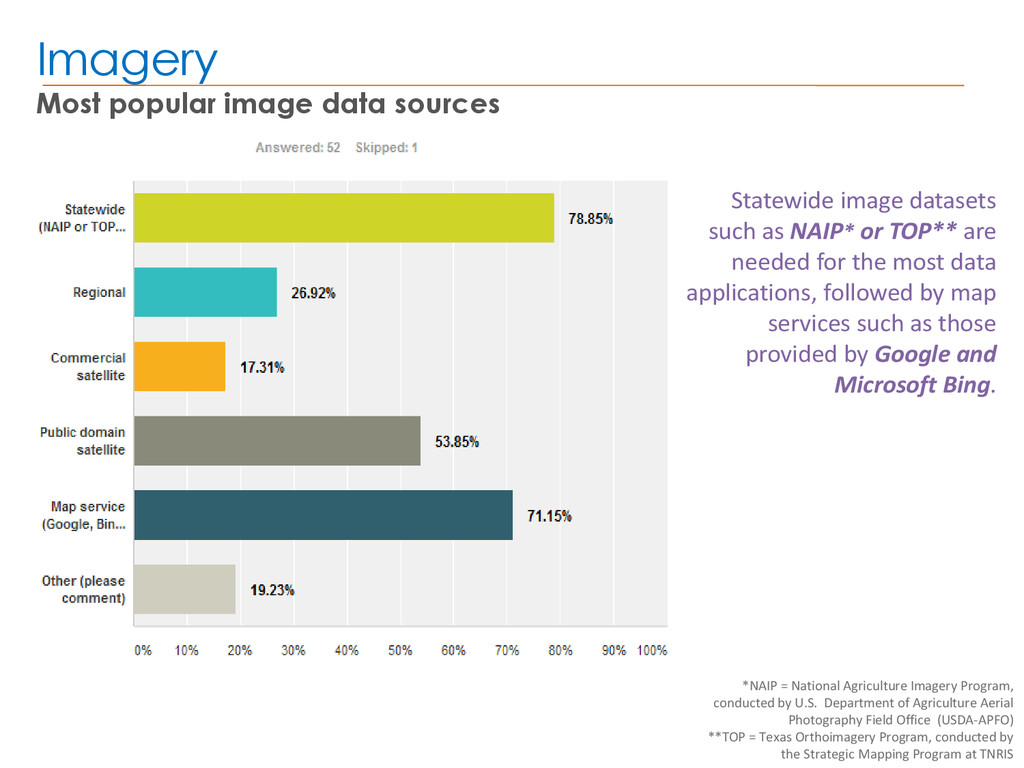
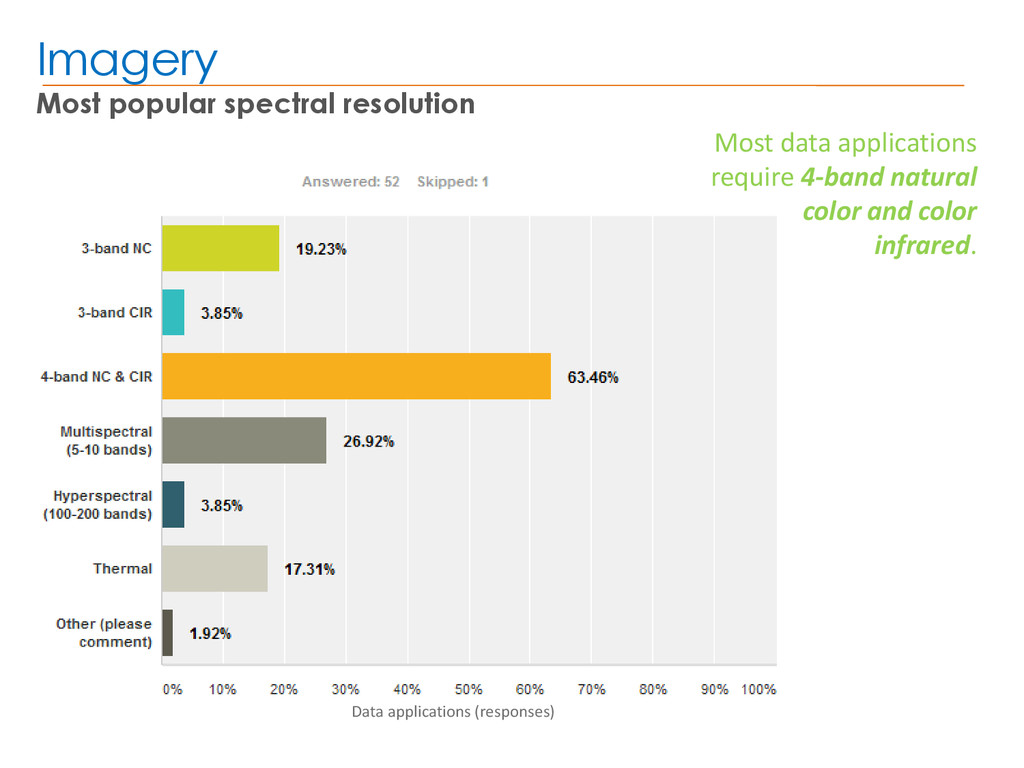
as NAIP* or TOP** are needed for the most data applications, followed by map services such as those provided by Google and Microsoft Bing. *NAIP = National Agriculture Imagery Program, conducted by U.S. Department of Agriculture Aerial Photography Field Office (USDA-APFO) **TOP = Texas Orthoimagery Program, conducted by the Strategic Mapping Program at TNRIS
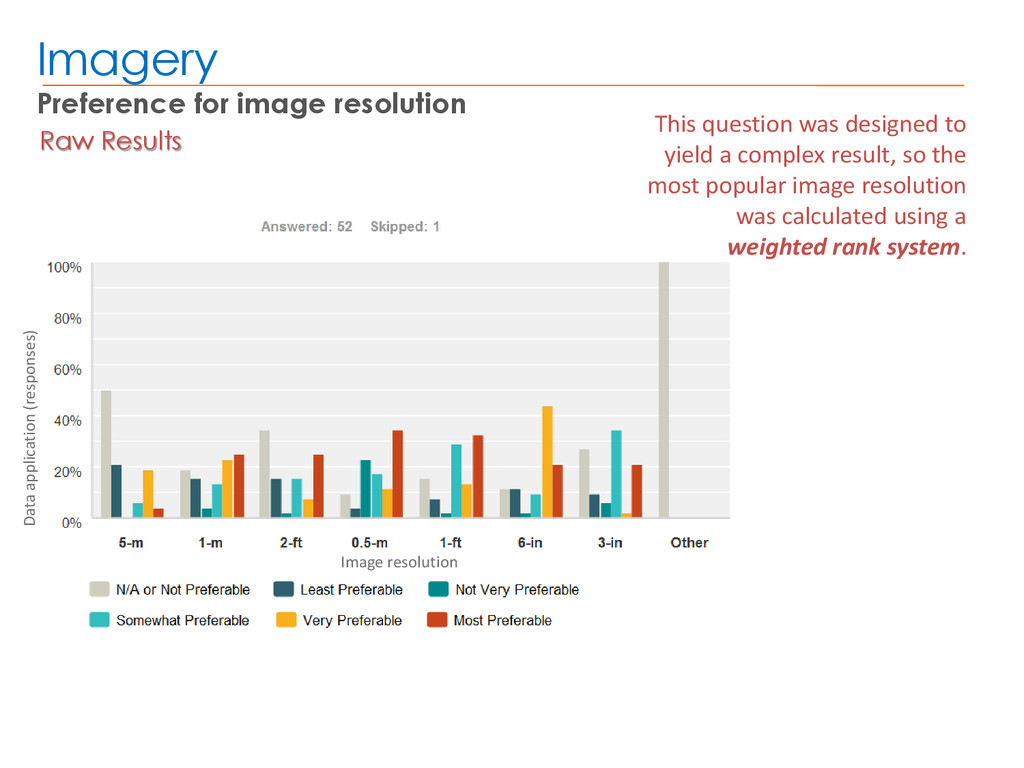
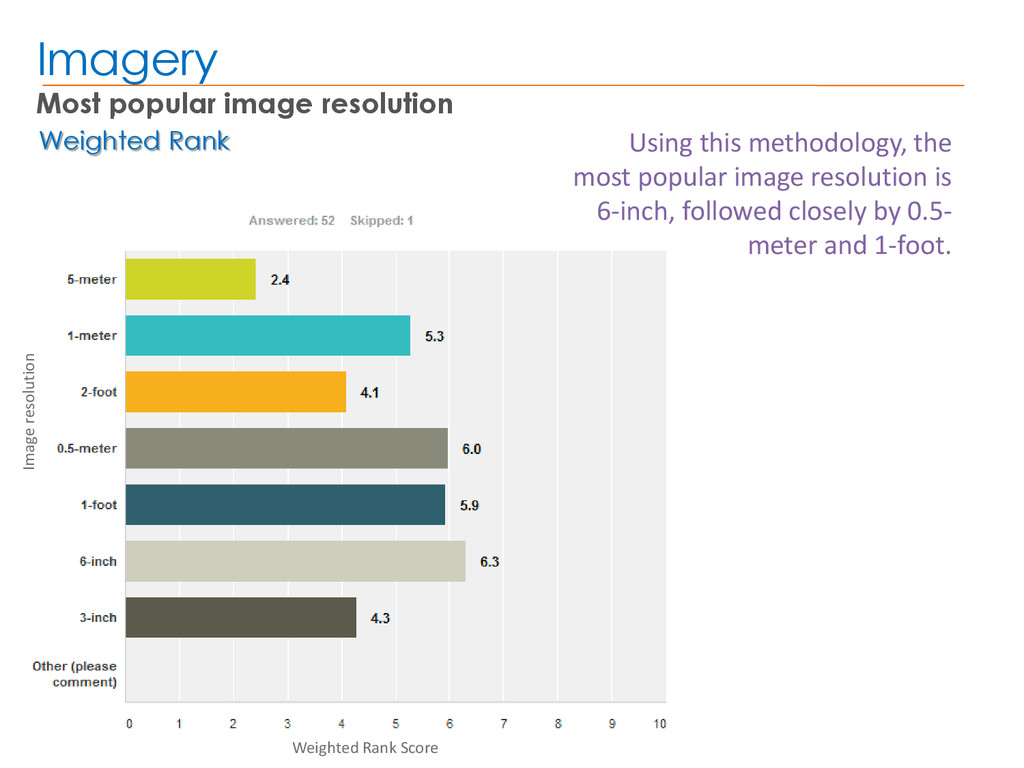
designed to yield a complex result, so the most popular image resolution was calculated using a weighted rank system. Data application (responses) Image resolution
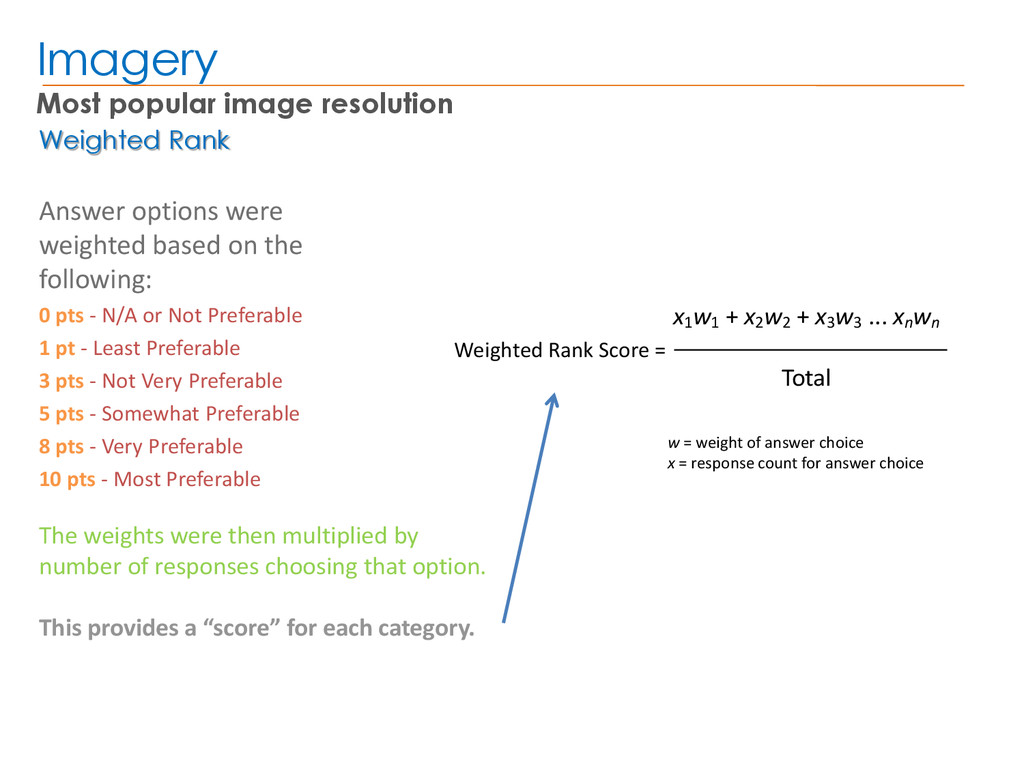
wn Total Imagery Most popular image resolution Answer options were weighted based on the following: 0 pts - N/A or Not Preferable 1 pt - Least Preferable 3 pts - Not Very Preferable 5 pts - Somewhat Preferable 8 pts - Very Preferable 10 pts - Most Preferable The weights were then multiplied by number of responses choosing that option. This provides a “score” for each category. w = weight of answer choice x = response count for answer choice Weighted Rank Score = Weighted Rank
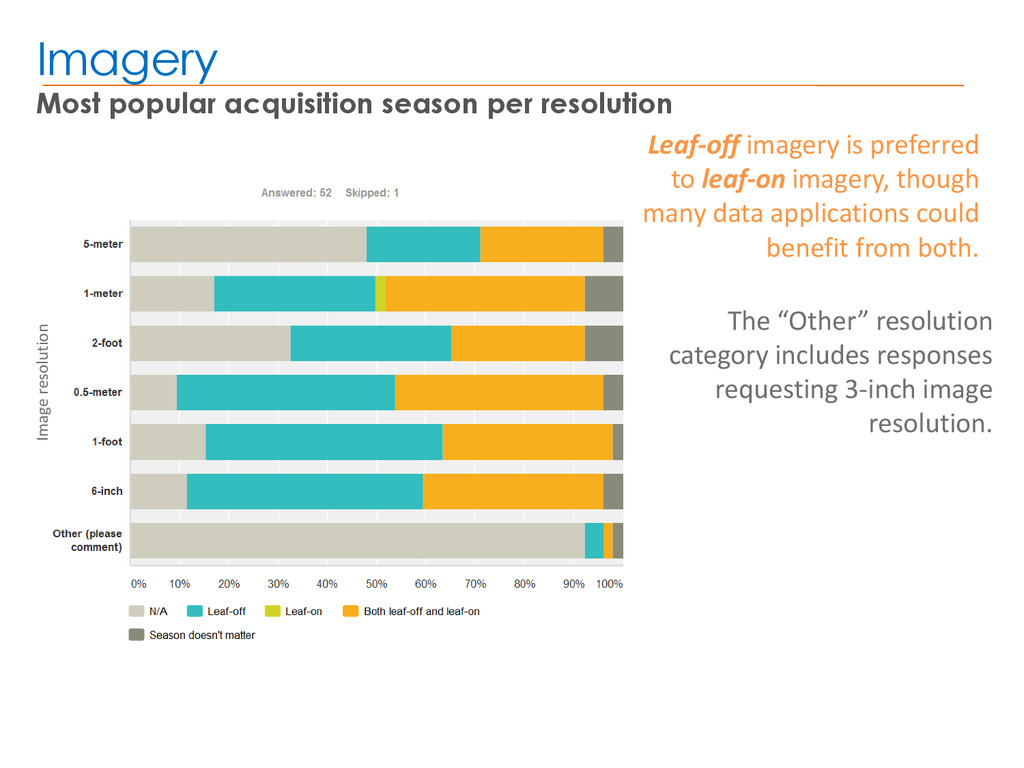
imagery is preferred to leaf-on imagery, though many data applications could benefit from both. The “Other” resolution category includes responses requesting 3-inch image resolution.
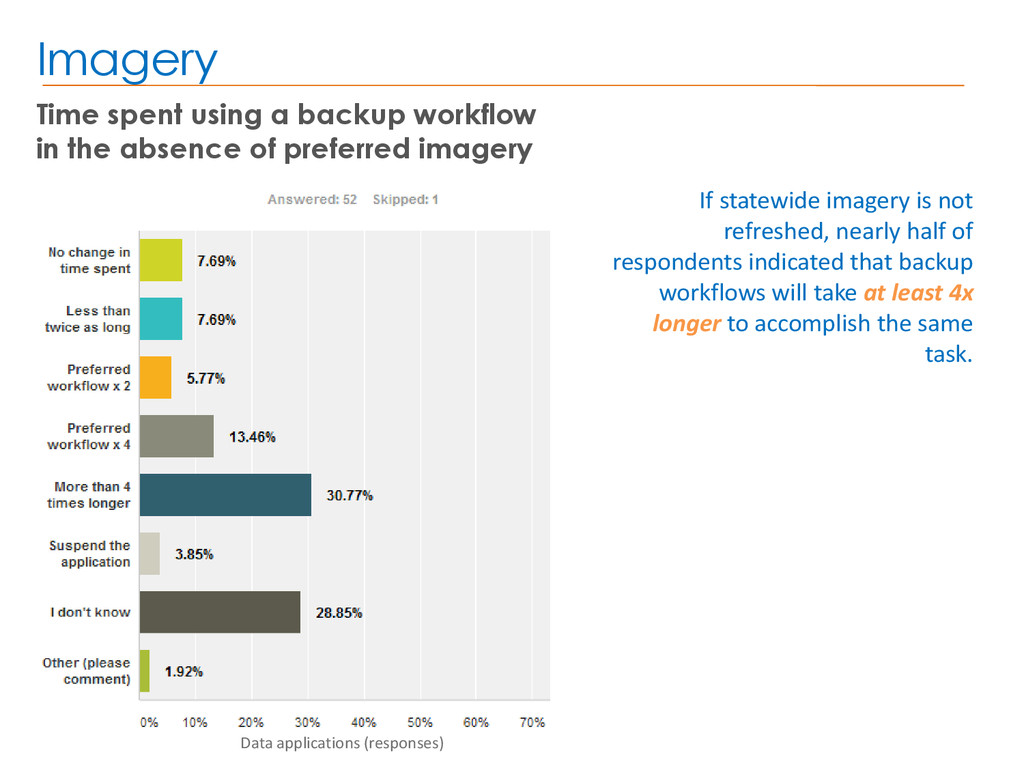
preferred imagery If statewide imagery is not refreshed, nearly half of respondents indicated that backup workflows will take at least 4x longer to accomplish the same task. Imagery Data applications (responses)
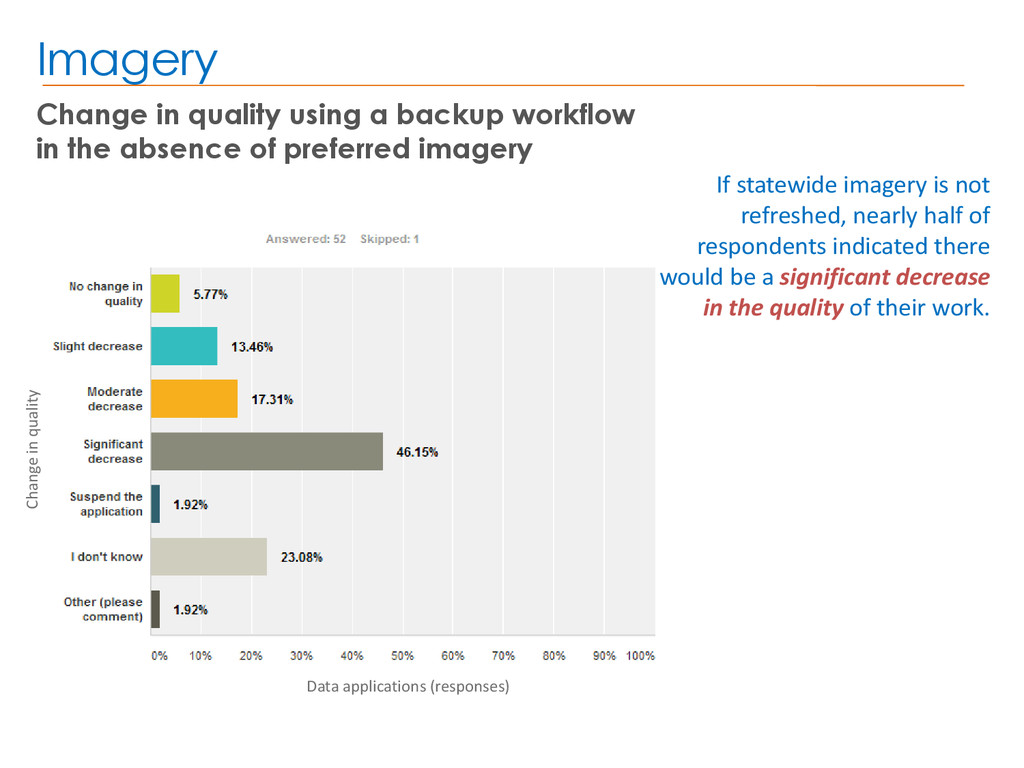
indicated there would be a significant decrease in the quality of their work. Change in quality using a backup workflow in the absence of preferred imagery Imagery Data applications (responses) Change in quality
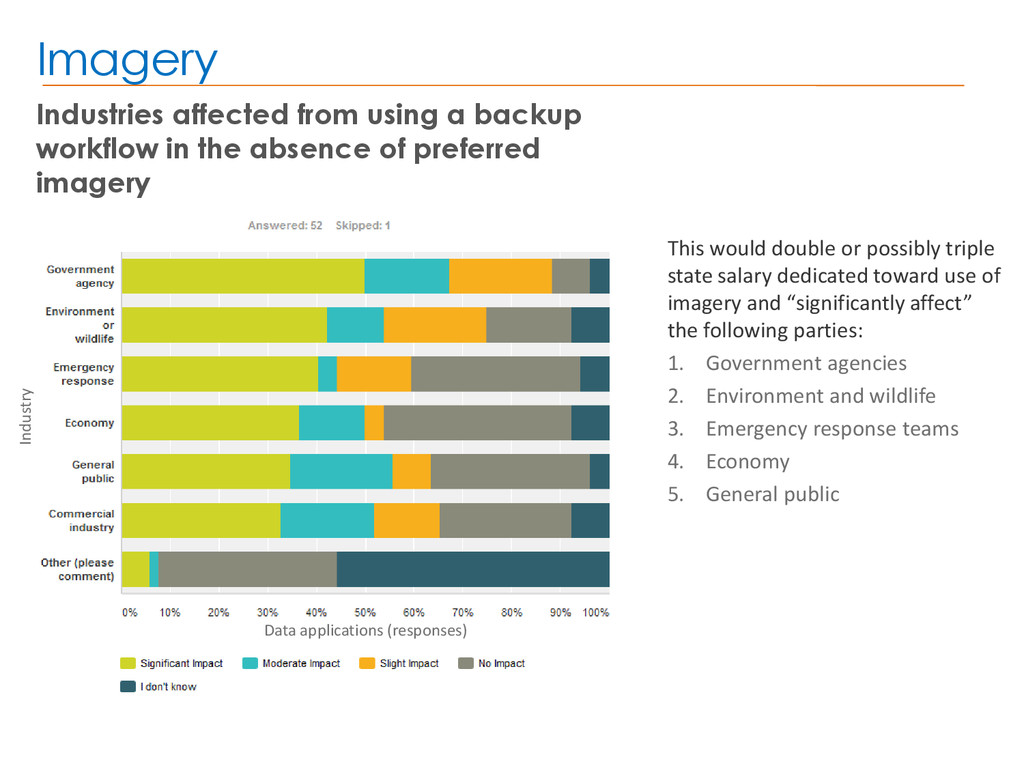
use of imagery and “significantly affect” the following parties: 1. Government agencies 2. Environment and wildlife 3. Emergency response teams 4. Economy 5. General public Data applications (responses) Industries affected from using a backup workflow in the absence of preferred imagery Imagery Industry
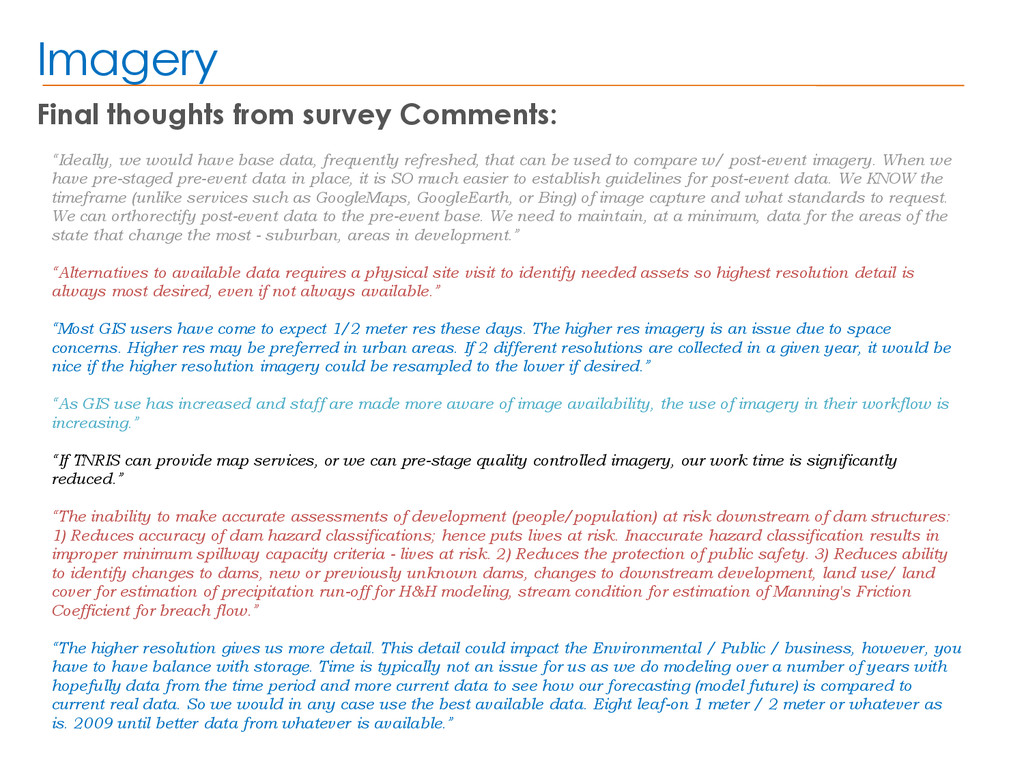
base data, frequently refreshed, that can be used to compare w/ post-event imagery. When we have pre-staged pre-event data in place, it is SO much easier to establish guidelines for post-event data. We KNOW the timeframe (unlike services such as GoogleMaps, GoogleEarth, or Bing) of image capture and what standards to request. We can orthorectify post-event data to the pre-event base. We need to maintain, at a minimum, data for the areas of the state that change the most - suburban, areas in development.” “Alternatives to available data requires a physical site visit to identify needed assets so highest resolution detail is always most desired, even if not always available.” “Most GIS users have come to expect 1/2 meter res these days. The higher res imagery is an issue due to space concerns. Higher res may be preferred in urban areas. If 2 different resolutions are collected in a given year, it would be nice if the higher resolution imagery could be resampled to the lower if desired.” “As GIS use has increased and staff are made more aware of image availability, the use of imagery in their workflow is increasing.” “If TNRIS can provide map services, or we can pre-stage quality controlled imagery, our work time is significantly reduced.” “The inability to make accurate assessments of development (people/population) at risk downstream of dam structures: 1) Reduces accuracy of dam hazard classifications; hence puts lives at risk. Inaccurate hazard classification results in improper minimum spillway capacity criteria - lives at risk. 2) Reduces the protection of public safety. 3) Reduces ability to identify changes to dams, new or previously unknown dams, changes to downstream development, land use/ land cover for estimation of precipitation run-off for H&H modeling, stream condition for estimation of Manning's Friction Coefficient for breach flow.” “The higher resolution gives us more detail. This detail could impact the Environmental / Public / business, however, you have to have balance with storage. Time is typically not an issue for us as we do modeling over a number of years with hopefully data from the time period and more current data to see how our forecasting (model future) is compared to current real data. So we would in any case use the best available data. Eight leaf-on 1 meter / 2 meter or whatever as is. 2009 until better data from whatever is available.”
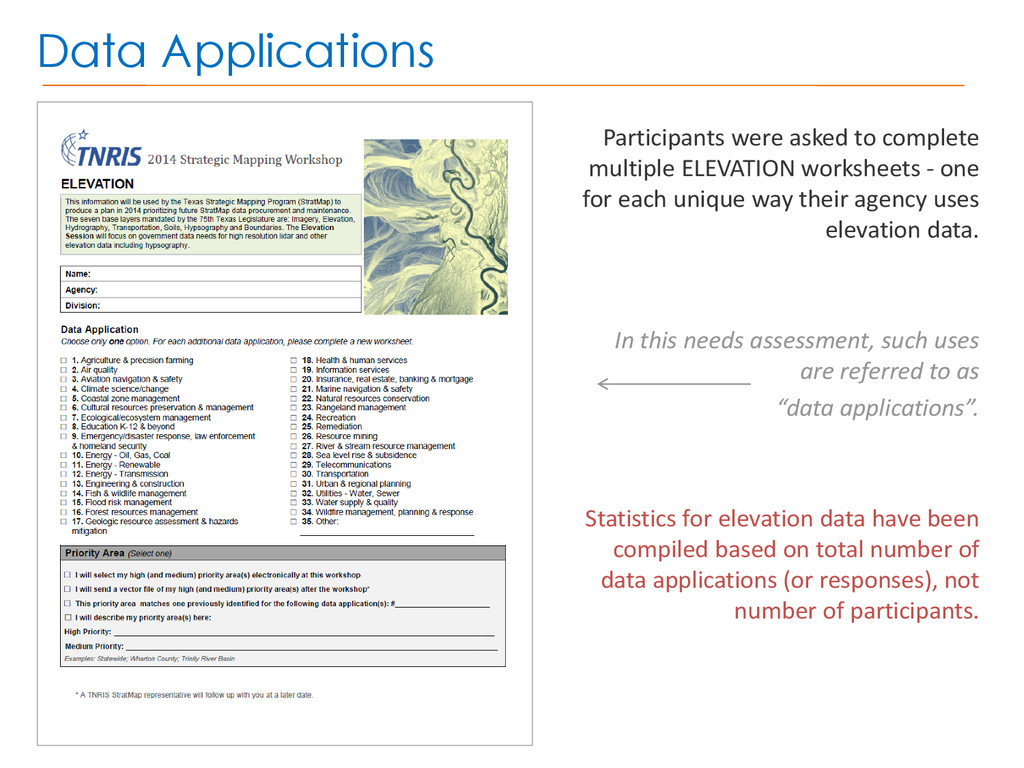
- one for each unique way their agency uses elevation data. In this needs assessment, such uses are referred to as “data applications”. Statistics for elevation data have been compiled based on total number of data applications (or responses), not number of participants.
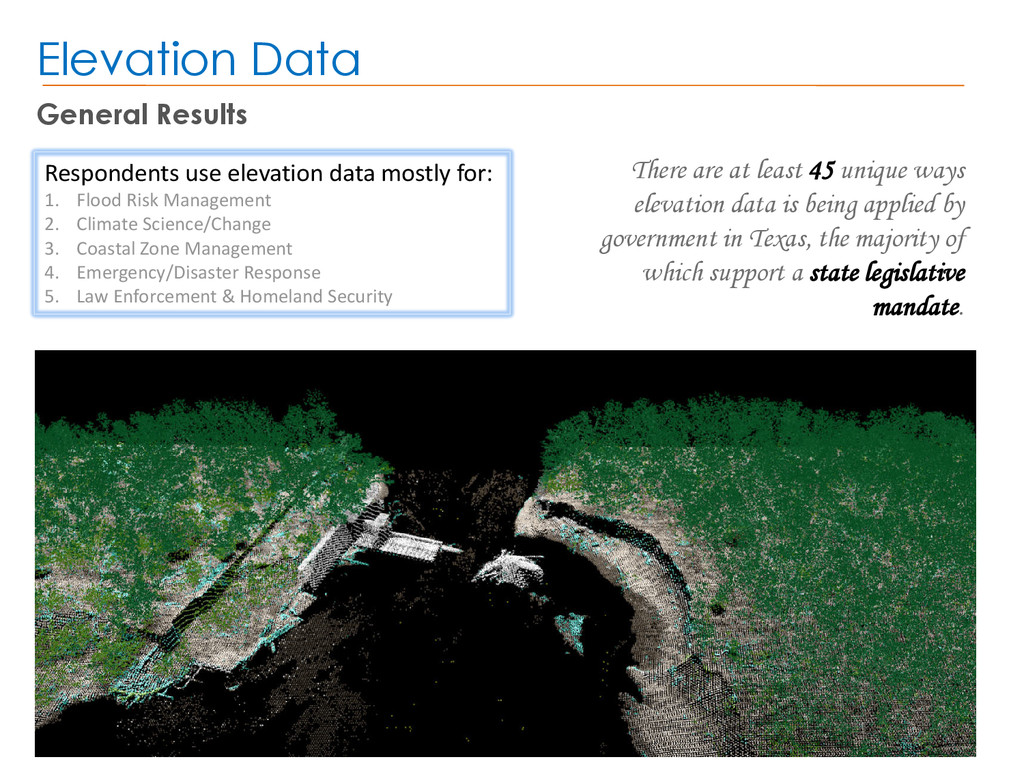
2. Climate Science/Change 3. Coastal Zone Management 4. Emergency/Disaster Response 5. Law Enforcement & Homeland Security There are at least 45 unique ways elevation data is being applied by government in Texas, the majority of which support a state legislative mandate. General Results Elevation Data
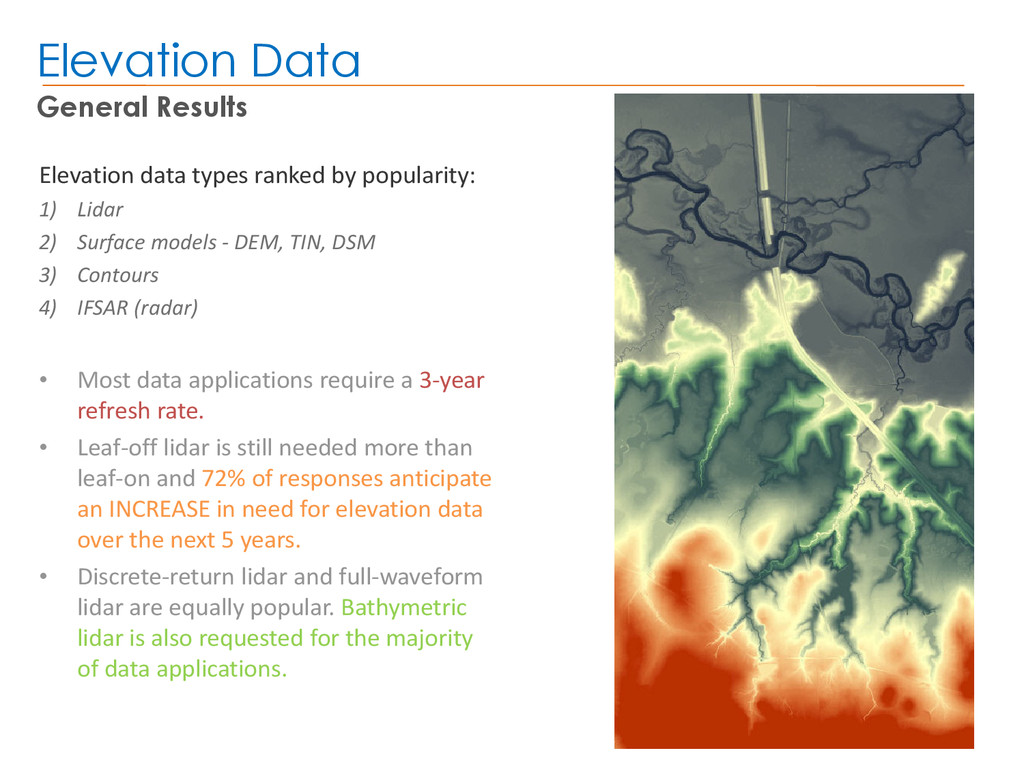
1) Lidar 2) Surface models - DEM, TIN, DSM 3) Contours 4) IFSAR (radar) • Most data applications require a 3-year refresh rate. • Leaf-off lidar is still needed more than leaf-on and 72% of responses anticipate an INCREASE in need for elevation data over the next 5 years. • Discrete-return lidar and full-waveform lidar are equally popular. Bathymetric lidar is also requested for the majority of data applications.
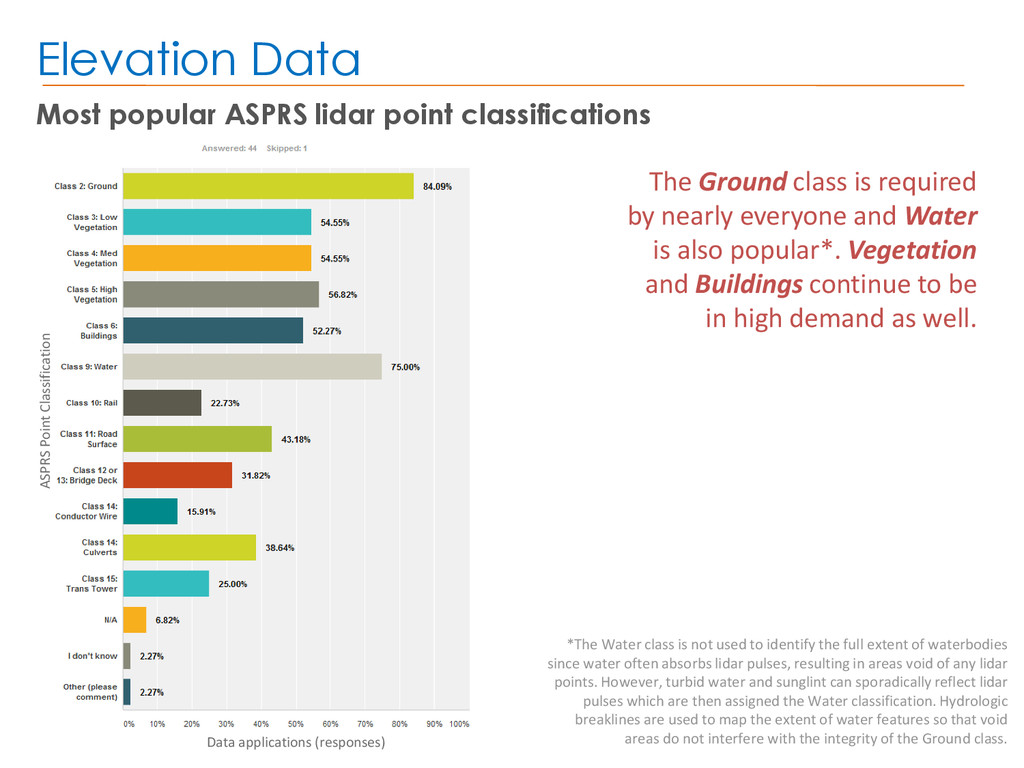
(responses) ASPRS Point Classification The Ground class is required by nearly everyone and Water is also popular*. Vegetation and Buildings continue to be in high demand as well. *The Water class is not used to identify the full extent of waterbodies since water often absorbs lidar pulses, resulting in areas void of any lidar points. However, turbid water and sunglint can sporadically reflect lidar pulses which are then assigned the Water classification. Hydrologic breaklines are used to map the extent of water features so that void areas do not interfere with the integrity of the Ground class.
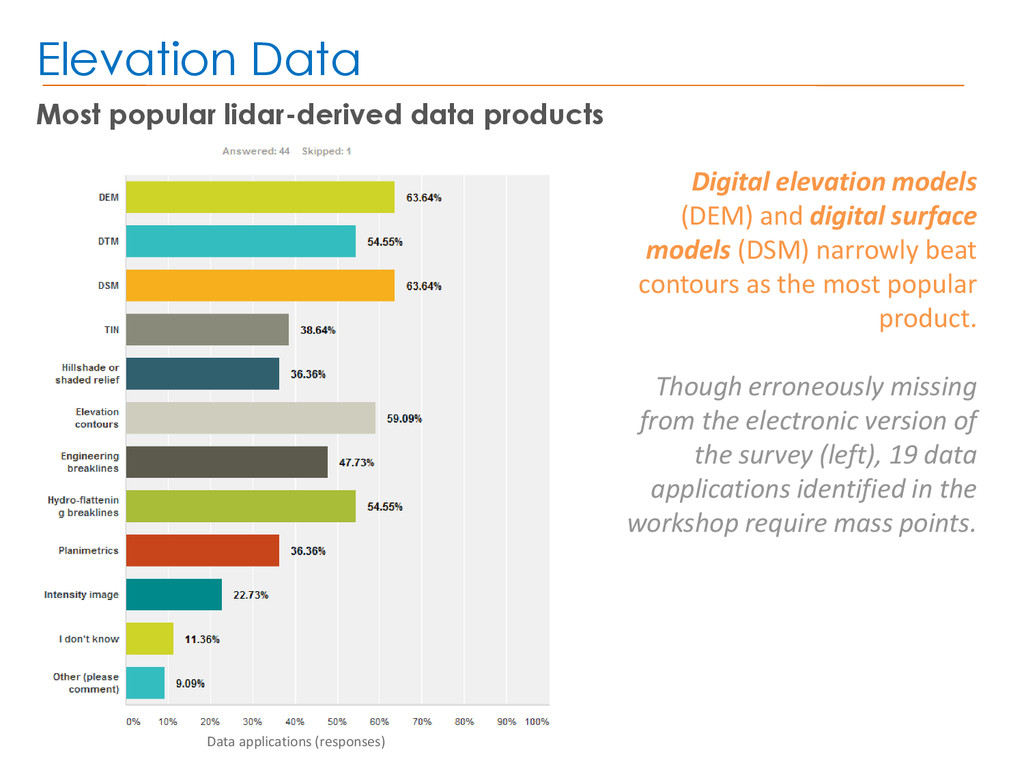
Digital elevation models (DEM) and digital surface models (DSM) narrowly beat contours as the most popular product. Though erroneously missing from the electronic version of the survey (left), 19 data applications identified in the workshop require mass points.
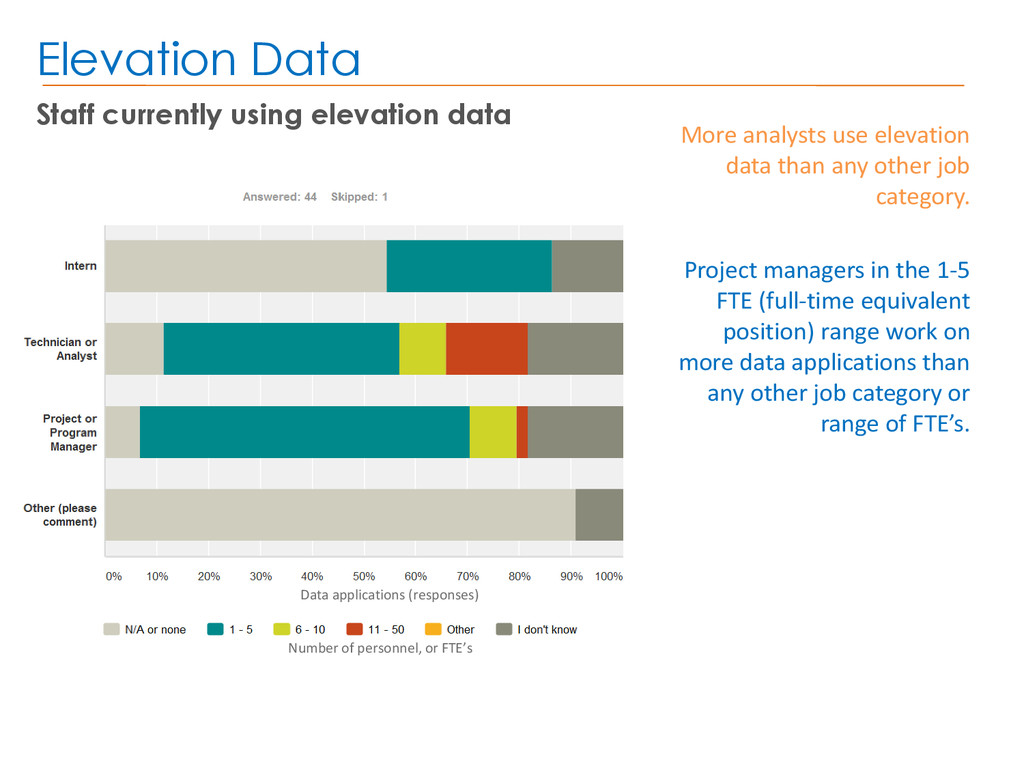
Project managers in the 1-5 FTE (full-time equivalent position) range work on more data applications than any other job category or range of FTE’s. Staff currently using elevation data Elevation Data Data applications (responses) Number of personnel, or FTE’s
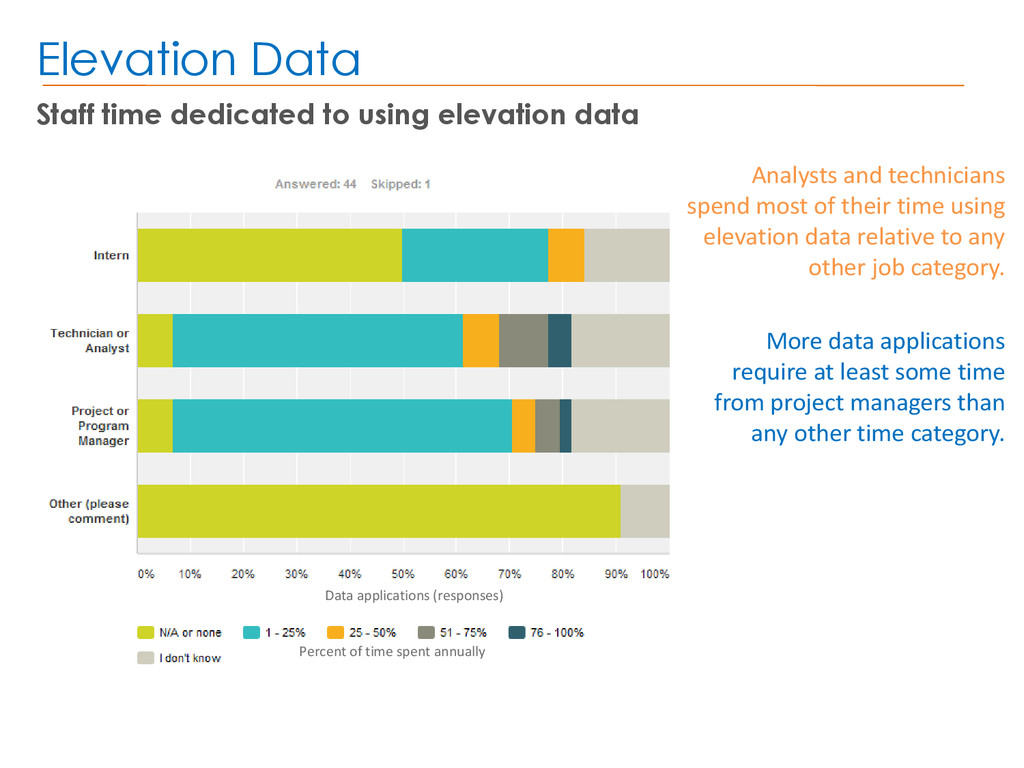
data relative to any other job category. More data applications require at least some time from project managers than any other time category. Staff time dedicated to using elevation data Elevation Data Data applications (responses) Percent of time spent annually
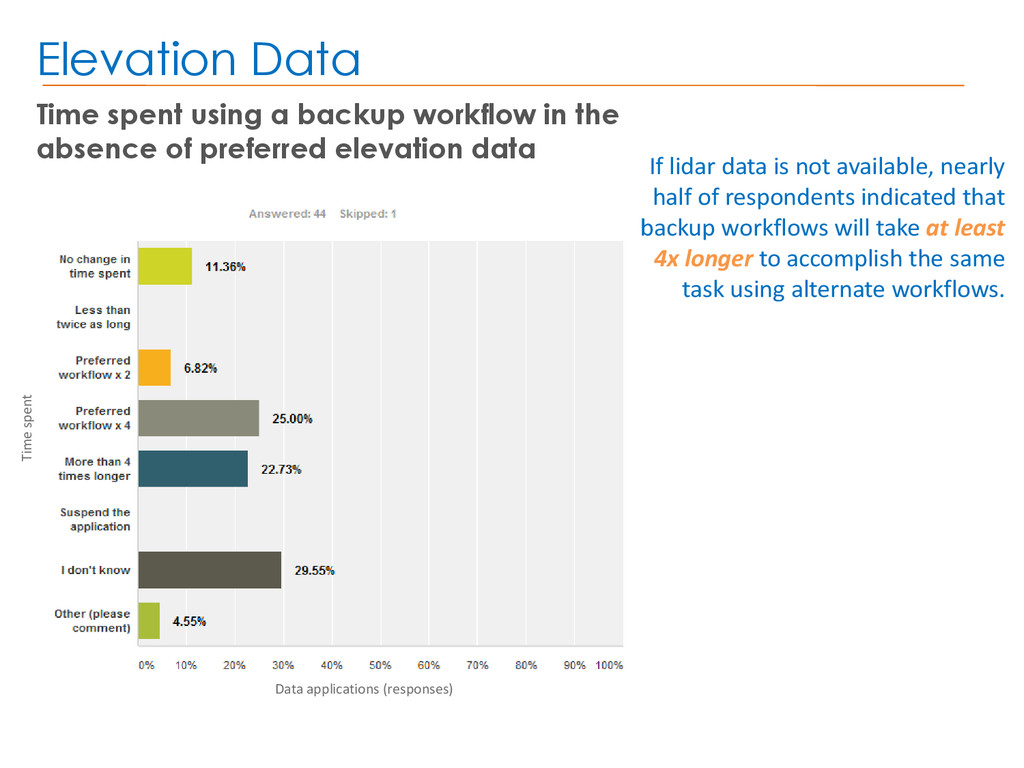
indicated that backup workflows will take at least 4x longer to accomplish the same task using alternate workflows. Time spent using a backup workflow in the absence of preferred elevation data Elevation Data Data applications (responses) Time spent
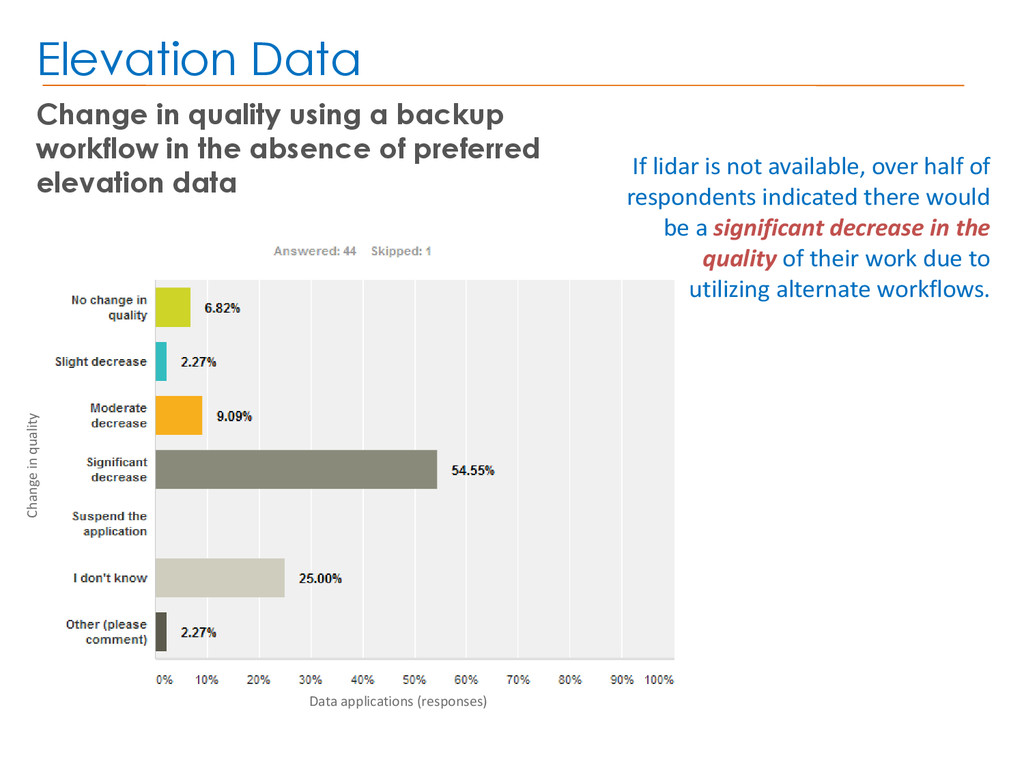
there would be a significant decrease in the quality of their work due to utilizing alternate workflows. Change in quality using a backup workflow in the absence of preferred elevation data Elevation Data Data applications (responses) Change in quality
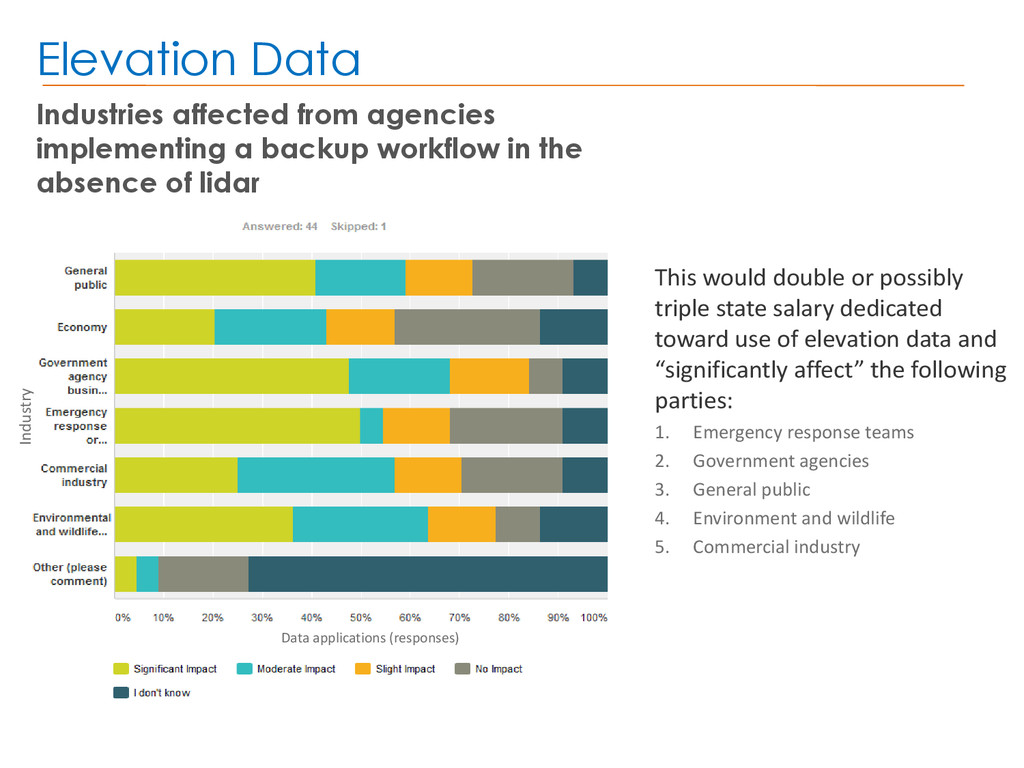
use of elevation data and “significantly affect” the following parties: 1. Emergency response teams 2. Government agencies 3. General public 4. Environment and wildlife 5. Commercial industry Industries affected from agencies implementing a backup workflow in the absence of lidar Elevation Data Data applications (responses) Industry
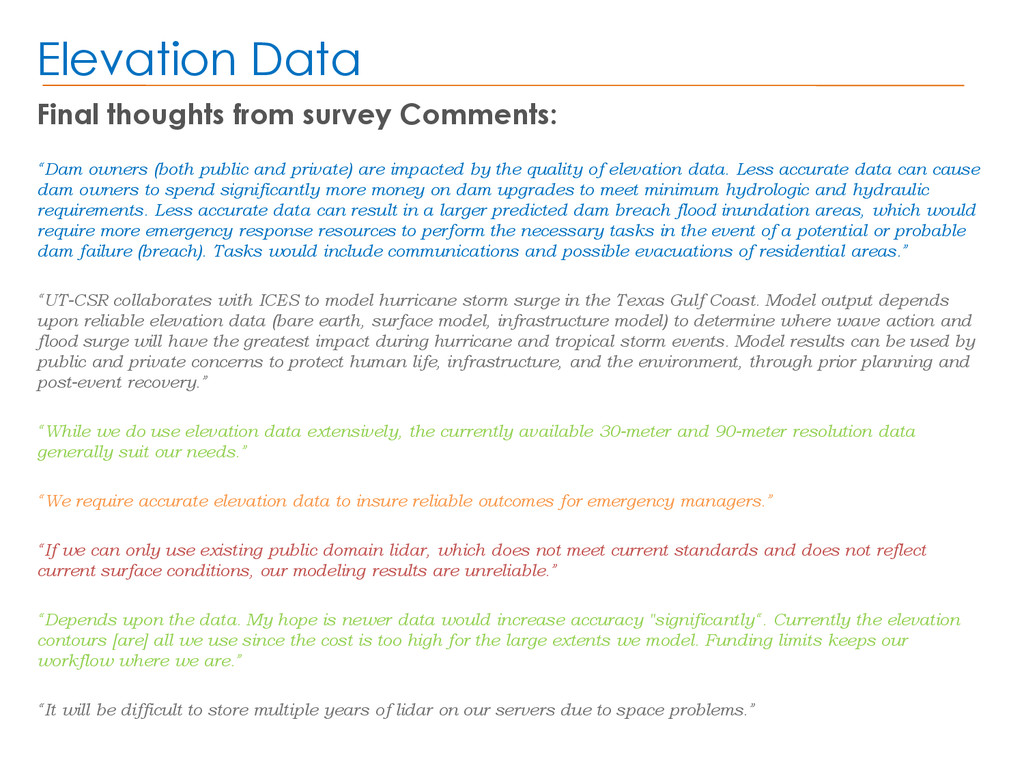
quality of elevation data. Less accurate data can cause dam owners to spend significantly more money on dam upgrades to meet minimum hydrologic and hydraulic requirements. Less accurate data can result in a larger predicted dam breach flood inundation areas, which would require more emergency response resources to perform the necessary tasks in the event of a potential or probable dam failure (breach). Tasks would include communications and possible evacuations of residential areas.” “UT-CSR collaborates with ICES to model hurricane storm surge in the Texas Gulf Coast. Model output depends upon reliable elevation data (bare earth, surface model, infrastructure model) to determine where wave action and flood surge will have the greatest impact during hurricane and tropical storm events. Model results can be used by public and private concerns to protect human life, infrastructure, and the environment, through prior planning and post-event recovery.” “While we do use elevation data extensively, the currently available 30-meter and 90-meter resolution data generally suit our needs.” “We require accurate elevation data to insure reliable outcomes for emergency managers.” “If we can only use existing public domain lidar, which does not meet current standards and does not reflect current surface conditions, our modeling results are unreliable.” “Depends upon the data. My hope is newer data would increase accuracy "significantly“. Currently the elevation contours [are] all we use since the cost is too high for the large extents we model. Funding limits keeps our workflow where we are.” “It will be difficult to store multiple years of lidar on our servers due to space problems.” Final thoughts from survey Comments: Elevation Data
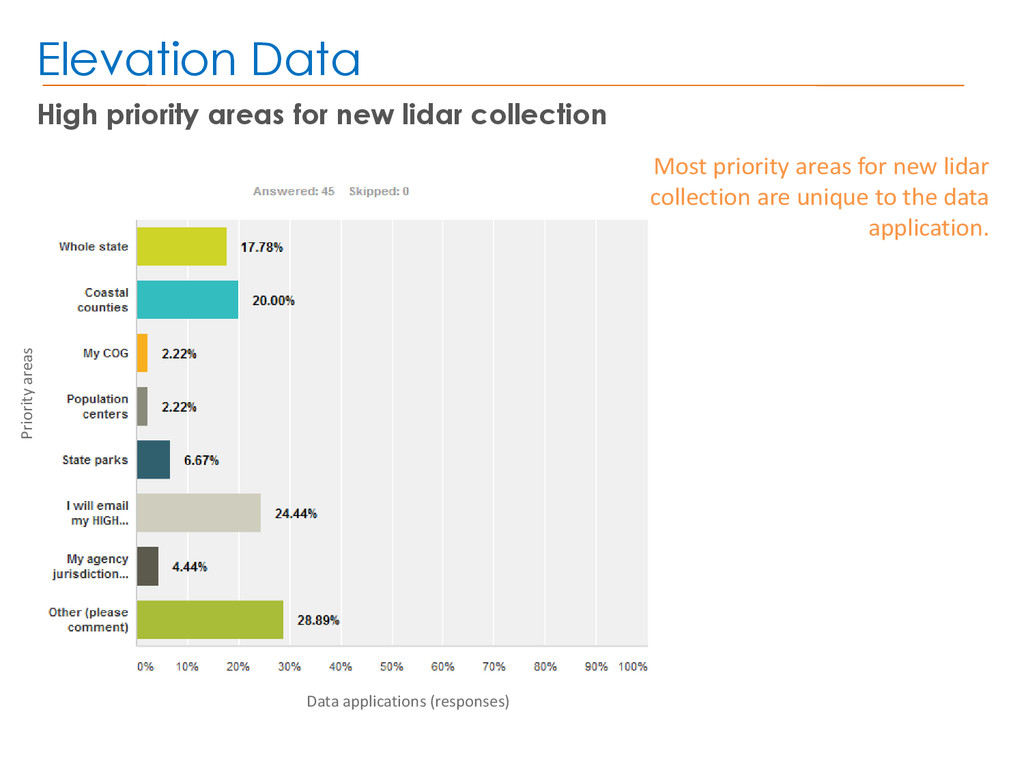
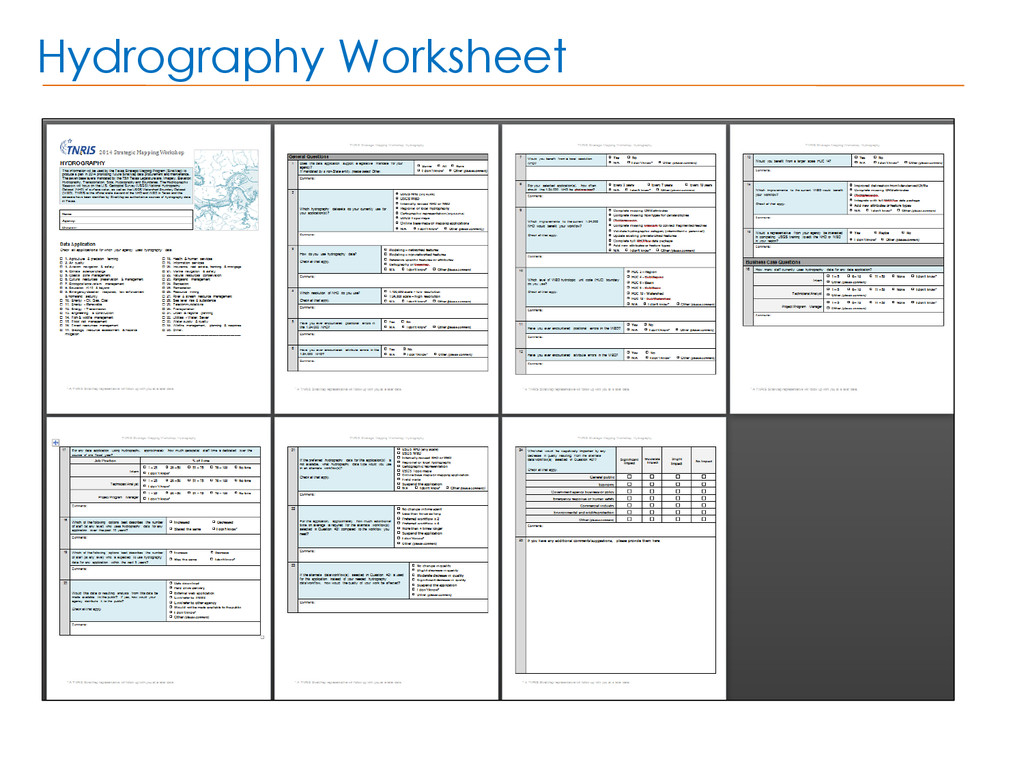
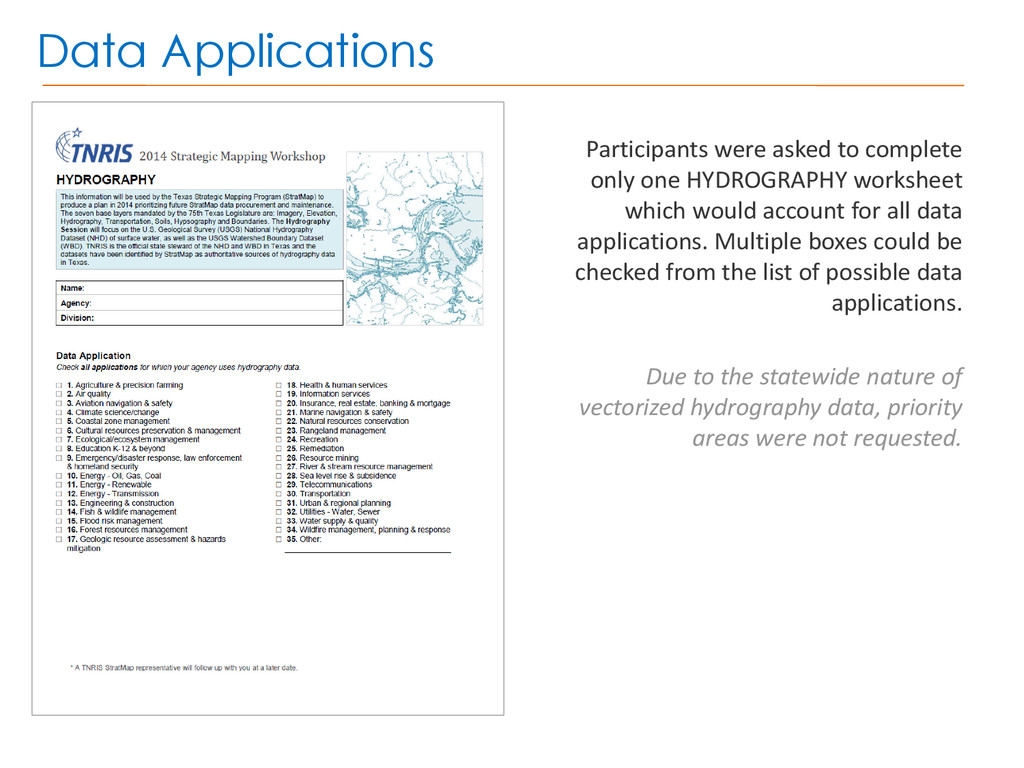
worksheet which would account for all data applications. Multiple boxes could be checked from the list of possible data applications. Due to the statewide nature of vectorized hydrography data, priority areas were not requested.
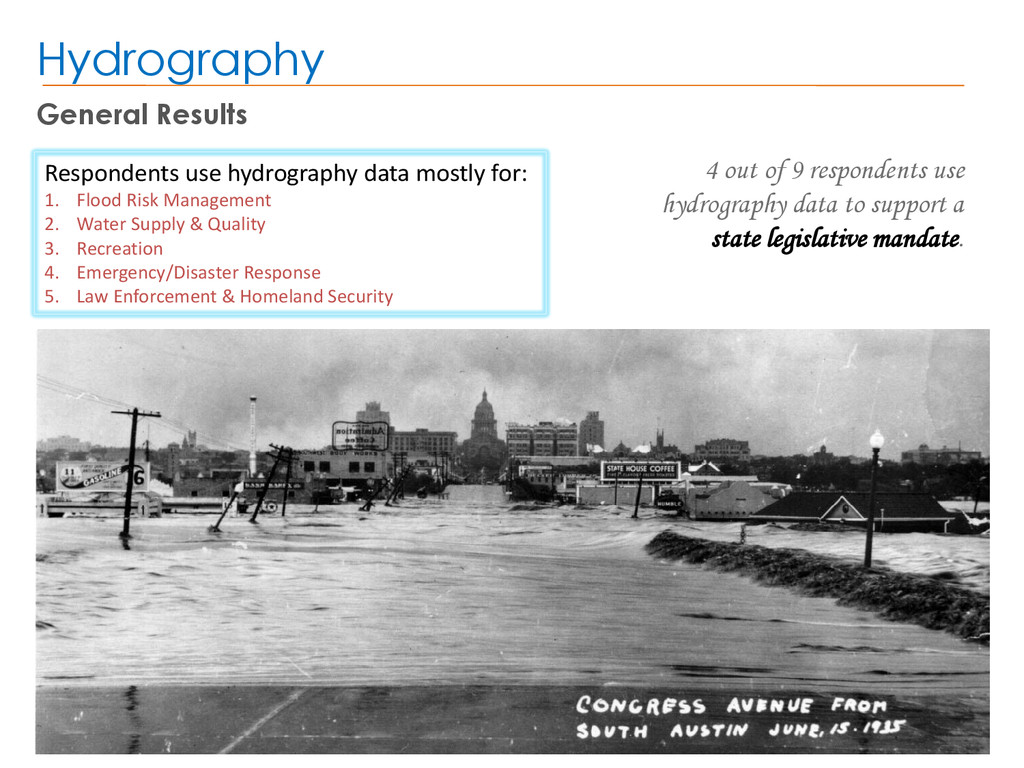
2. Water Supply & Quality 3. Recreation 4. Emergency/Disaster Response 5. Law Enforcement & Homeland Security 4 out of 9 respondents use hydrography data to support a state legislative mandate. General Results Hydrography
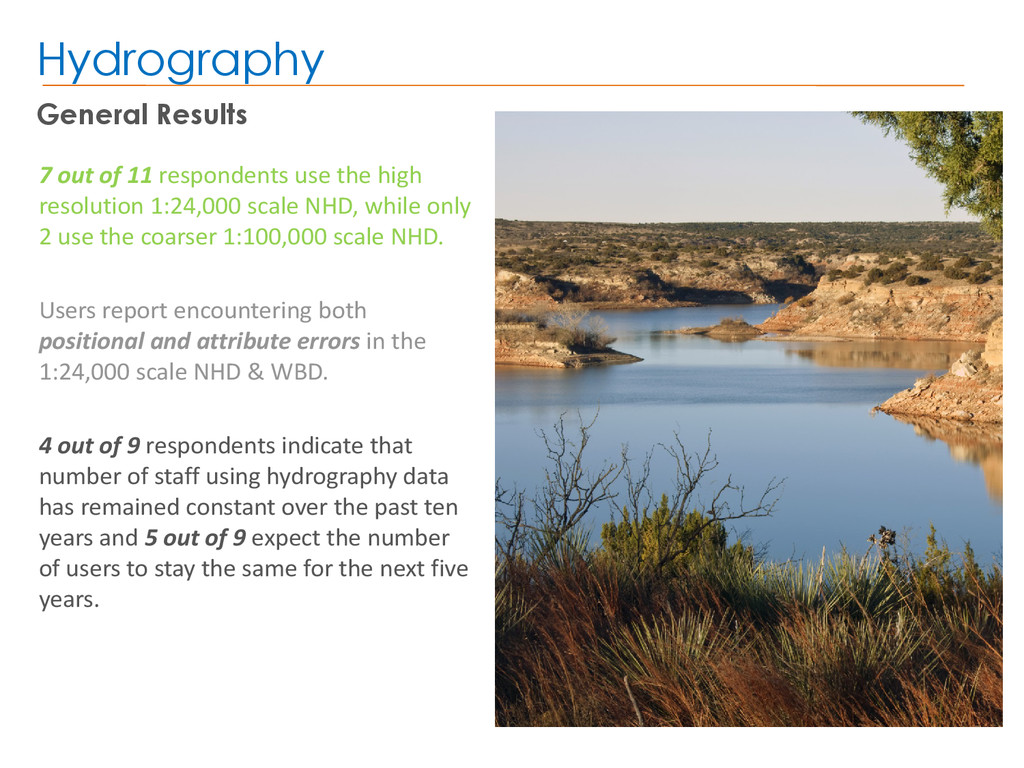
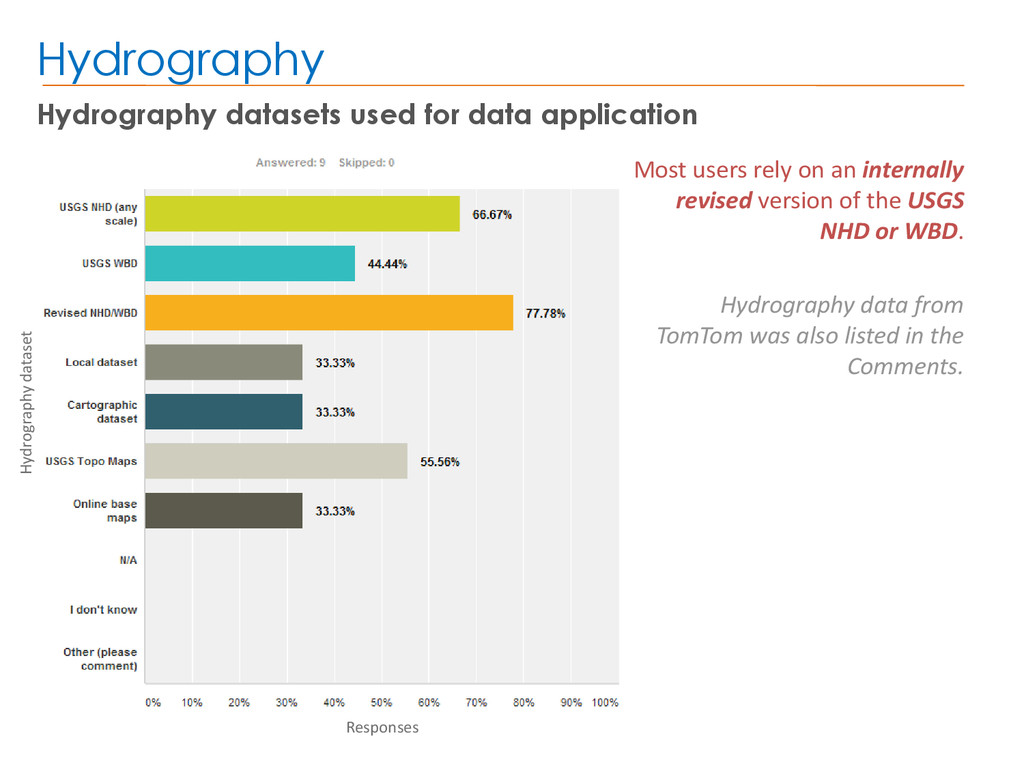
scale NHD, while only 2 use the coarser 1:100,000 scale NHD. Users report encountering both positional and attribute errors in the 1:24,000 scale NHD & WBD. 4 out of 9 respondents indicate that number of staff using hydrography data has remained constant over the past ten years and 5 out of 9 expect the number of users to stay the same for the next five years. General Results Hydrography
USGS NHD or WBD. Hydrography data from TomTom was also listed in the Comments. Hydrography datasets used for data application Hydrography Responses Hydrography dataset
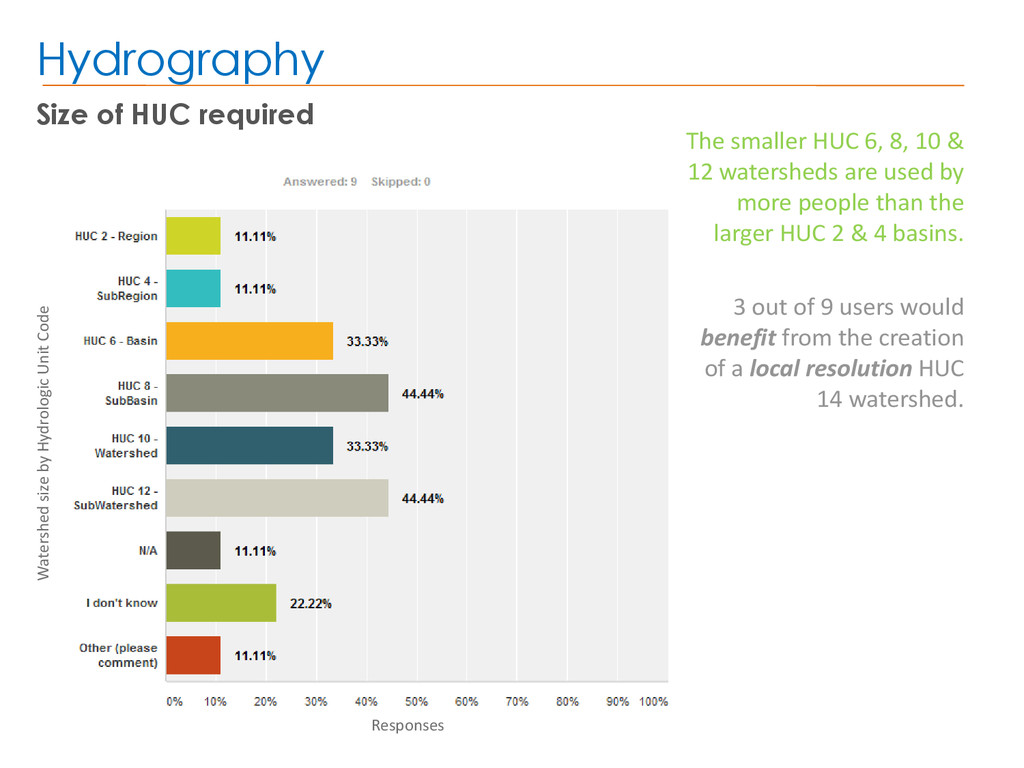
Unit Code The smaller HUC 6, 8, 10 & 12 watersheds are used by more people than the larger HUC 2 & 4 basins. 3 out of 9 users would benefit from the creation of a local resolution HUC 14 watershed.
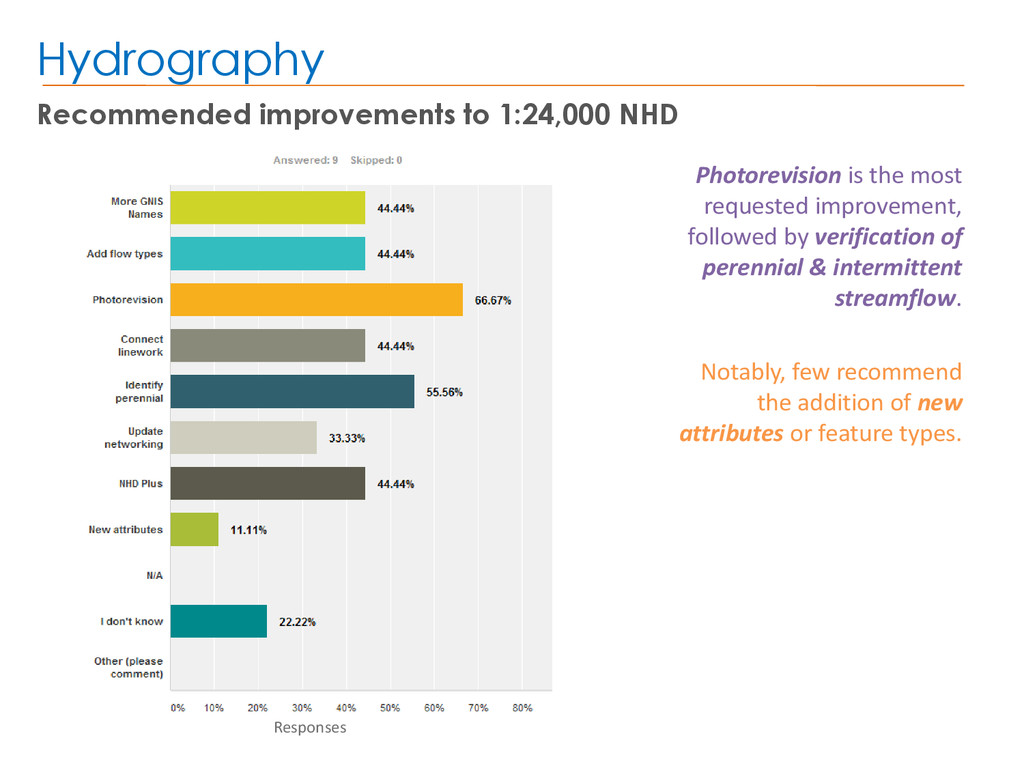
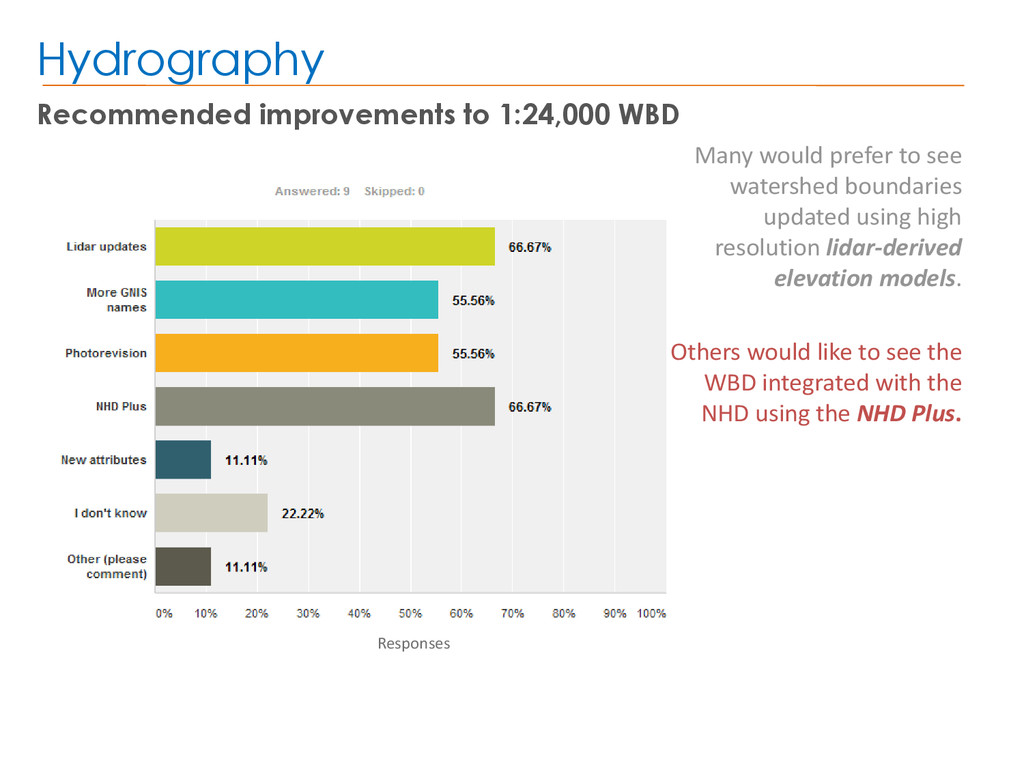
most requested improvement, followed by verification of perennial & intermittent streamflow. Notably, few recommend the addition of new attributes or feature types.
to see watershed boundaries updated using high resolution lidar-derived elevation models. Others would like to see the WBD integrated with the NHD using the NHD Plus.
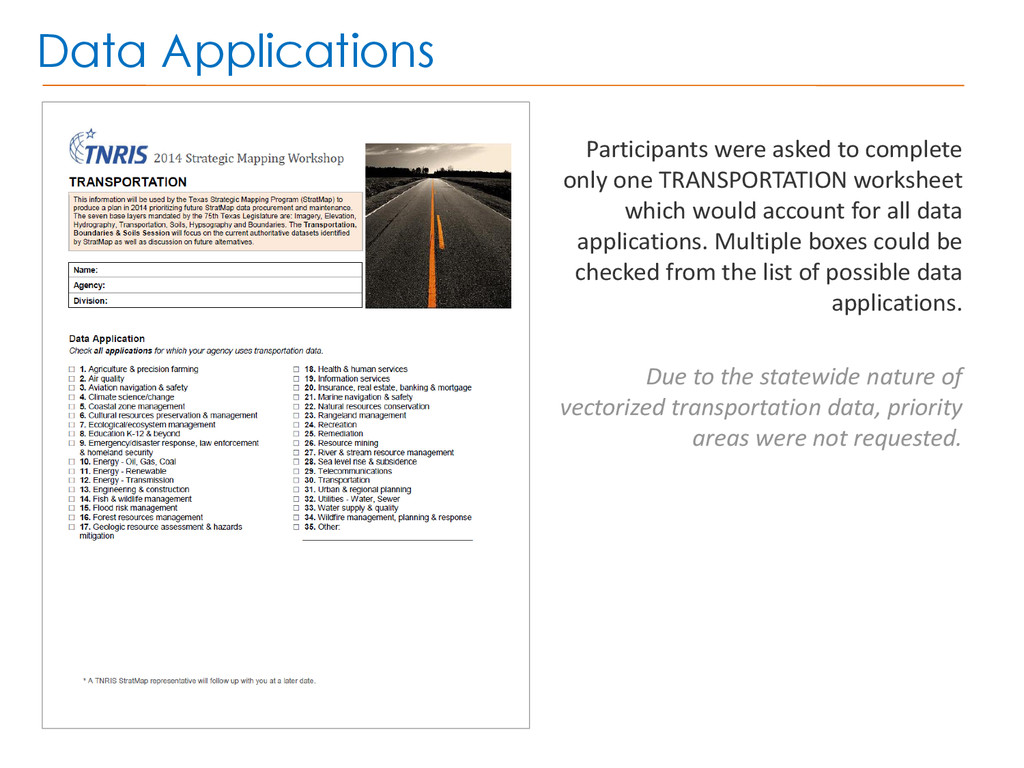
worksheet which would account for all data applications. Multiple boxes could be checked from the list of possible data applications. Due to the statewide nature of vectorized transportation data, priority areas were not requested.
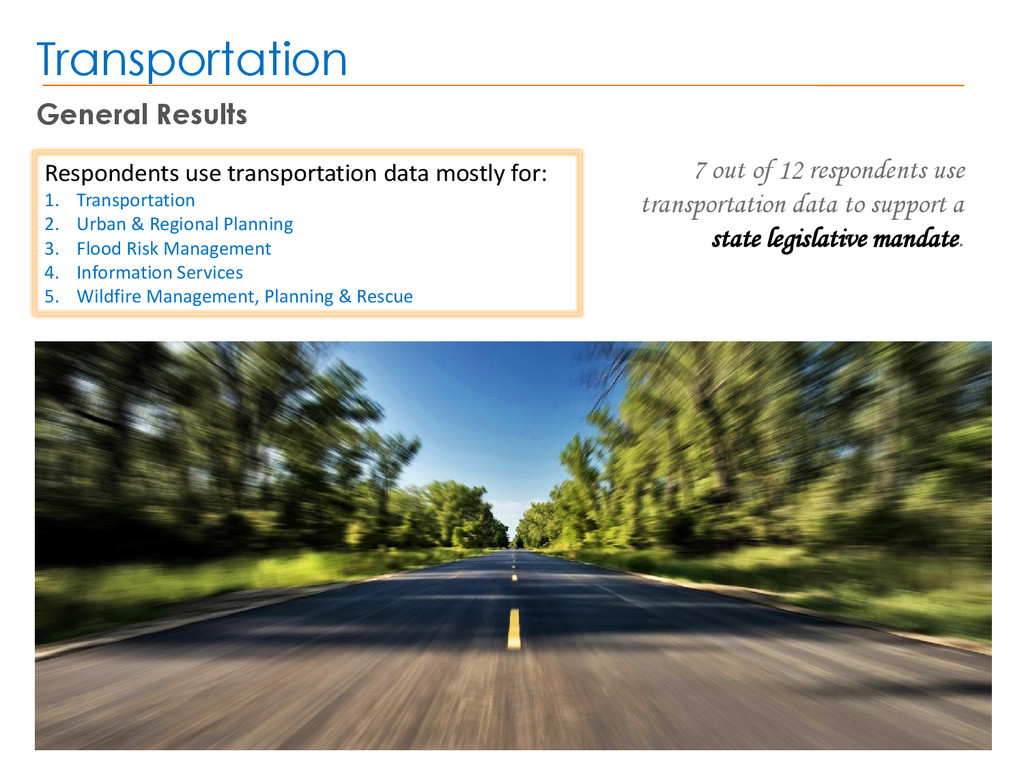
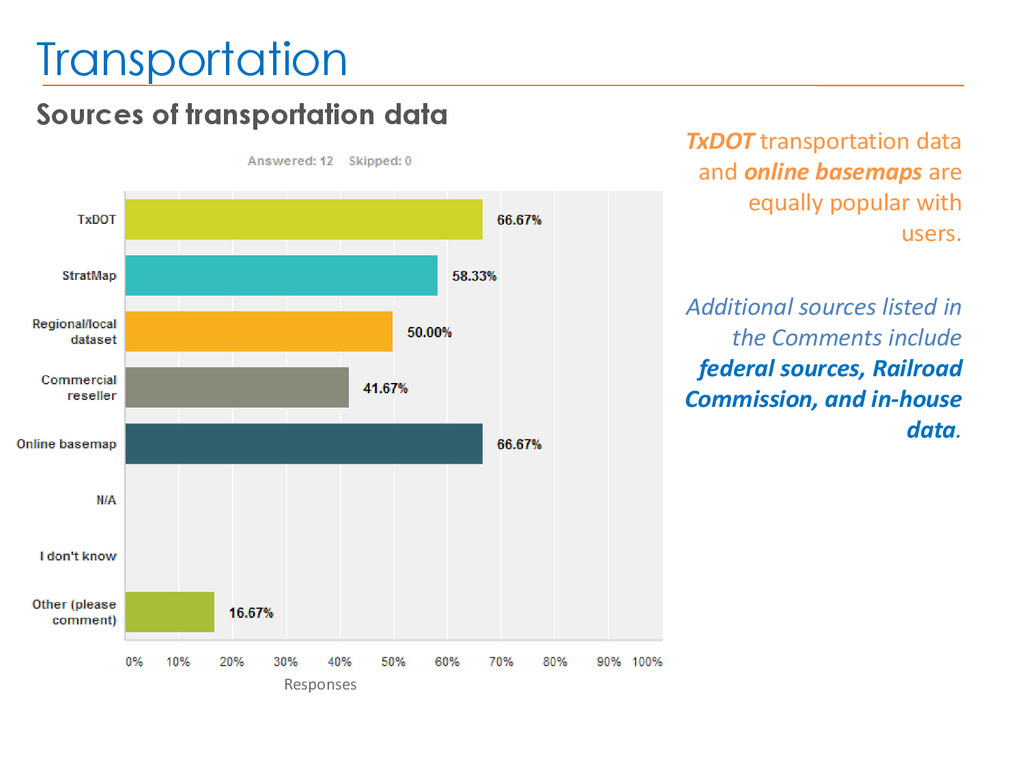
& Regional Planning 3. Flood Risk Management 4. Information Services 5. Wildfire Management, Planning & Rescue 7 out of 12 respondents use transportation data to support a state legislative mandate. General Results Transportation
online basemaps are equally popular with users. Additional sources listed in the Comments include federal sources, Railroad Commission, and in-house data.
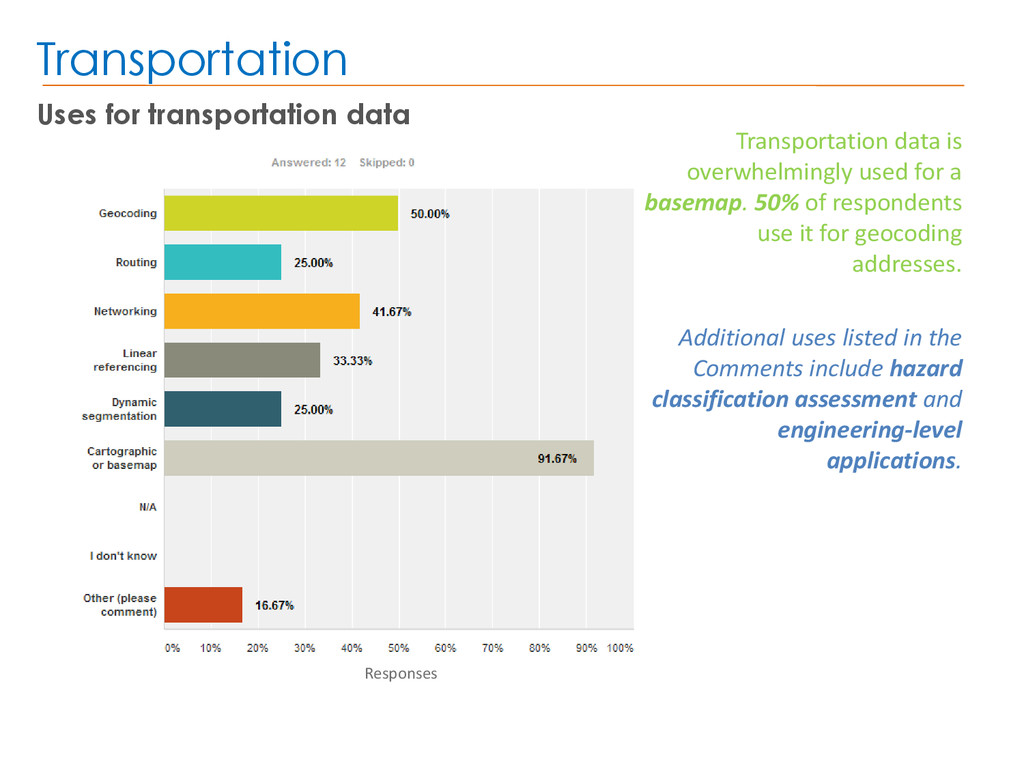
used for a basemap. 50% of respondents use it for geocoding addresses. Additional uses listed in the Comments include hazard classification assessment and engineering-level applications.
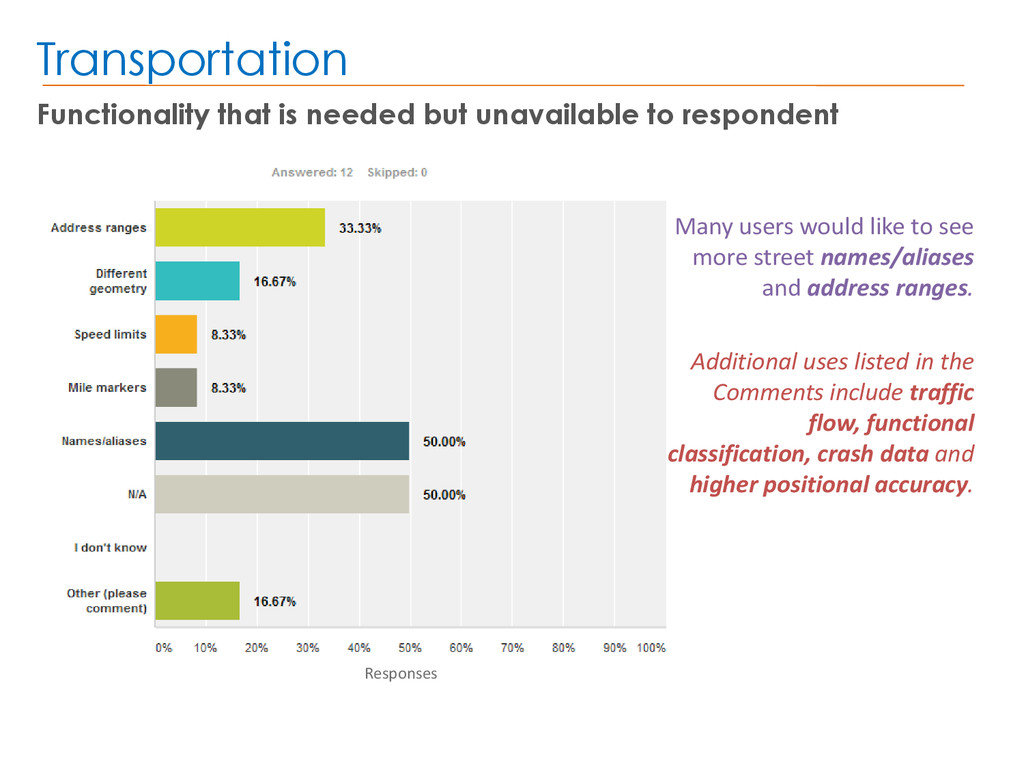
Many users would like to see more street names/aliases and address ranges. Additional uses listed in the Comments include traffic flow, functional classification, crash data and higher positional accuracy.
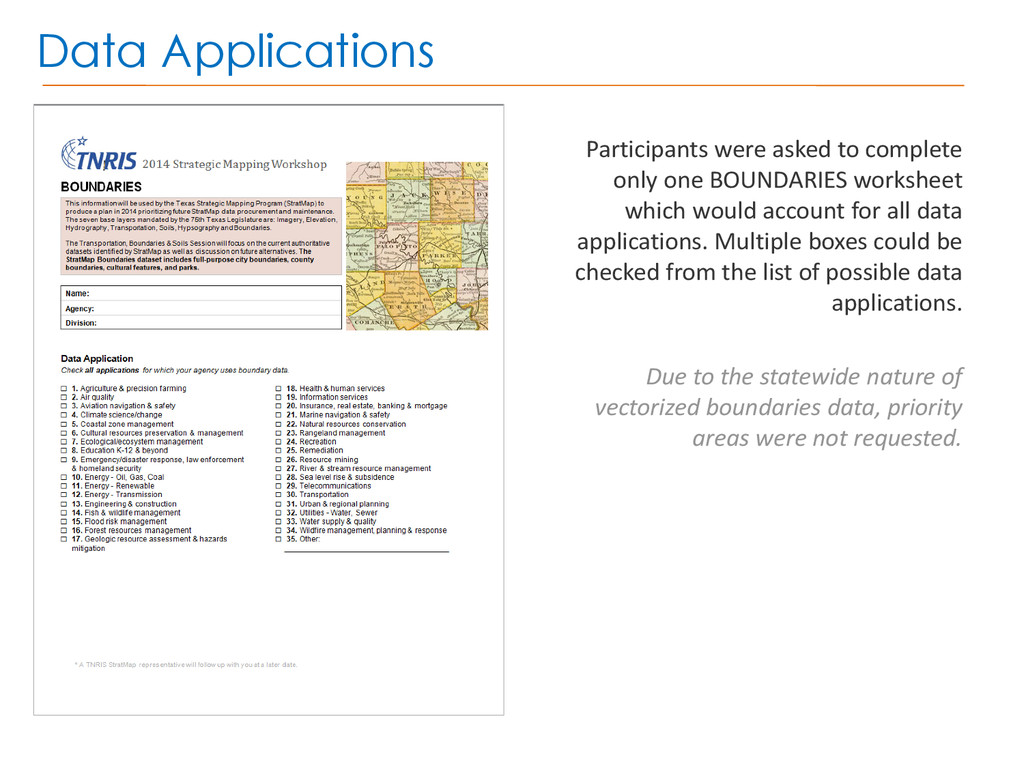
worksheet which would account for all data applications. Multiple boxes could be checked from the list of possible data applications. Due to the statewide nature of vectorized boundaries data, priority areas were not requested.
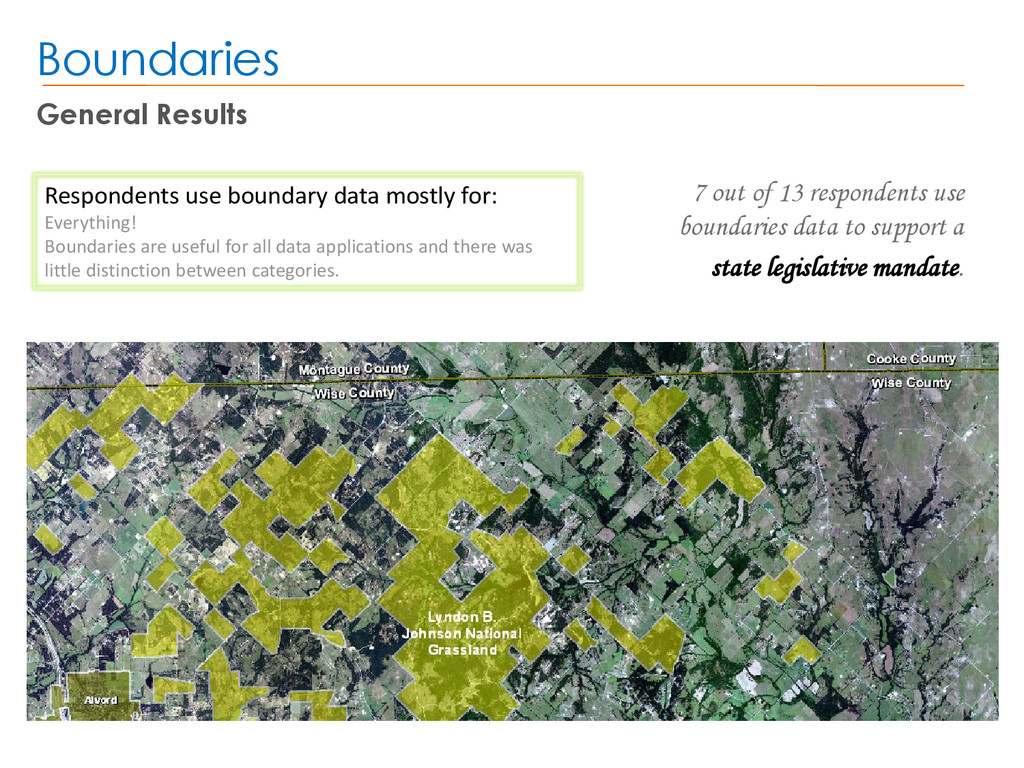
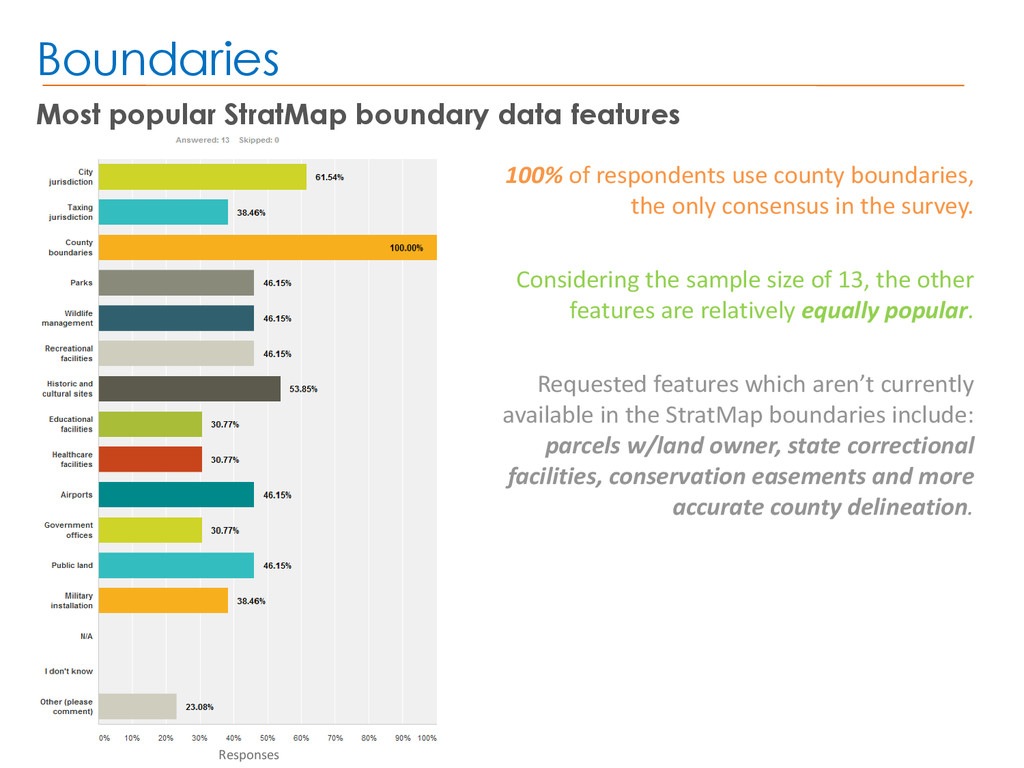
for all data applications and there was little distinction between categories. 7 out of 13 respondents use boundaries data to support a state legislative mandate. General Results Boundaries
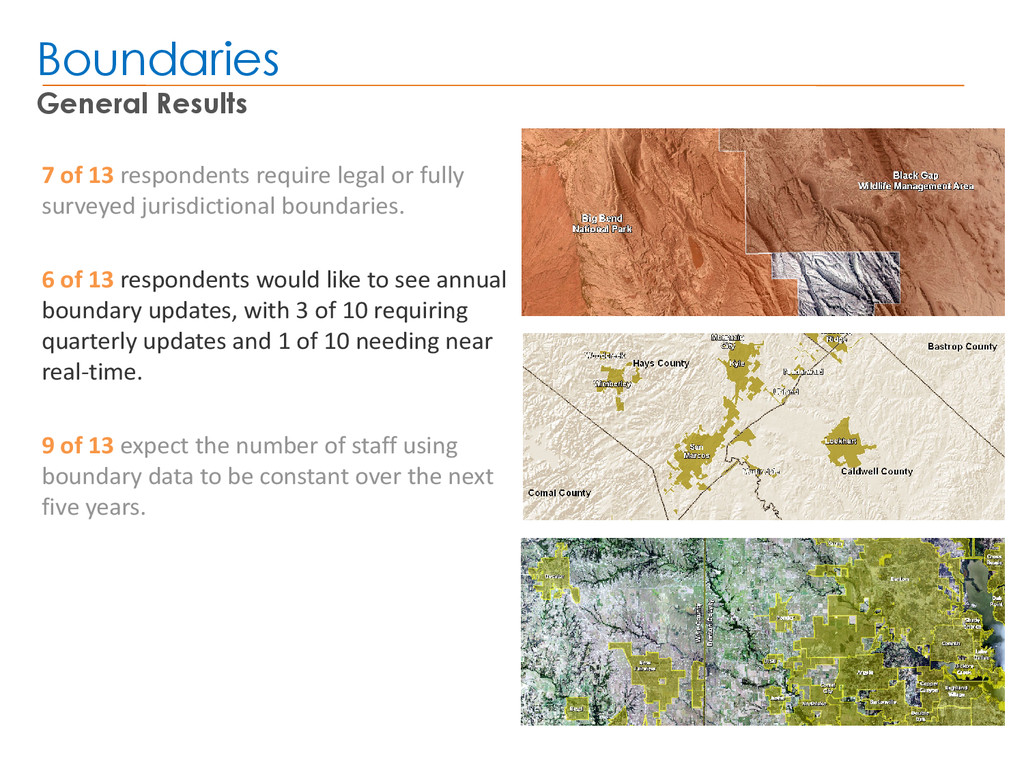
fully surveyed jurisdictional boundaries. 6 of 13 respondents would like to see annual boundary updates, with 3 of 10 requiring quarterly updates and 1 of 10 needing near real-time. 9 of 13 expect the number of staff using boundary data to be constant over the next five years.
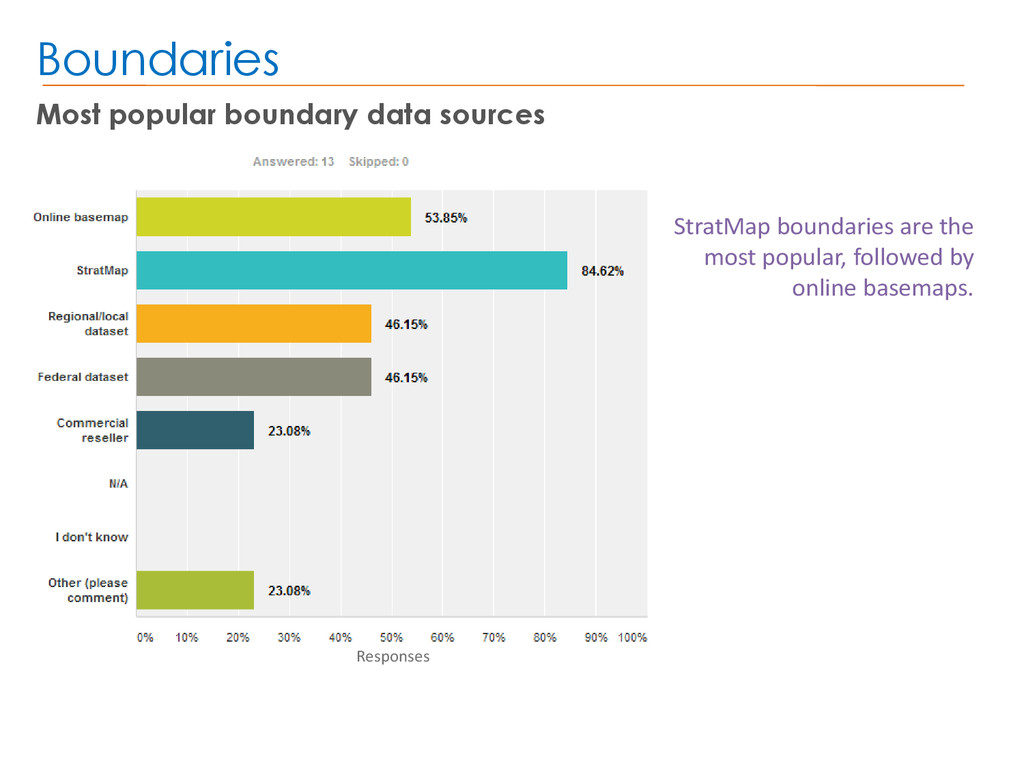
respondents use county boundaries, the only consensus in the survey. Considering the sample size of 13, the other features are relatively equally popular. Requested features which aren’t currently available in the StratMap boundaries include: parcels w/land owner, state correctional facilities, conservation easements and more accurate county delineation.
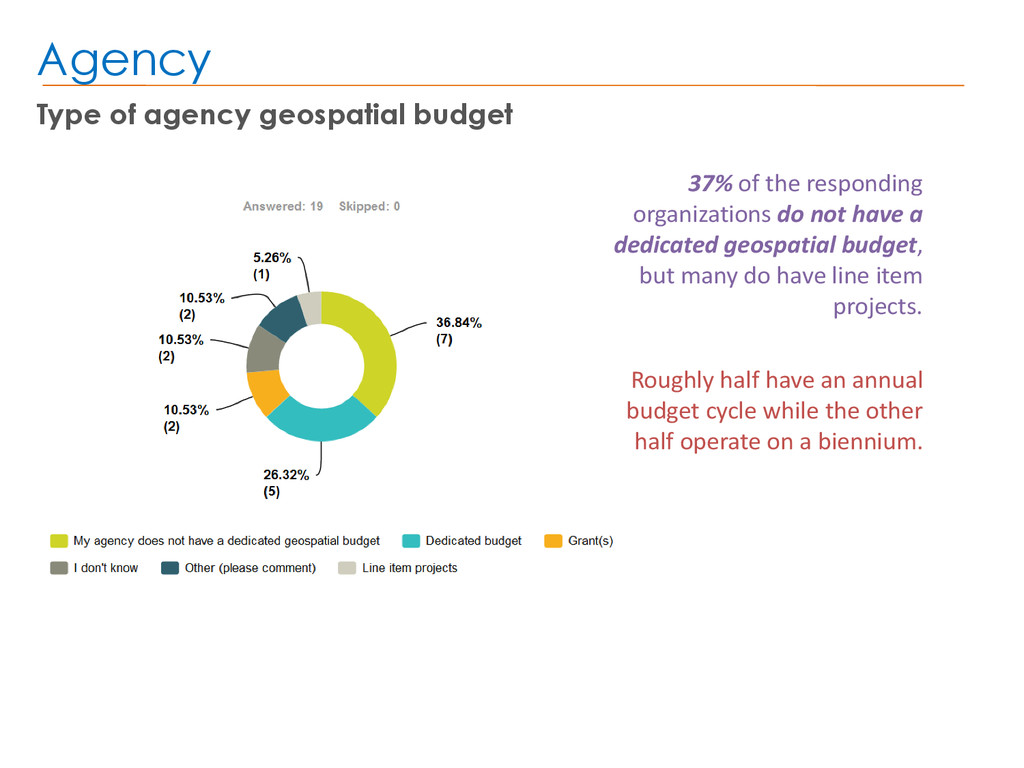
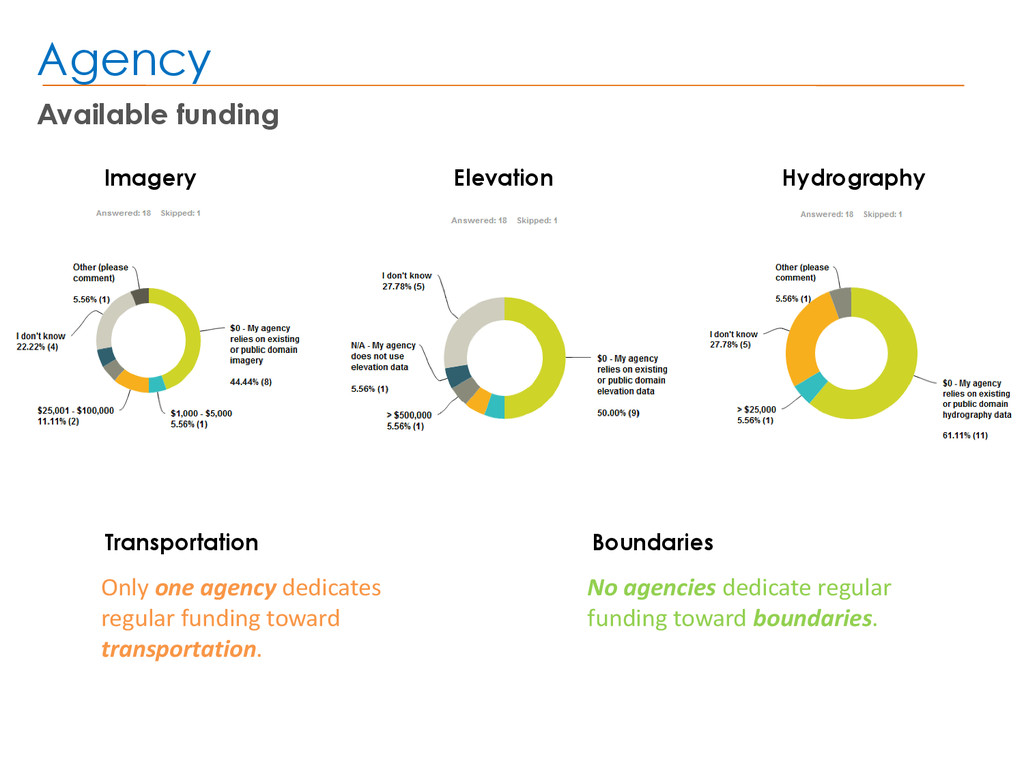
organizations do not have a dedicated geospatial budget, but many do have line item projects. Roughly half have an annual budget cycle while the other half operate on a biennium.
critical feedback about data need that will help direct the StratMap program to request appropriated funds, set priorities for data acquisition and maintenance, and coordinate new projects. The survey has shown that imagery and elevation data are critical and most entities direct any available funds toward new acquisition projects. Even with existing funding levels there is still high demand for these datasets. As such, imagery and elevation data will continue to be the focus of future StratMap efforts. Results were conclusive enough to create a new Strategic Mapping Plan which includes: 1. An overview of the StratMap program and associated data 2. Identification of need for new geospatial data based on the results of the Stakeholder Needs Assessment 3. Map of potential projects including statewide orthoimagery and new/refreshed lidar 4. Budget scenarios for funding StratMap
![Thank you! Shelby Coder PMP, GISP StratMap Program Manager [email protected]](https://files.speakerdeck.com/presentations/d57aca40320201327f252efaeef44115/slide_76.jpg)