The Annual Condition of Iowa's Community Colleges: 2009
A report on Iowa community college students and faculty during the 2008-2009 academic year. Includes a report on workforce outcomes for community college students.
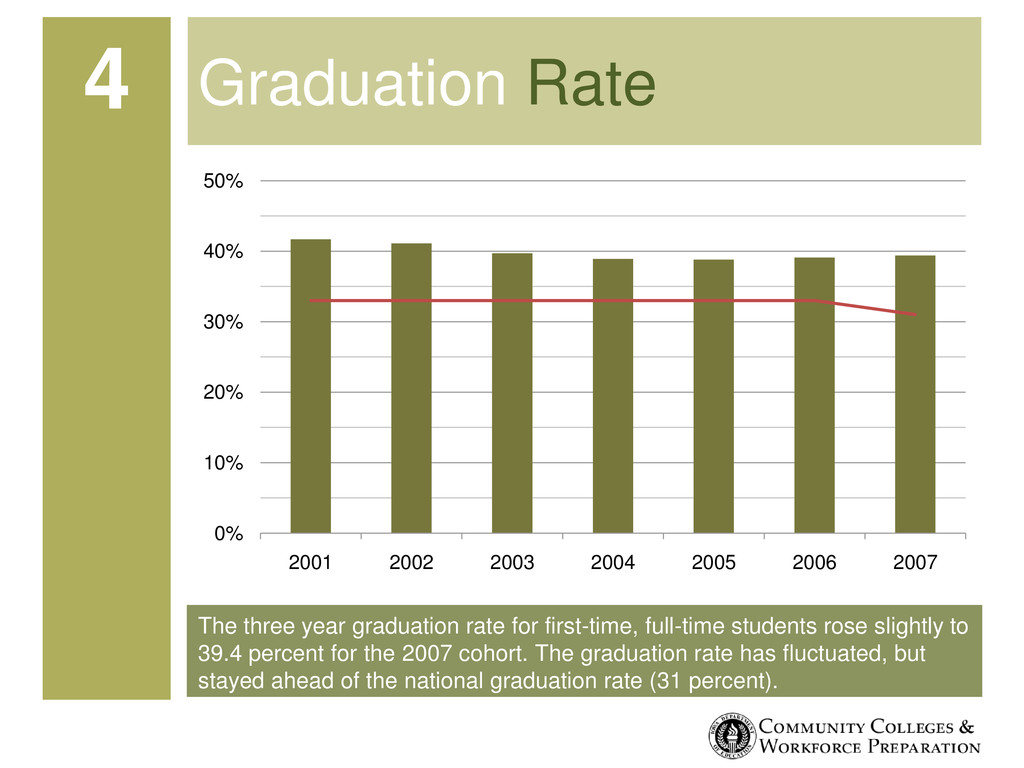
slightly to 39.4 percent for the 2007 cohort. The graduation rate has fluctuated, but stayed ahead of the national graduation rate (31 percent). Graduation Rate 4 0% 10% 20% 30% 40% 50% 2001 2002 2003 2004 2005 2006 2007
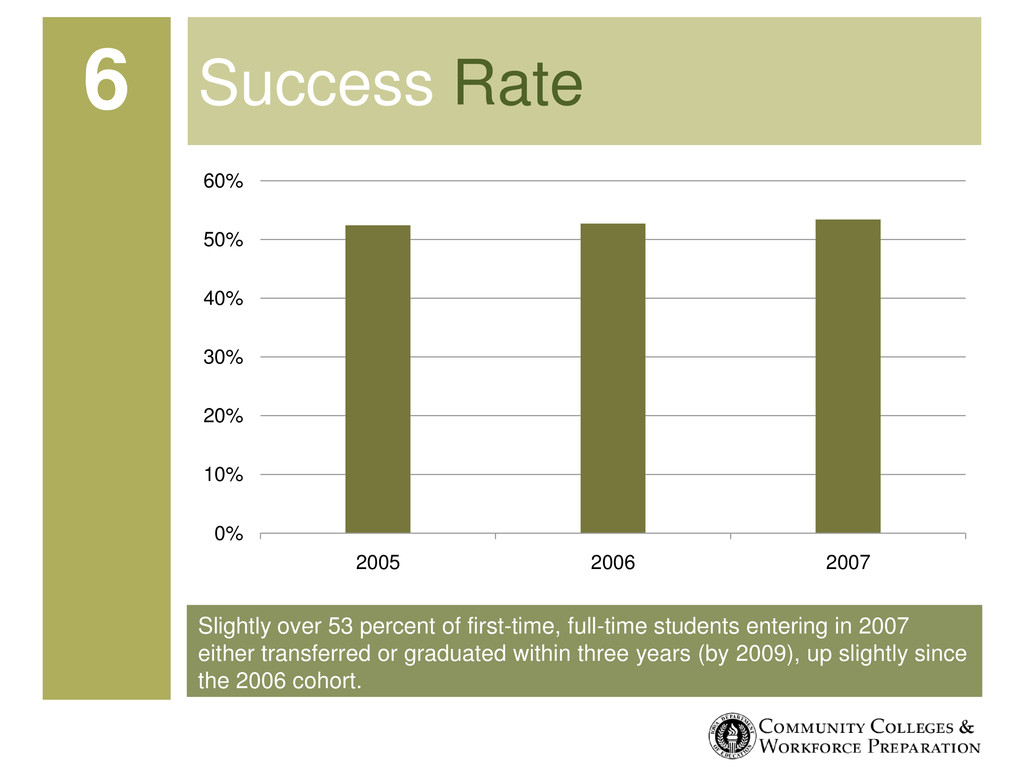
2007 either transferred or graduated within three years (by 2009), up slightly since the 2006 cohort. Success Rate 6 0% 10% 20% 30% 40% 50% 60% 2005 2006 2007
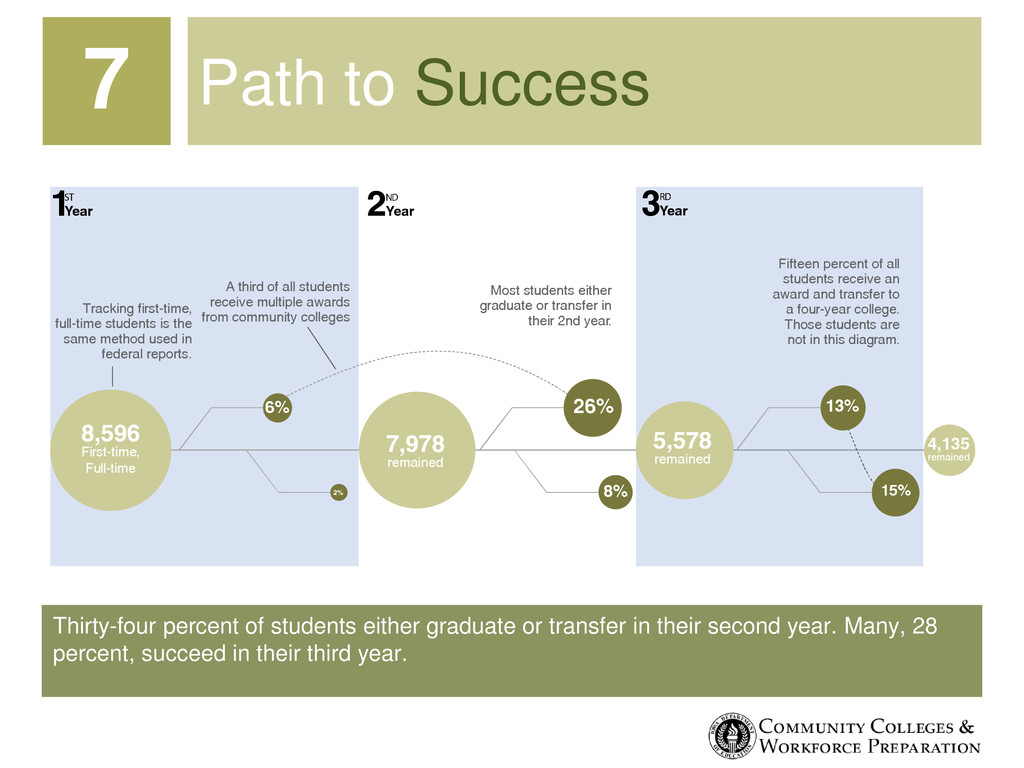
second year. Many, 28 percent, succeed in their third year. Path to Success 7 1Year Tracking first-time, full-time students is the same method used in federal reports. A third of all students receive multiple awards from community colleges Most students either graduate or transfer in their 2nd year. 6% 2% 8% 26% 13% 15% Fifteen percent of all students receive an award and transfer to a four-year college. Those students are not in this diagram. 2Year 3Year 8,596 First-time, Full-time 7,978 remained 5,578 remained 4,135 remained
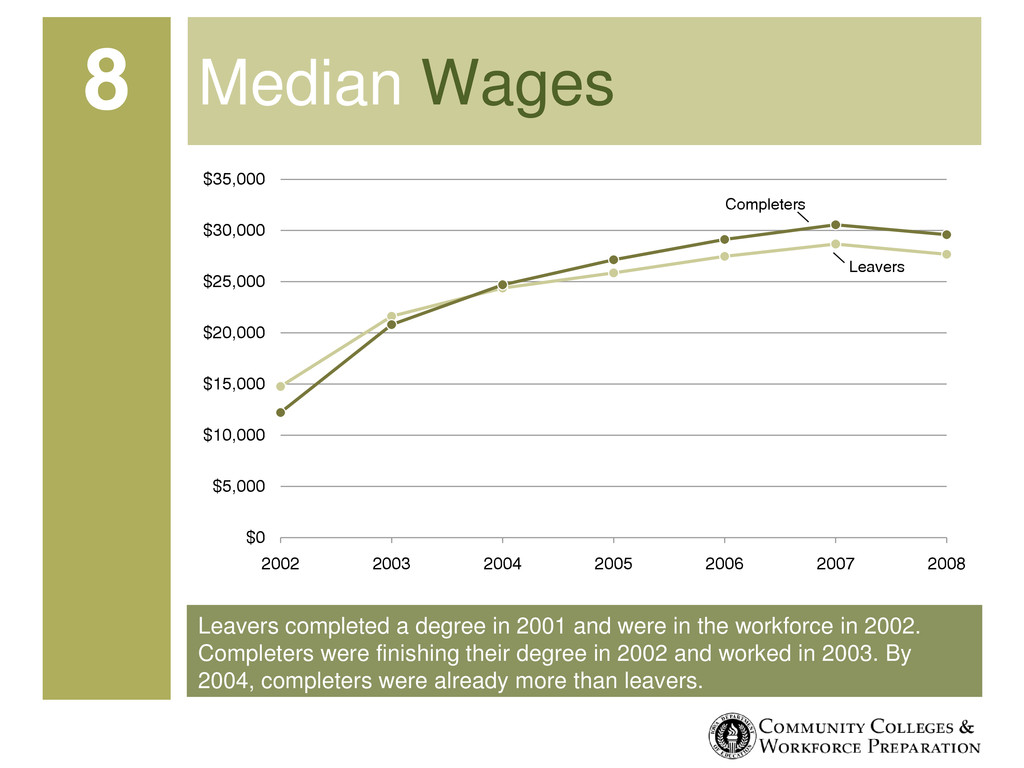
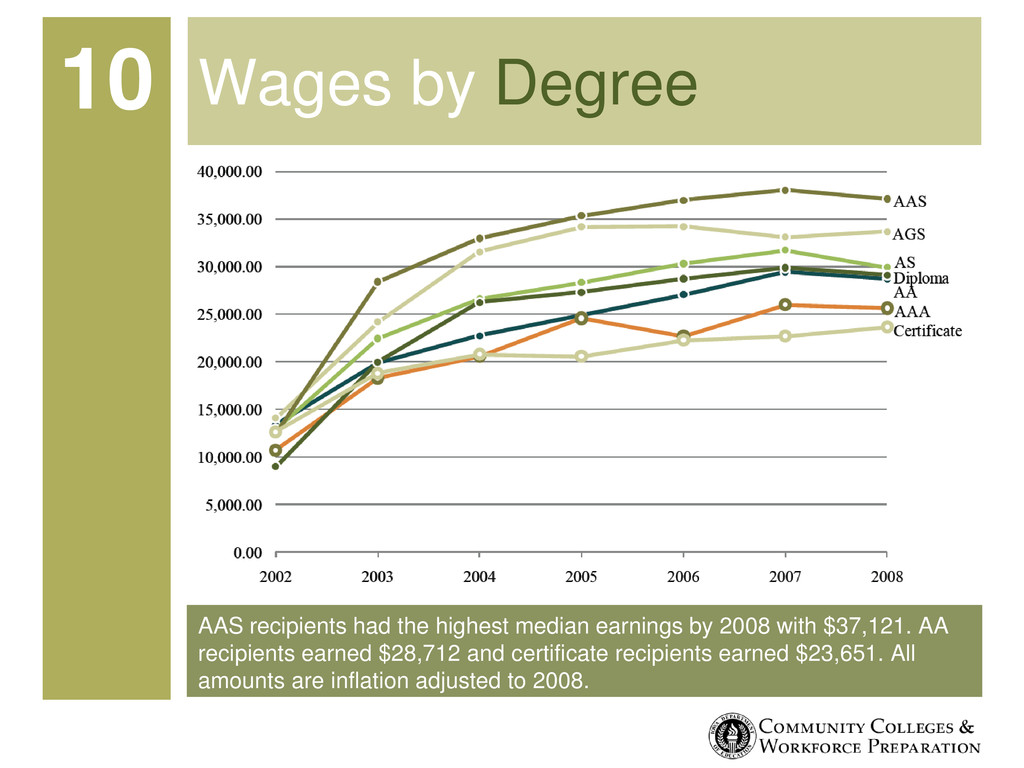
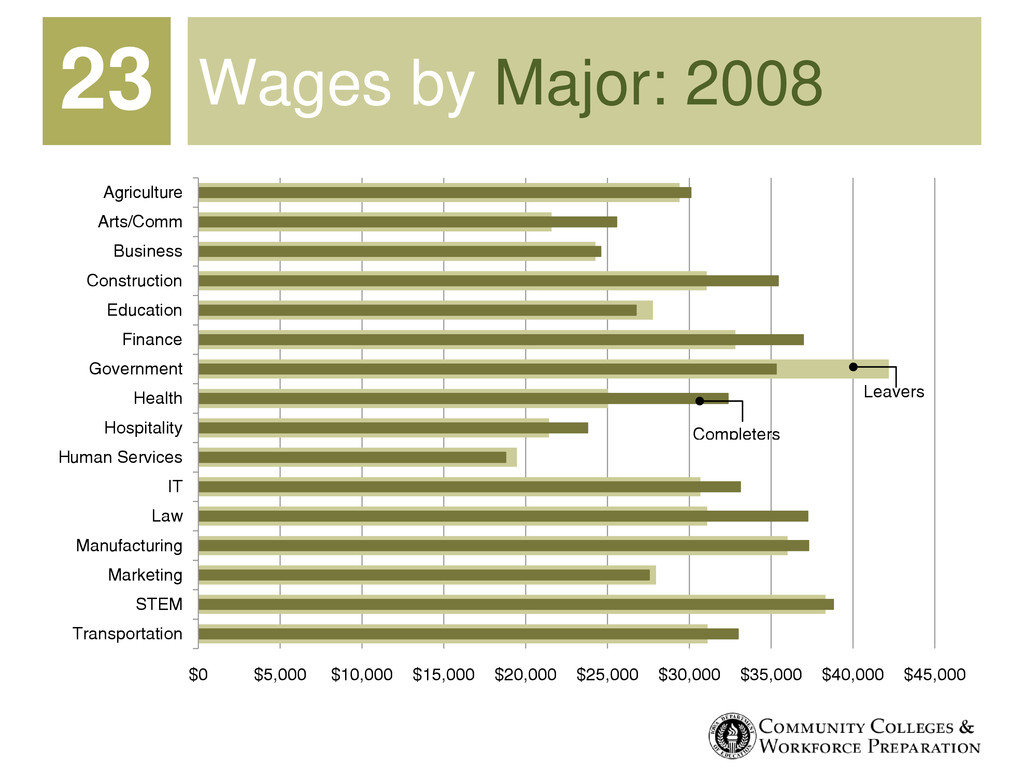
workforce in 2002. Completers were finishing their degree in 2002 and worked in 2003. By 2004, completers were already more than leavers. Median Wages 8 $0 $5,000 $10,000 $15,000 $20,000 $25,000 $30,000 $35,000 2002 2003 2004 2005 2006 2007 2008 Completers Leavers
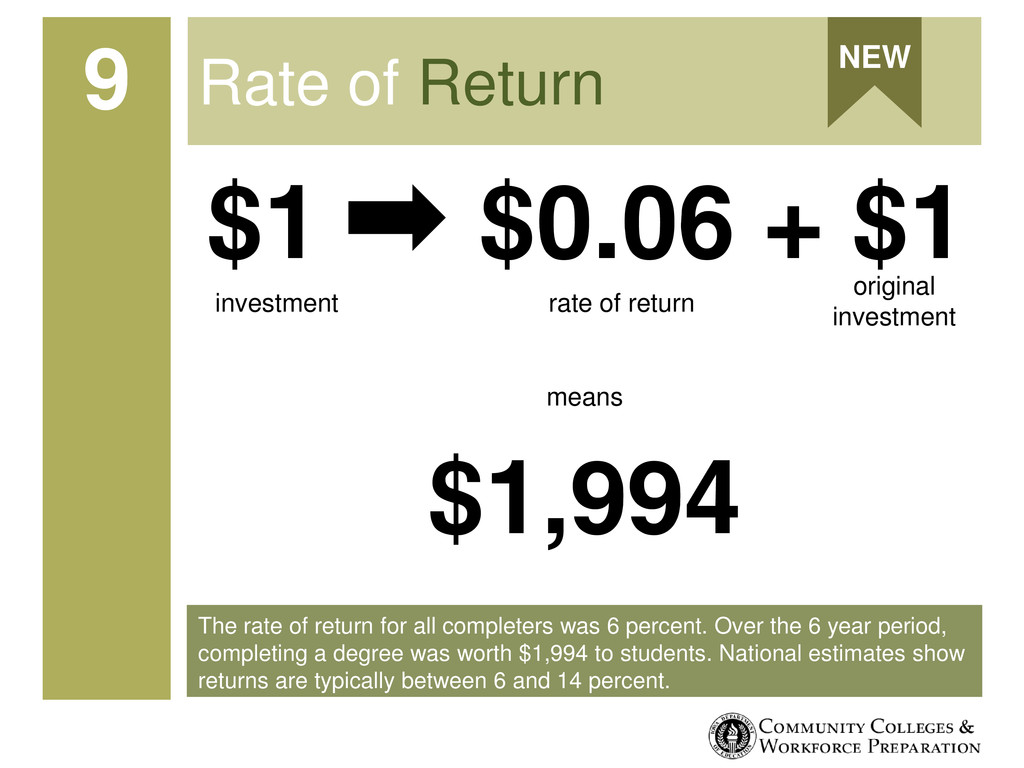
Over the 6 year period, completing a degree was worth $1,994 to students. National estimates show returns are typically between 6 and 14 percent. Rate of Return 9 NEW $1 $0.06 + $1 investment rate of return original investment $1,994 means
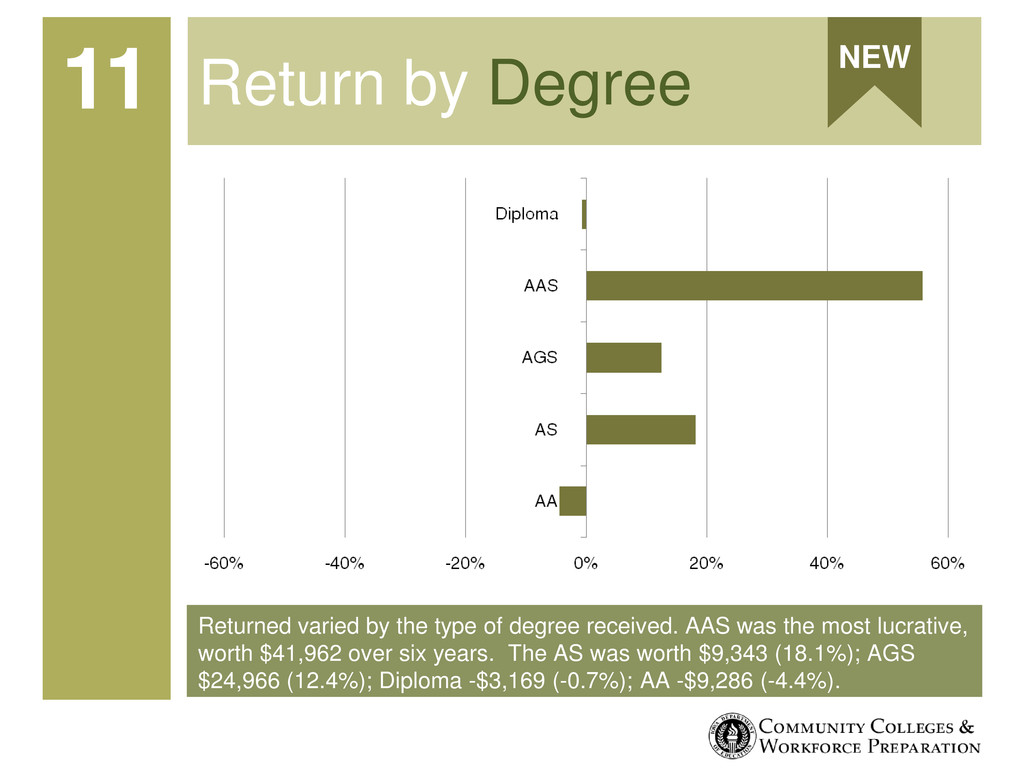
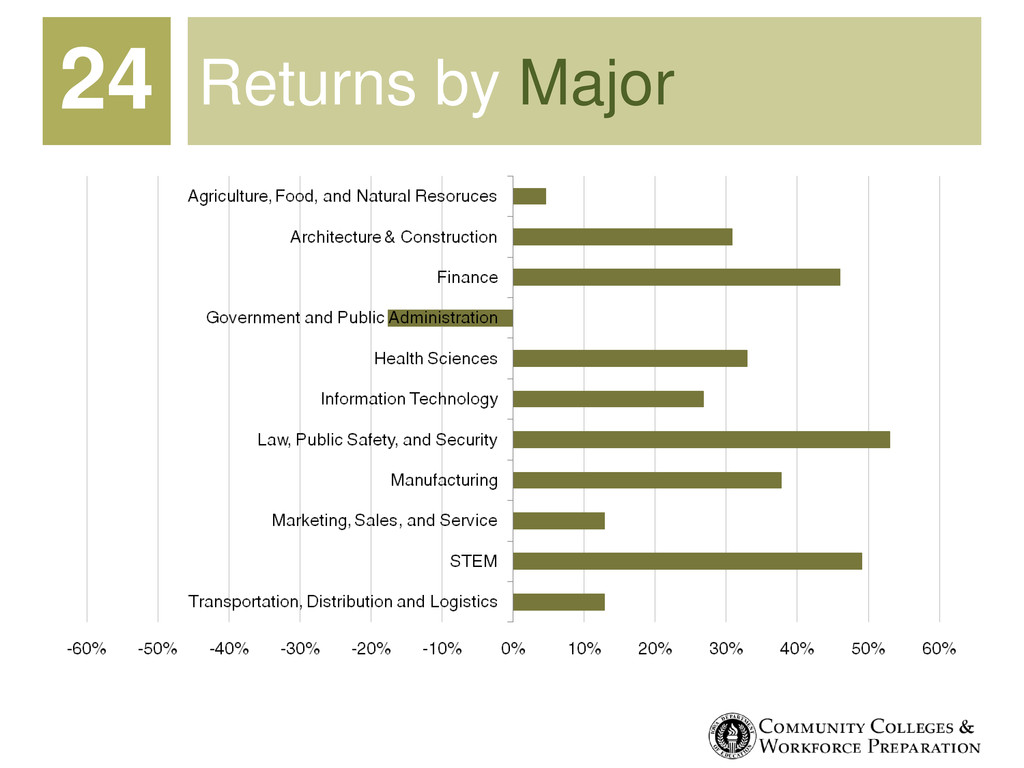
the most lucrative, worth $41,962 over six years. The AS was worth $9,343 (18.1%); AGS $24,966 (12.4%); Diploma -$3,169 (-0.7%); AA -$9,286 (-4.4%). Return by Degree 11 NEW
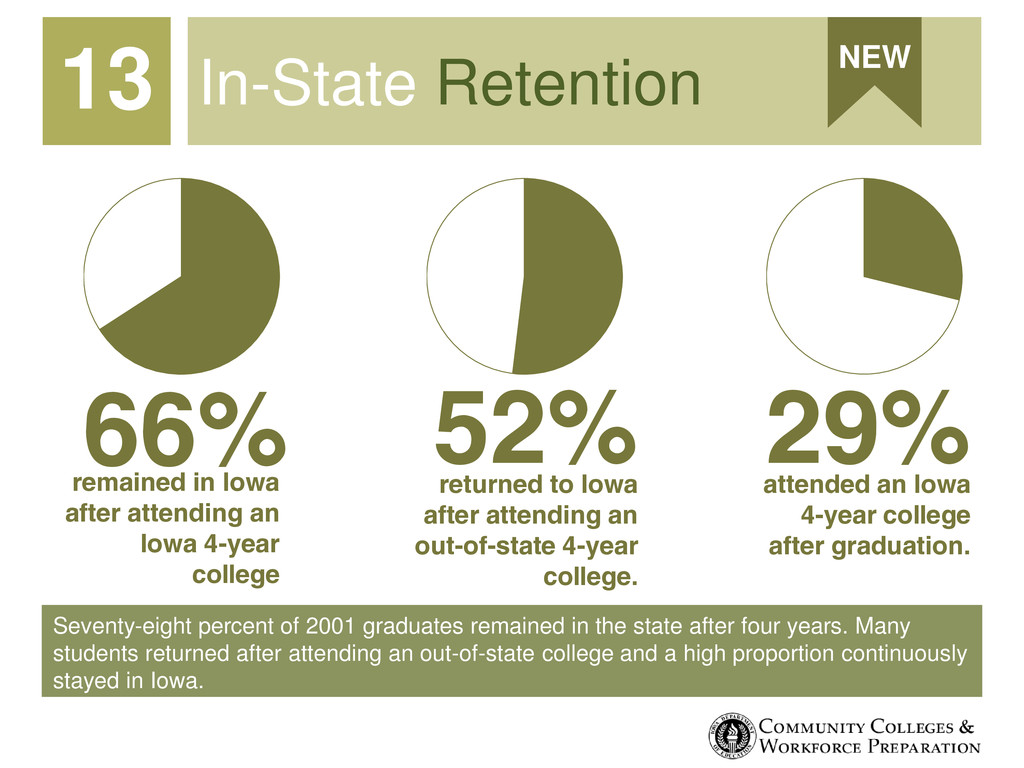
four years. Many students returned after attending an out-of-state college and a high proportion continuously stayed in Iowa. In-State Retention 13 NEW 66% 52% remained in Iowa after attending an Iowa 4-year college returned to Iowa after attending an out-of-state 4-year college. 29% attended an Iowa 4-year college after graduation.
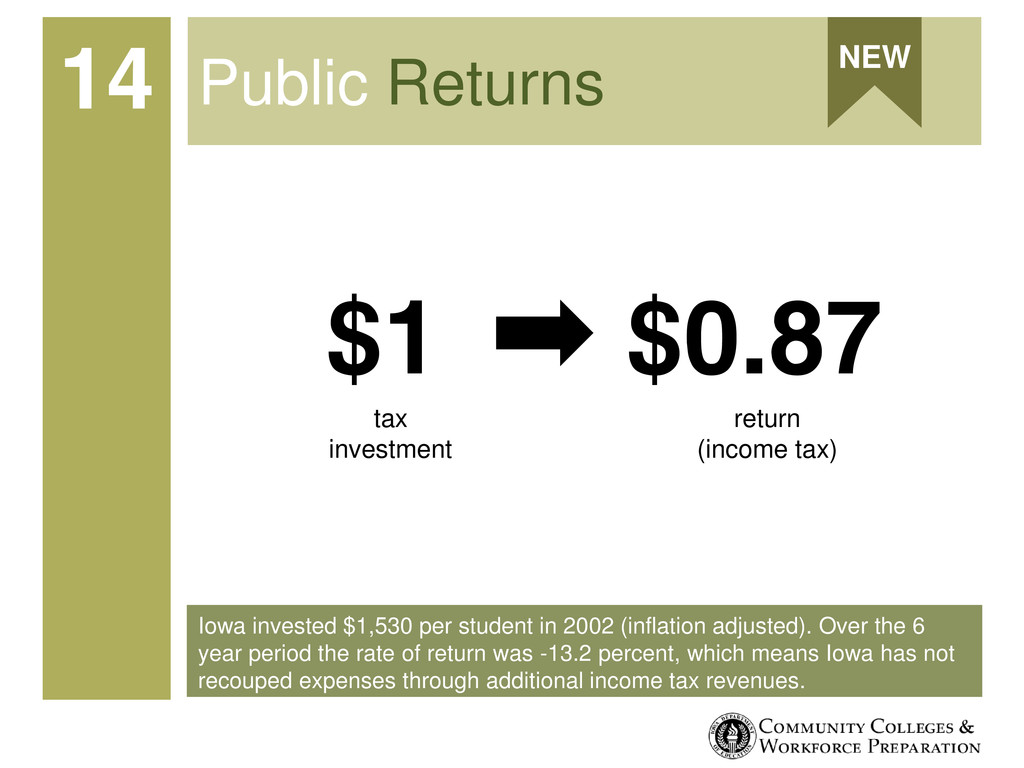
the 6 year period the rate of return was -13.2 percent, which means Iowa has not recouped expenses through additional income tax revenues. Public Returns 14 NEW $1 $0.87 tax investment return (income tax)
Iowa’s graduation rate hardily exceeds the national rate in all demographic subgroups. There is still a disparity between the graduation rate for whites and minorities in Iowa. Graduation Rate 17 0% 5% 10% 15% 20% 25% 30% 35% 40% 45% American Indian Asian Black Hispanic White Male Female Iowa National
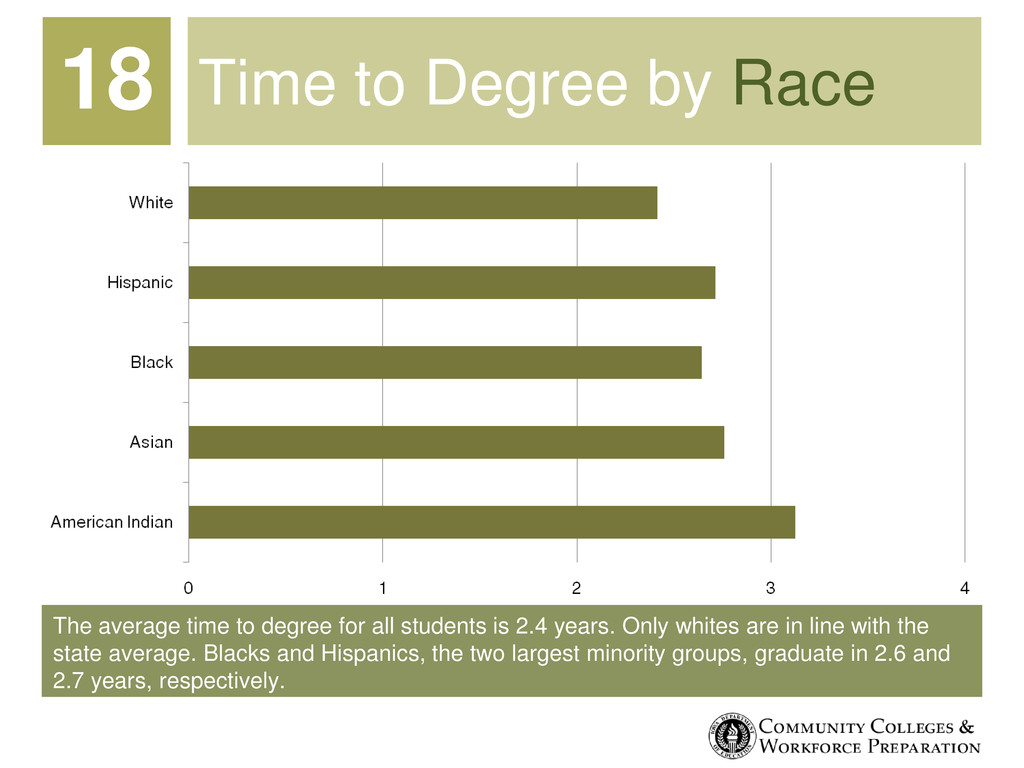
years. Only whites are in line with the state average. Blacks and Hispanics, the two largest minority groups, graduate in 2.6 and 2.7 years, respectively. Time to Degree by Race 18
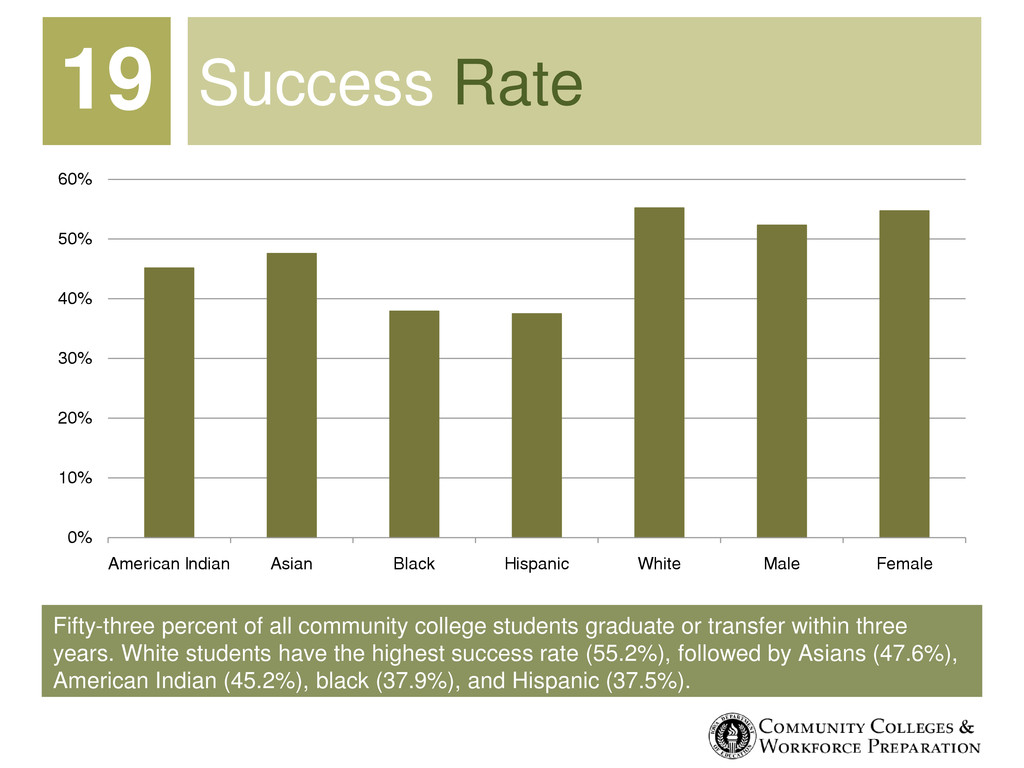
within three years. White students have the highest success rate (55.2%), followed by Asians (47.6%), American Indian (45.2%), black (37.9%), and Hispanic (37.5%). Success Rate 19 0% 10% 20% 30% 40% 50% 60% American Indian Asian Black Hispanic White Male Female
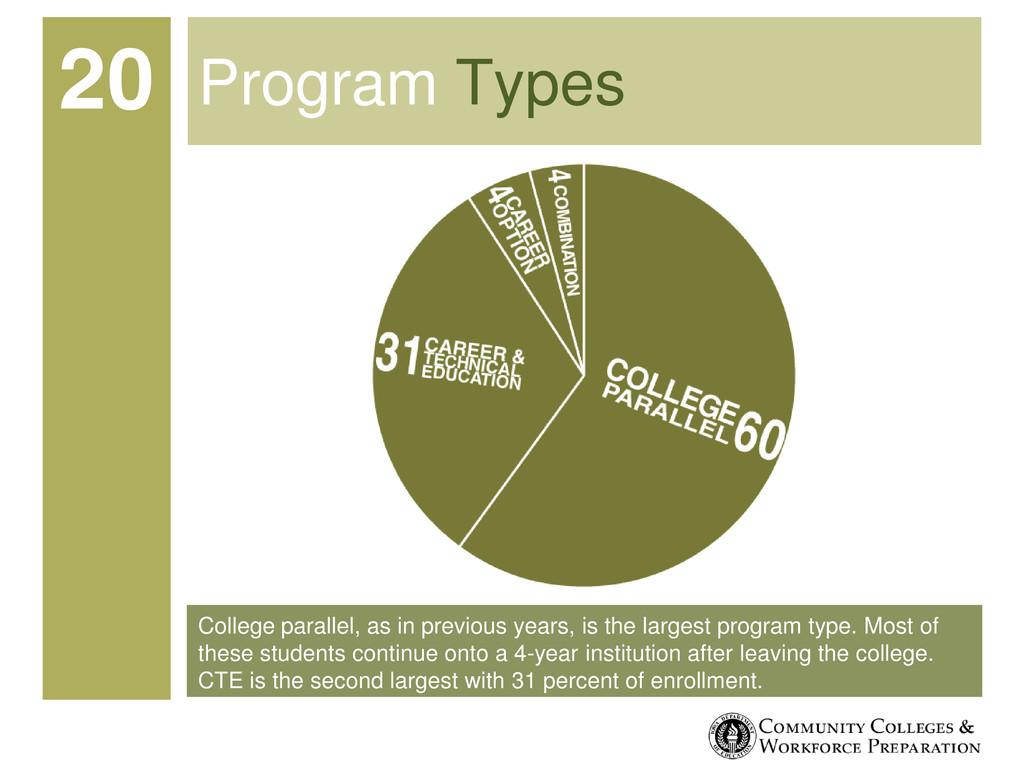
type. Most of these students continue onto a 4-year institution after leaving the college. CTE is the second largest with 31 percent of enrollment. Program Types 20
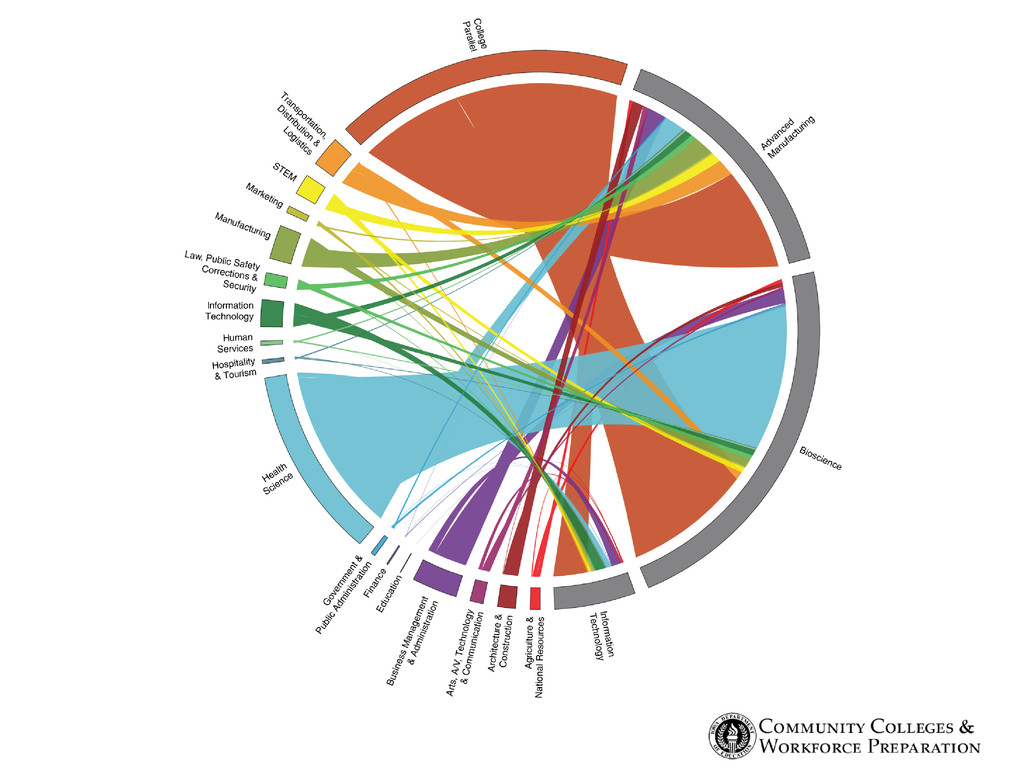
$25,000 $30,000 $35,000 $40,000 $45,000 Transportation STEM Marketing Manufacturing Law IT Human Services Hospitality Health Government Finance Education Construction Business Arts/Comm Agriculture Completers Leavers
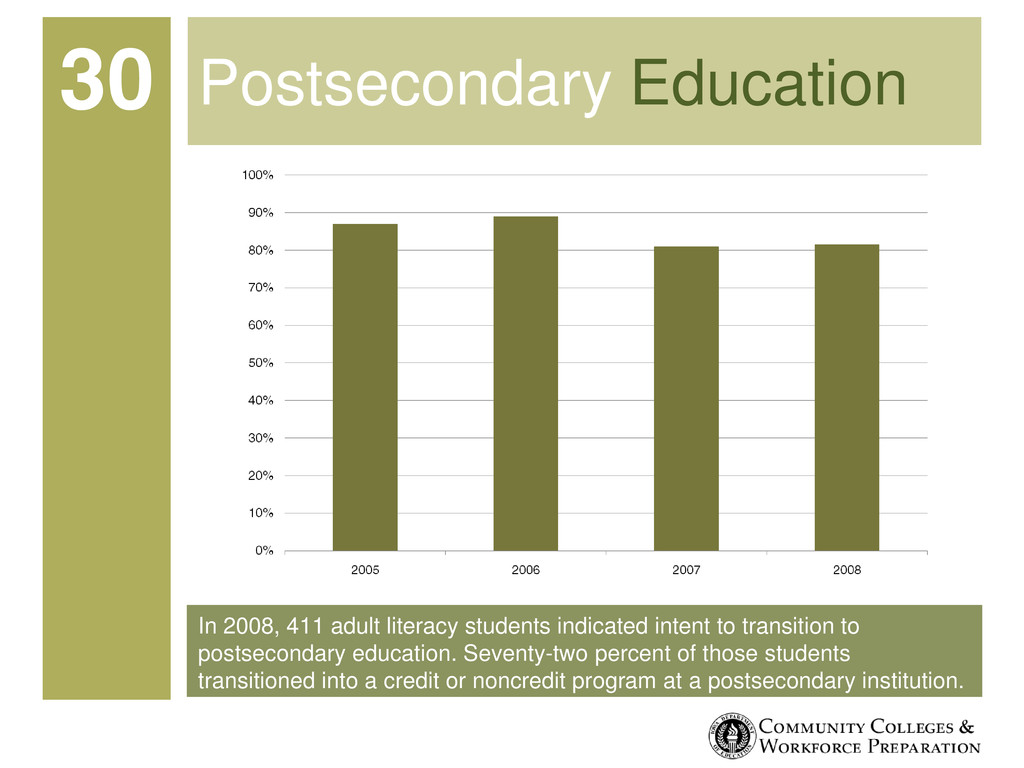
to postsecondary education. Seventy-two percent of those students transitioned into a credit or noncredit program at a postsecondary institution. Postsecondary Education 30