Upgrade to Pro — share decks privately, control downloads, hide ads and more …

Jonny Brooks-Bartlett - You got served: How Deliveroo improved the ranking of restaurants (Turing Fest 2019)

Jonny Brooks-Bartlett - You got served: How Deliveroo improved the ranking of restaurants (Turing Fest 2019)

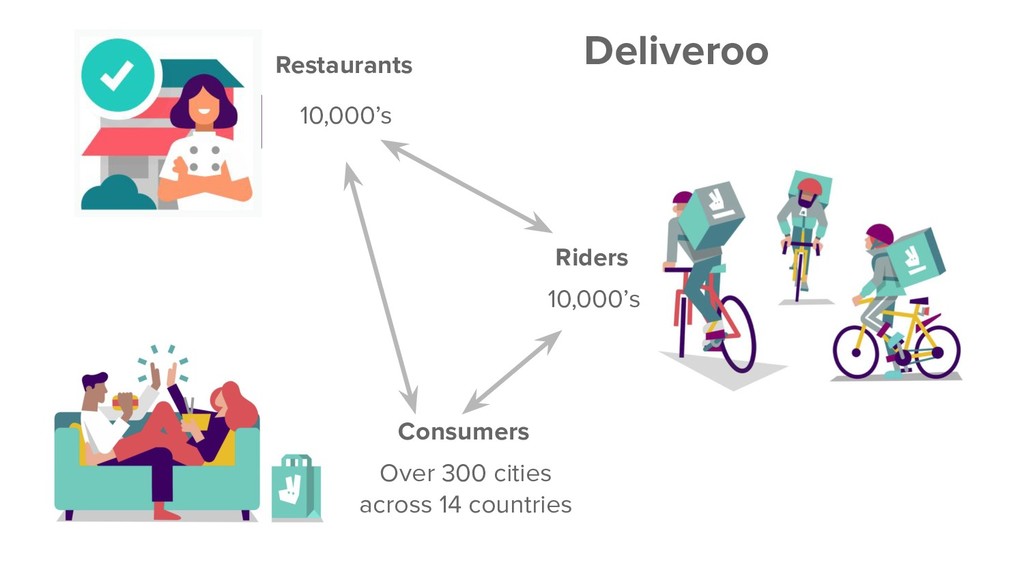
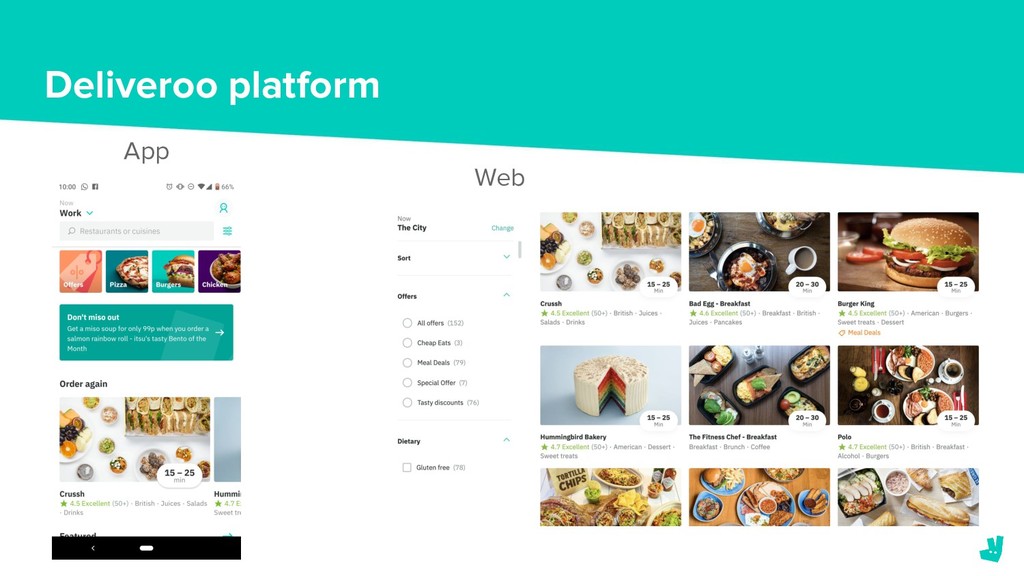
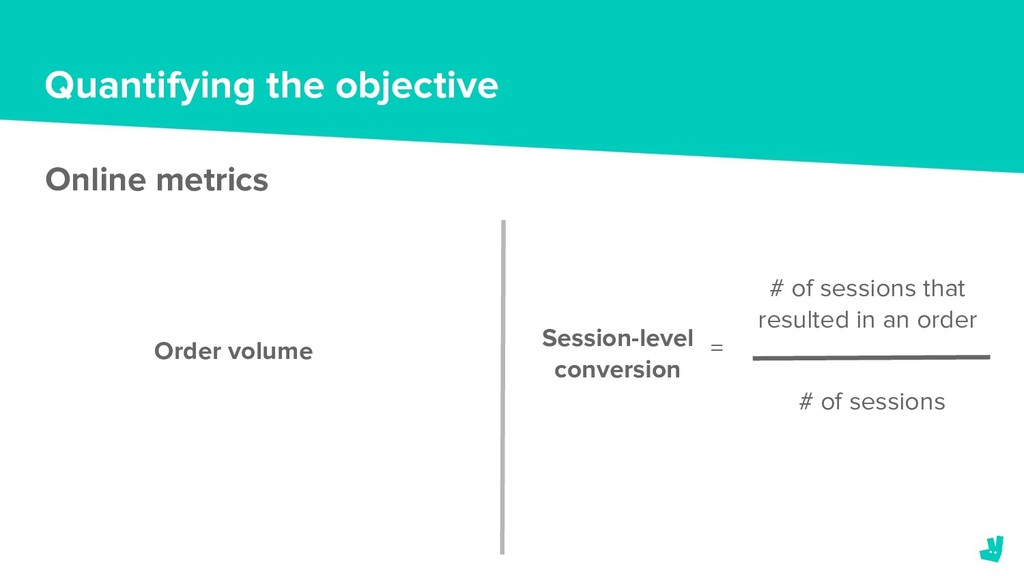
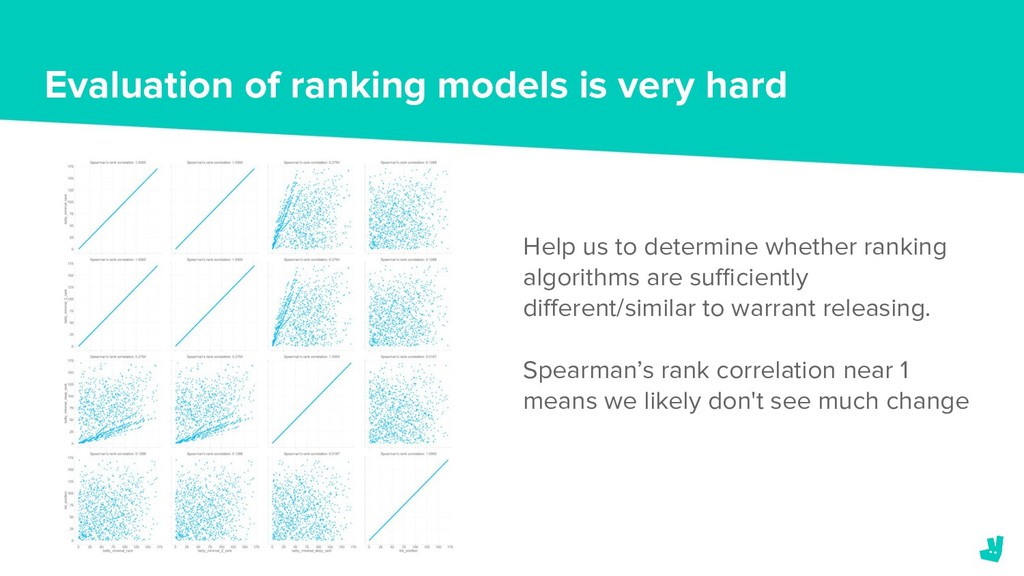
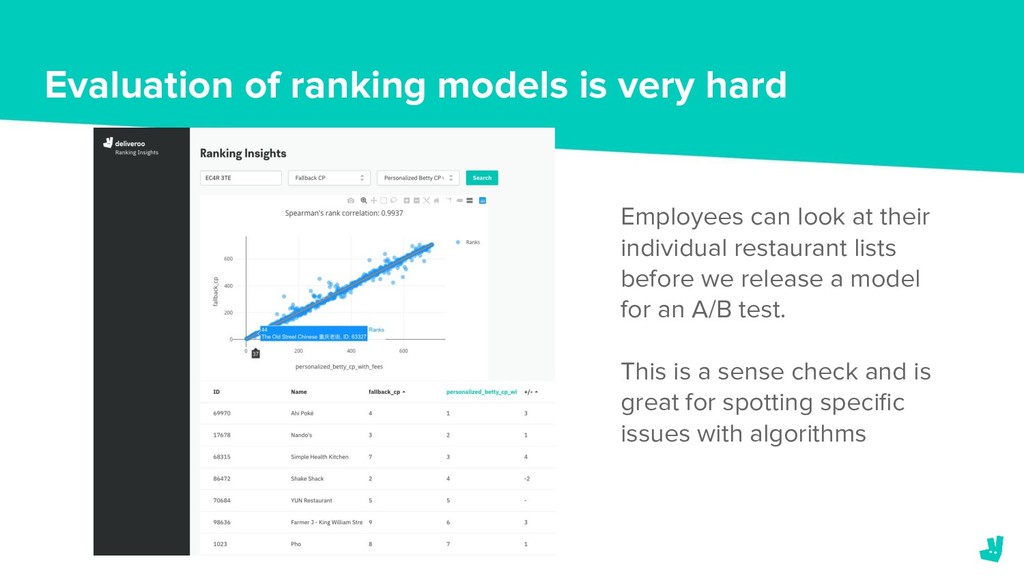
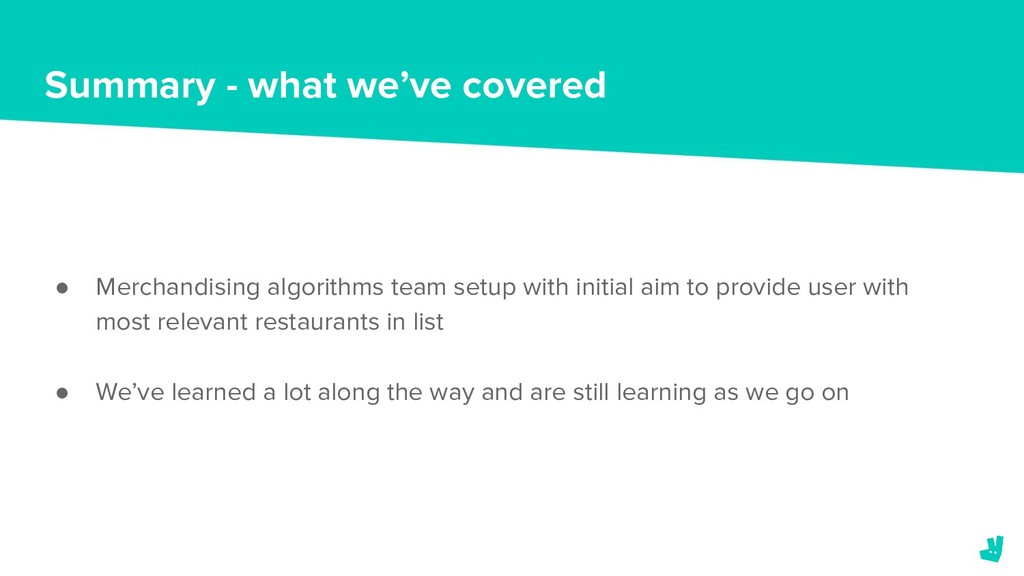
When a consumer opens the Deliveroo app they have the option to pick from a huge variety of restaurants. Depending on their location, the number of available restaurants can vary from 10’s to almost 1,000 (and counting.) However, as there is limited screen space on a consumer’s device we want to make sure that the restaurants that we surface first are the most relevant.

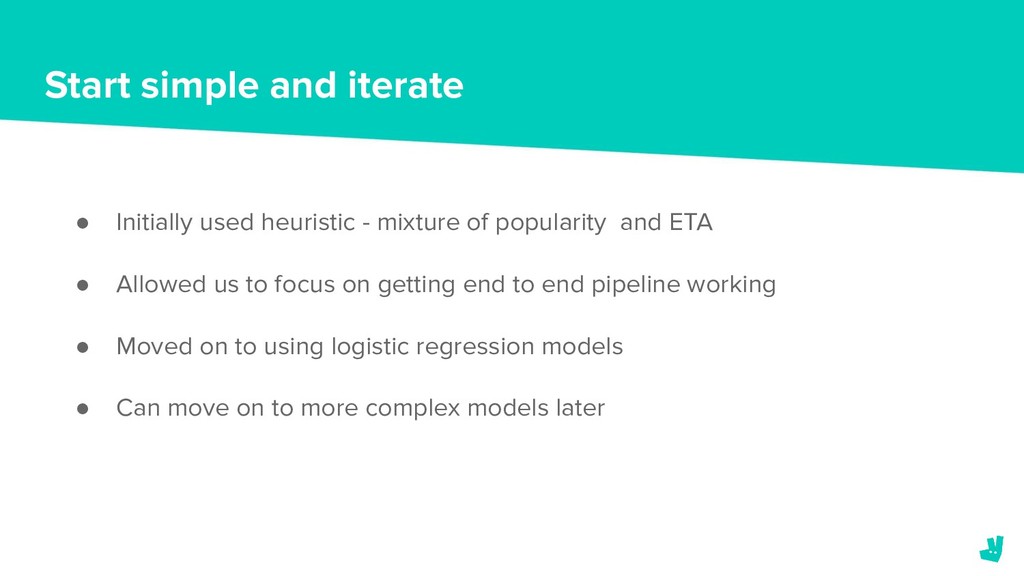
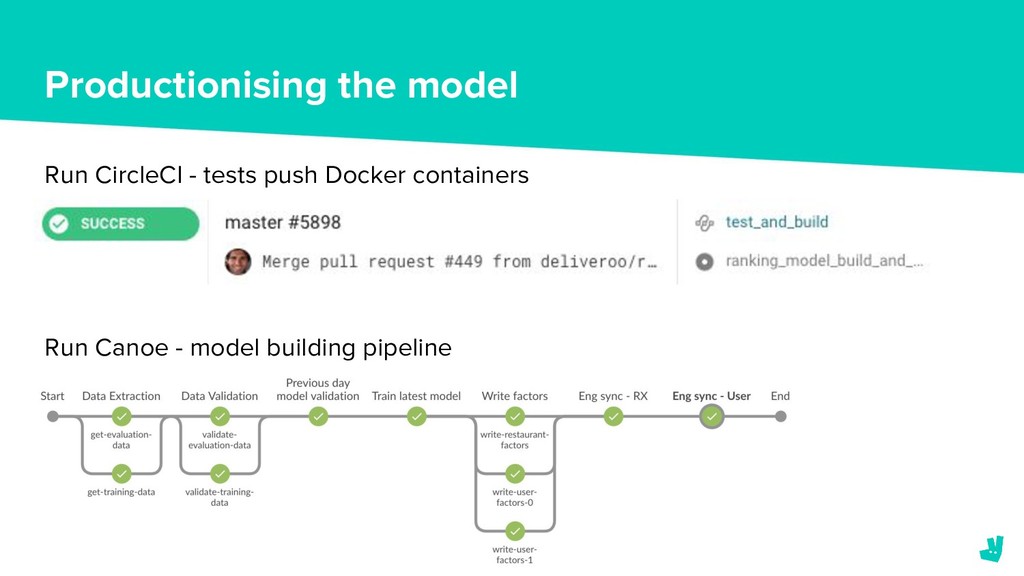
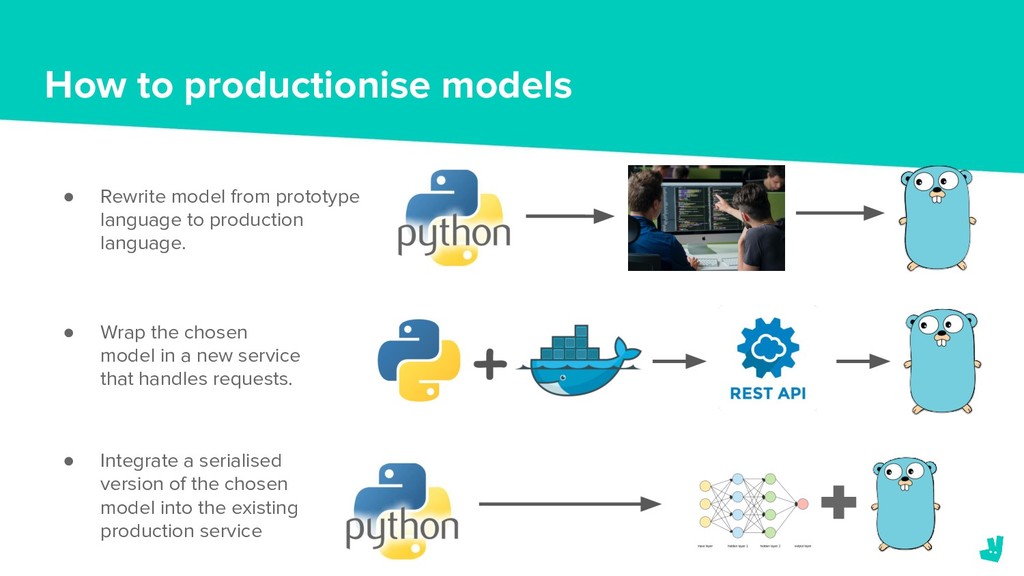
In October last year we formed a team to address this problem. We needed to decide on the tools and infrastructure to build and deploy these models as well as how we were going to frame the ranking problem.

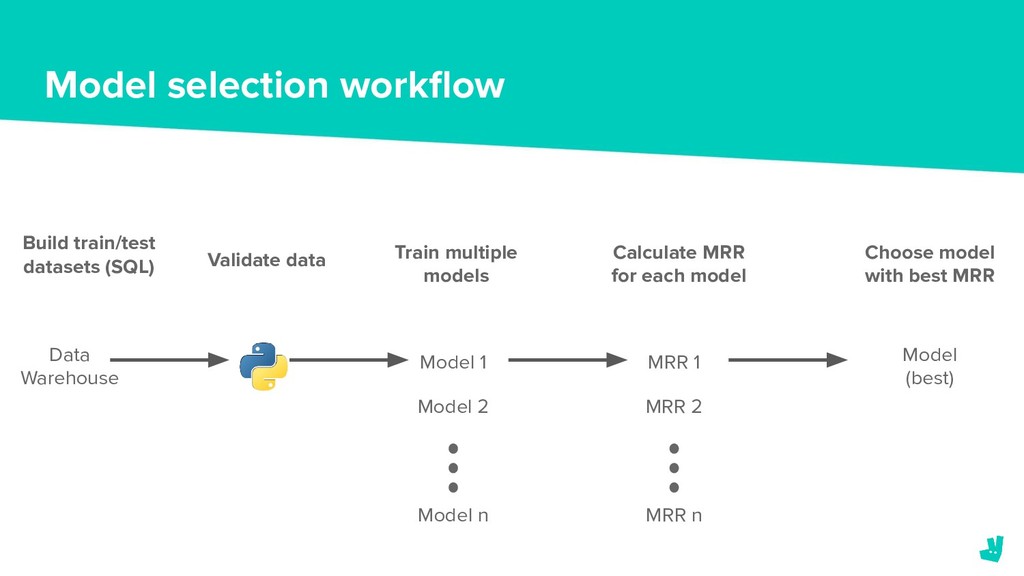
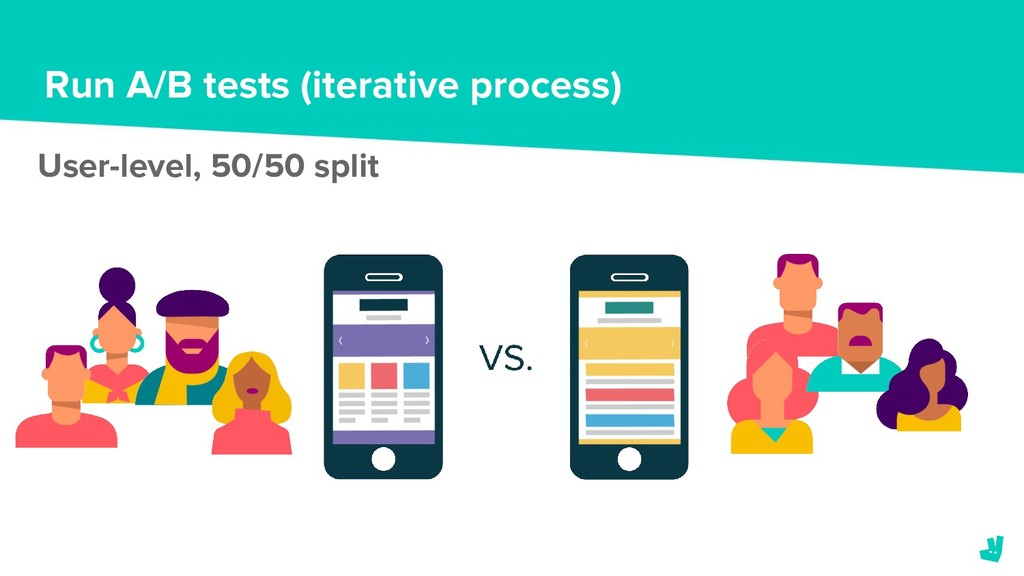
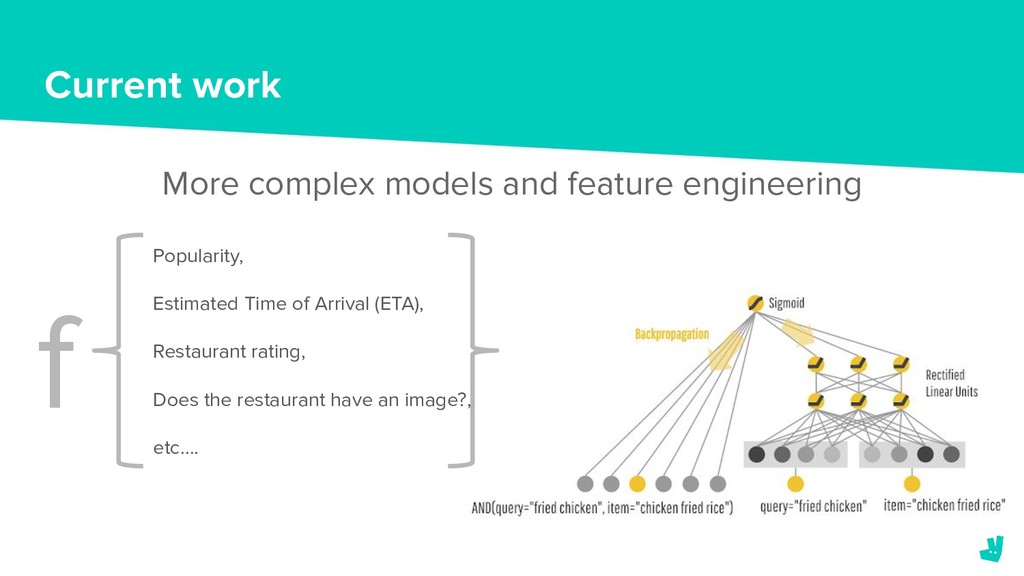
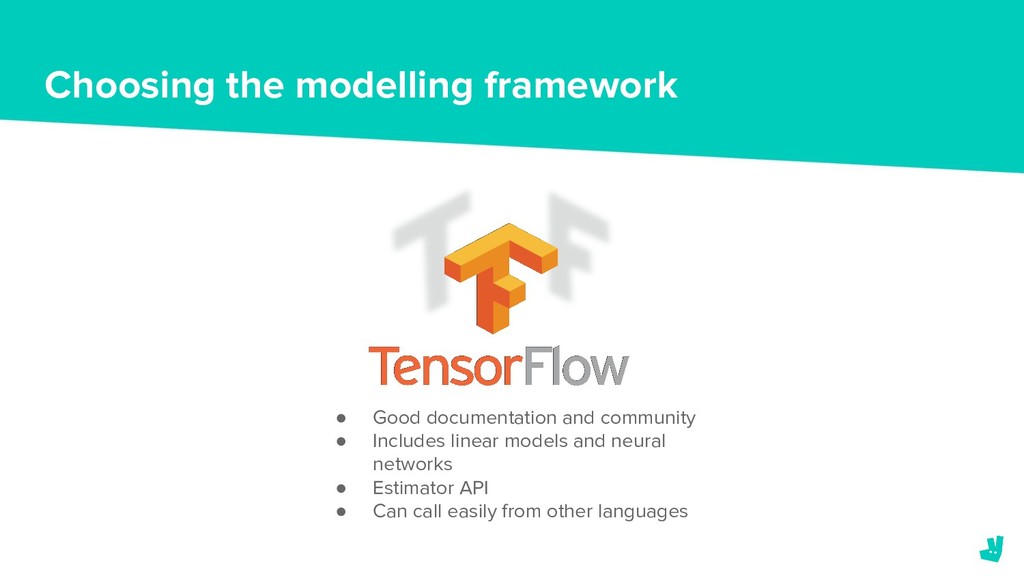
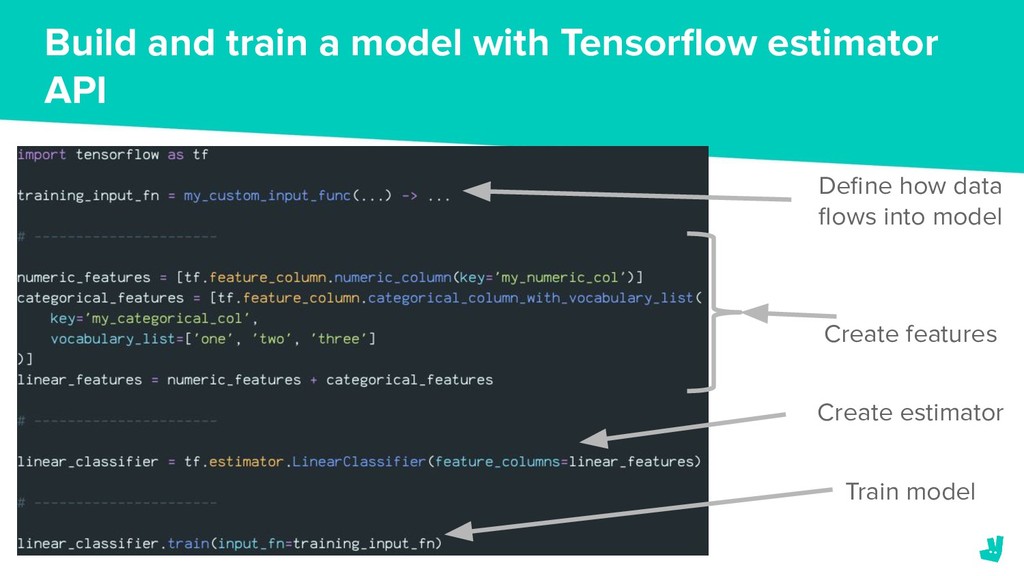
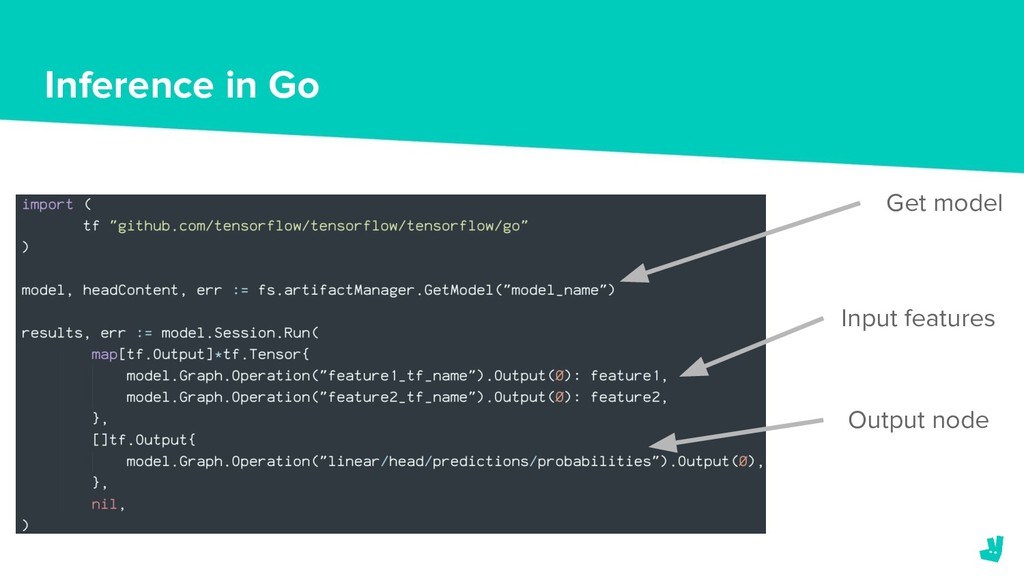
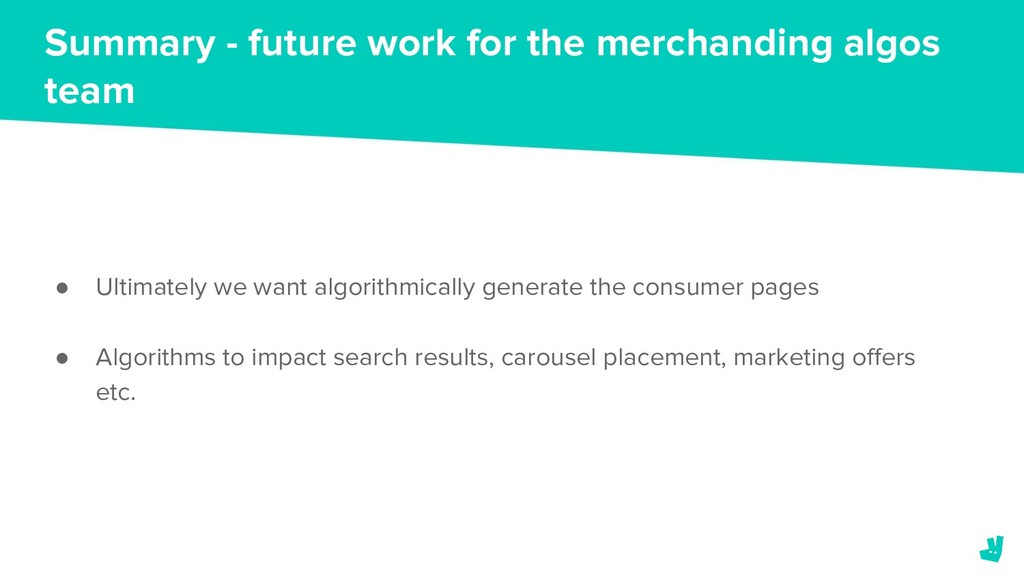
In this talk we’ll explain how we’re using Tensorflow to train and deploy our models. We’ll also discuss the challenges that we’ve faced in tackling the ranking problem and outline the solutions that we’ve implemented or proposed to overcome them.

Turing Fest

August 29, 2019
Tweet

More Decks by Turing Fest

Other Decks in Technology

Transcript

  1. Click to edit presentation title Click to edit presentation subtitle

    You got served: How Deliveroo improved the ranking of restaurants Jonny Brooks-Bartlett - Data scientist, Algorithms 13th July 2019
  2. What I’ll be talking about today • Introduction • Approach

    to ranking • Choosing tools and processes • Lessons learned • Summary
  3. Enter Merchandising Algorithms team Our initial goal: Present the most

    relevant restaurants to the consumer at the top of the feed
  4. The objective Given a list of restaurants, rank them “optimally”

    Optimal = Rank in order of relevance to the consumer How do we quantify this?
  5. Quantifying the objective Online metrics Order volume Session-level conversion =

    # of sessions that resulted in an order # of sessions
  6. Framing the problem Converted? 0 1 0 0 Session 1

    Converted? 1 0 0 0 Session 2 100’s
  7. Classification problem - pointwise approach What’s the probability that the

    user purchases from this restaurant? 0.8 0.6 0.2 0.1 Can use the log loss to train models
  8. Relevance to user = Conversion score Probability of the user

    purchasing from the restaurant (Conversion) Popularity, Estimated Time of Arrival (ETA), Restaurant rating, Does the restaurant have an image?, etc…. ~ f
  9. • Initially used heuristic - mixture of popularity and ETA

    • Allowed us to focus on getting end to end pipeline working • Moved on to using logistic regression models • Can move on to more complex models later Start simple and iterate
  10. Evaluating models Offline metrics (proxy to online metrics) • Mean

    reciprocal rank (MRR) • Precision at k • Recall at k • (Normalised) discounted cumulative gain (NDCG)
  11. 1/3 Mean reciprocal rank: = 41/150 ⋍ 0.273 Calculating the

    MRR Reciprocal rank: 1/4 1/3 1/4 1/5 converted converted converted converted converted
  12. Model selection workflow Validate data Train multiple models Model 1

    Model 2 Model n Calculate MRR for each model MRR 1 MRR 2 MRR n Choose model with best MRR Model (best) Build train/test datasets (SQL) Data Warehouse
  13. Current work More complex models and feature engineering Popularity, Estimated

    Time of Arrival (ETA), Restaurant rating, Does the restaurant have an image?, etc…. f
  14. How to productionise models • Wrap the chosen model in

    a new service that handles requests. • Integrate a serialised version of the chosen model into the existing production service • Rewrite model from prototype language to production language.
  15. Choosing the modelling framework • Good documentation and community •

    Includes linear models and neural networks • Estimator API • Can call easily from other languages
  16. Build and train a model with Tensorflow estimator API Define

    how data flows into model Create features Create estimator Train model
  17. Check for skew in production vs training data Production rank

    Offline rank Offline vs production rank % error Features Offline vs production feature discrepancy
  18. Evaluation of ranking models is very hard • Single global

    evaluation metrics like MRR can be misleading • Sometimes improvements in MRR doesn’t lead to improvements in online metrics • We need to look at several things to be sure that the ranking model is working as expected
  19. Evaluation of ranking models is very hard Help us to

    determine whether ranking algorithms are sufficiently different/similar to warrant releasing. Spearman’s rank correlation near 1 means we likely don't see much change
  20. Evaluation of ranking models is very hard Employees can look

    at their individual restaurant lists before we release a model for an A/B test. This is a sense check and is great for spotting specific issues with algorithms
  21. Lessons learned summary! 1. Check differences between training and production

    environments. Allows us to work at pace and be sure that we’re impacting the right metrics 1. Log and monitor EVERYTHING! 1. Don’t just rely on global metrics. You may need to look at multiple metrics to be confident that your model works 1. Read (and re-read) Google’s rules of ML
  22. Summary - what we’ve covered • Merchandising algorithms team setup

    with initial aim to provide user with most relevant restaurants in list • We’ve learned a lot along the way and are still learning as we go on
  23. Summary - future work for the merchanding algos team •

    Ultimately we want algorithmically generate the consumer pages • Algorithms to impact search results, carousel placement, marketing offers etc.
  24. Summary - other data science teams • Pricing algorithms •

    Logistics algorithms • Experimentation platform
  25. Affinity modelling Converted = 1 Converted = 0 Session 1

    Converted = 0 Converted = 1 Session 2
  26. Session-based metrics can be misleading A move towards user-level metrics

    may be beneficial in any case, given that the interpretation of rate metrics such as conversion can be ambiguous when the unit of analysis, the denominator, is not the randomisation unit. For example, an increase in session-level conversion-rate could indicate either an improved, diminished or un-changed user experience depending on whether the numerator (conversions) or denominator (sessions), or both, have changed.