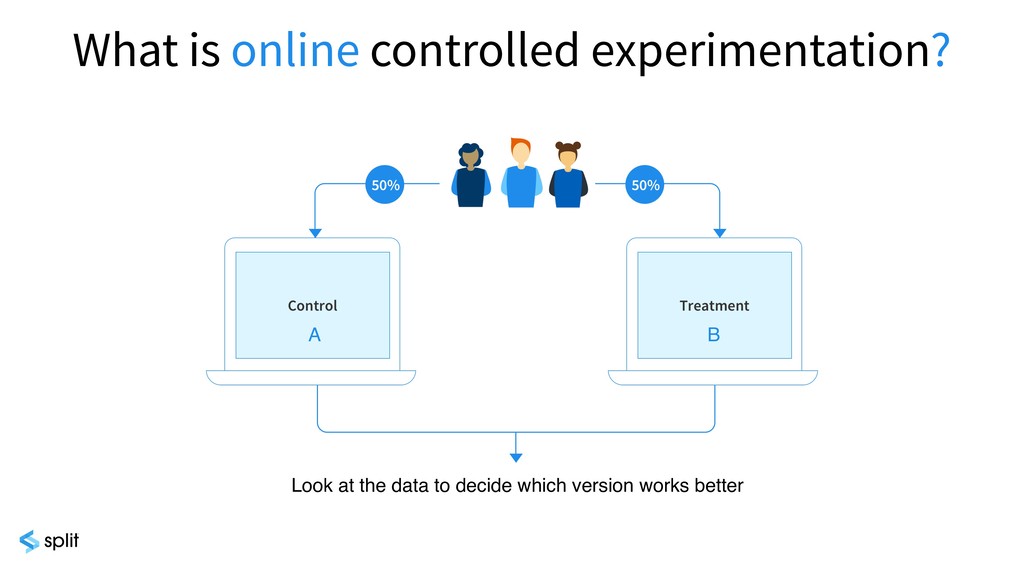
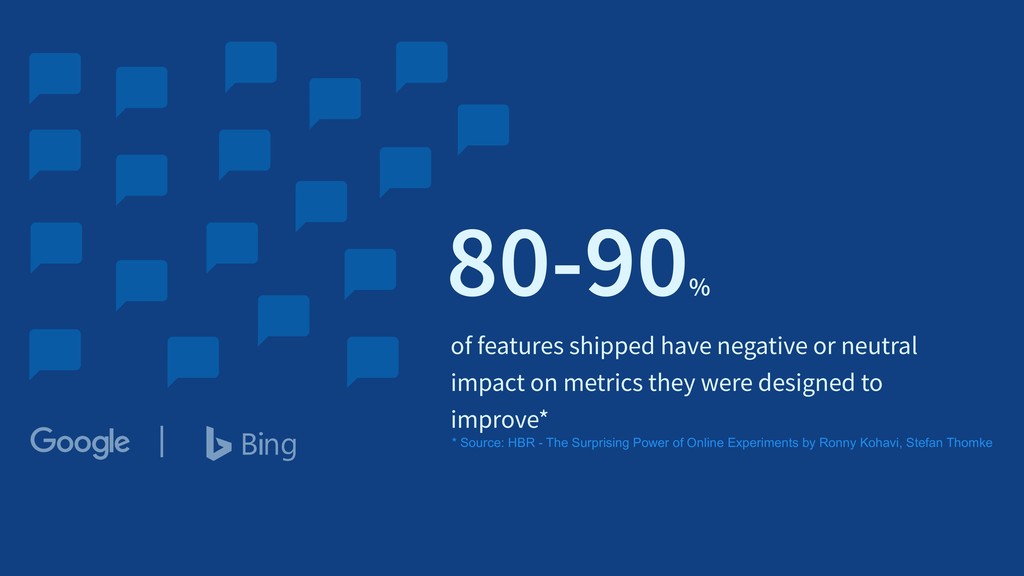
Experimentation has the power to provide you with insights about your users, to let you rollout software safely, and to ensure that the features you are building are delivering value. But with this power comes great responsibility — it’s dangerously easy to be misled by the data. Are you making the right decisions based on your experiment results? Are you falling into the common traps of interpreting statistics?
Join an optimistic product manager, Sophie, and a pedantic data scientist, Lizzie, as this experimentation duo discuss and explain experimentation from all perspectives.
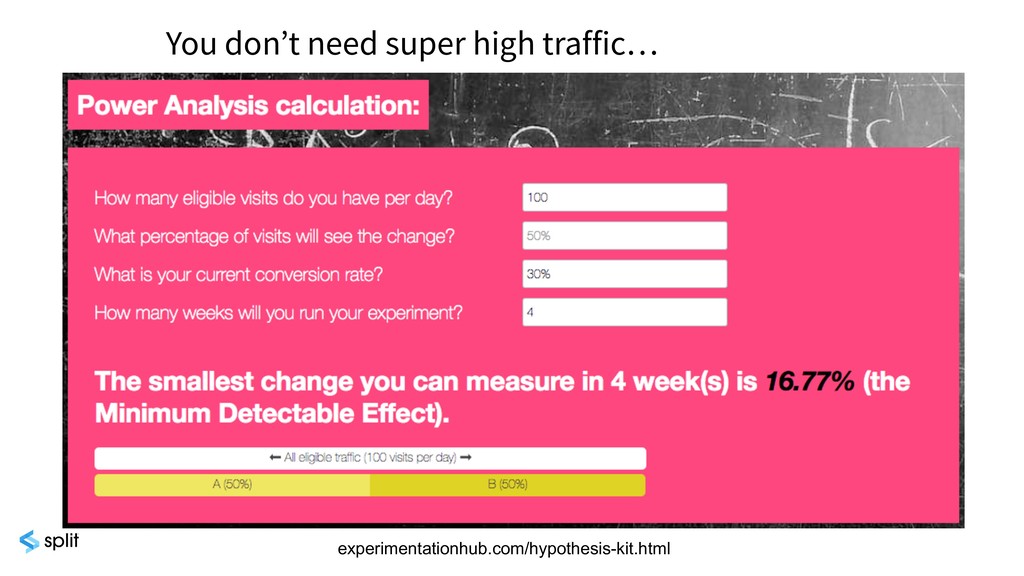
![Many online power calculators out there to help[4,5] experimentationhub.com/hypothesis-kit.html](https://files.speakerdeck.com/presentations/a9e27fd399d544deb0c24e06995ea329/slide_42.jpg)
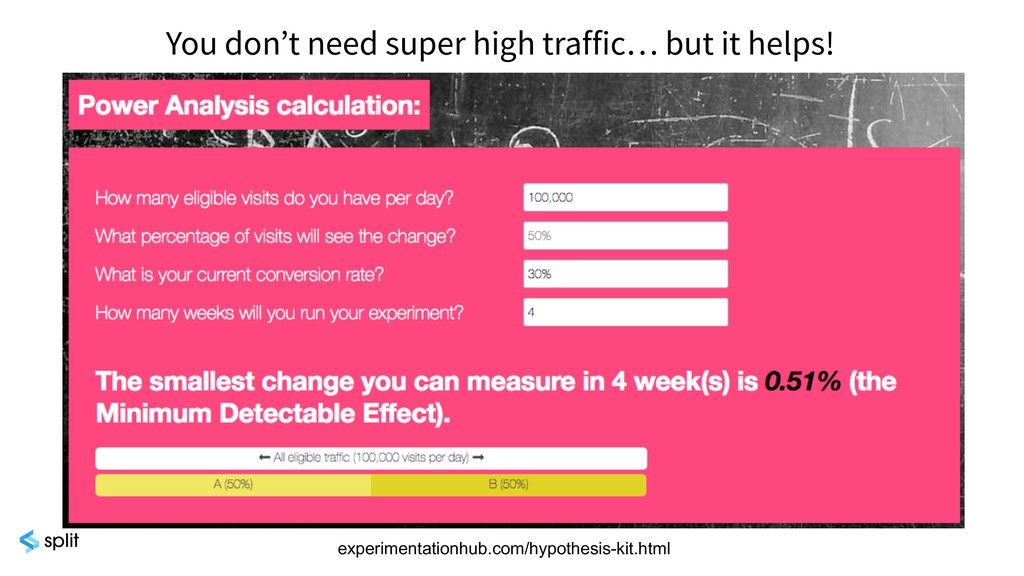
![experimentationhub.com/hypothesis-kit.html Many online power calculators out there to help[4,5]](https://files.speakerdeck.com/presentations/a9e27fd399d544deb0c24e06995ea329/slide_43.jpg)
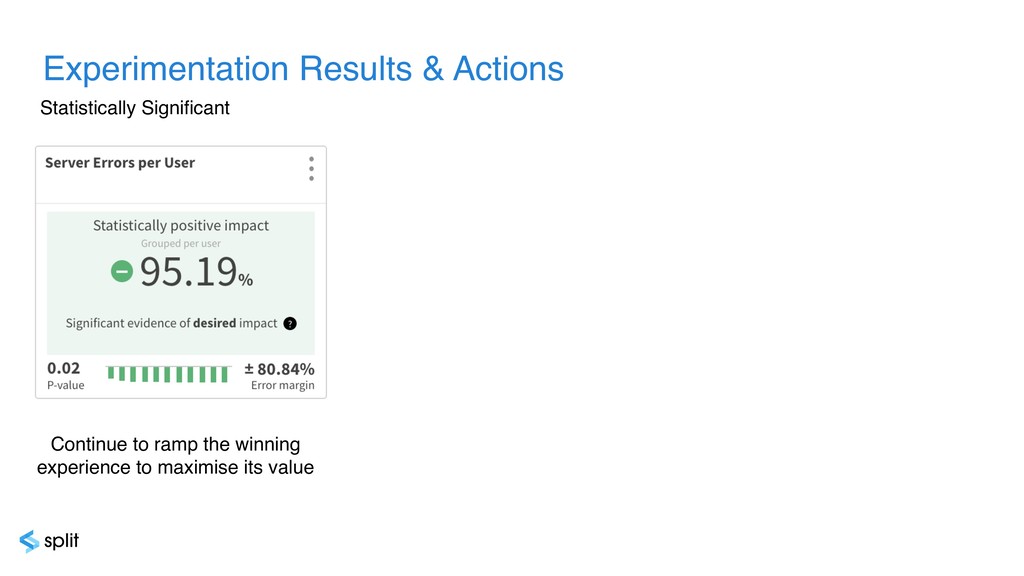
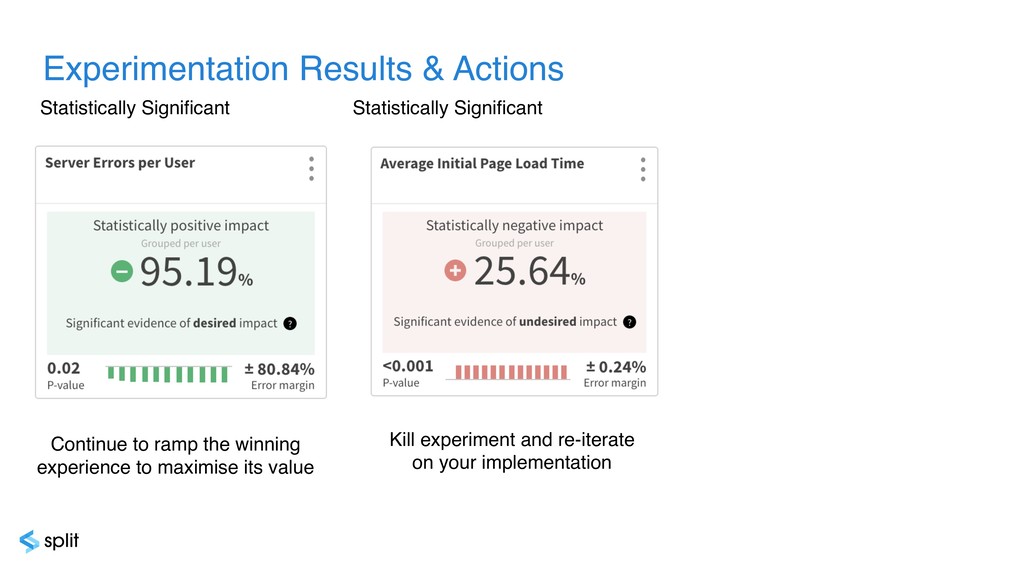
![Statistically Significant Statistically Significant Statistically Inconclusive[8] Continue to ramp the](https://files.speakerdeck.com/presentations/a9e27fd399d544deb0c24e06995ea329/slide_58.jpg)