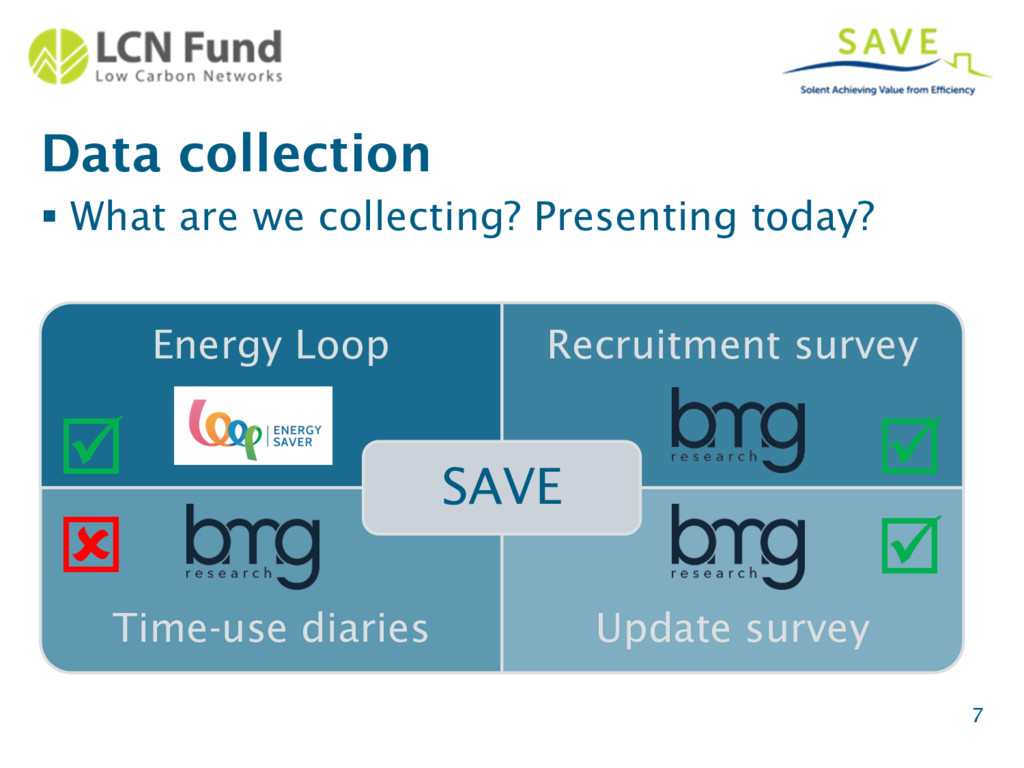
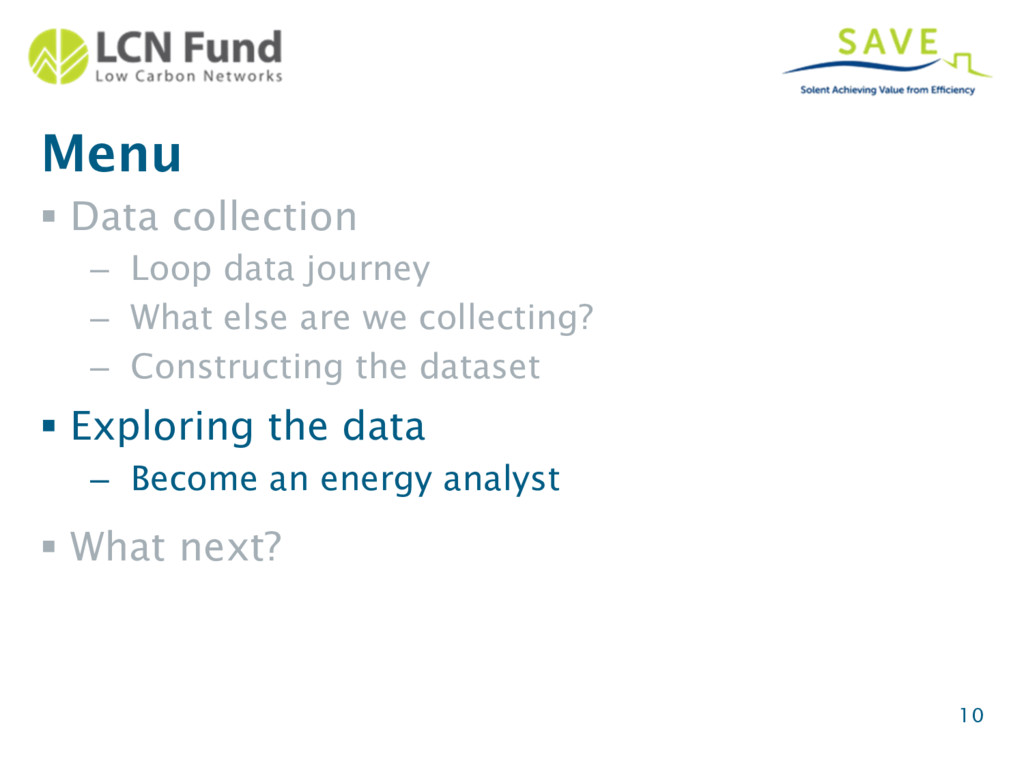
else are we collecting? – Constructing the dataset 2 § Exploring the data – Become an energy analyst § What next? Image (modified): ‘matrix’ by Gamaliel Espinoza Macedo https://www.flickr.com/photos/gamikun/
are we collecting? – Constructing the dataset Menu 3 Image (modified): ‘matrix’ by Gamaliel Espinoza Macedo https://www.flickr.com/photos/gamikun/ § Exploring the data – Become an energy analyst § What next?
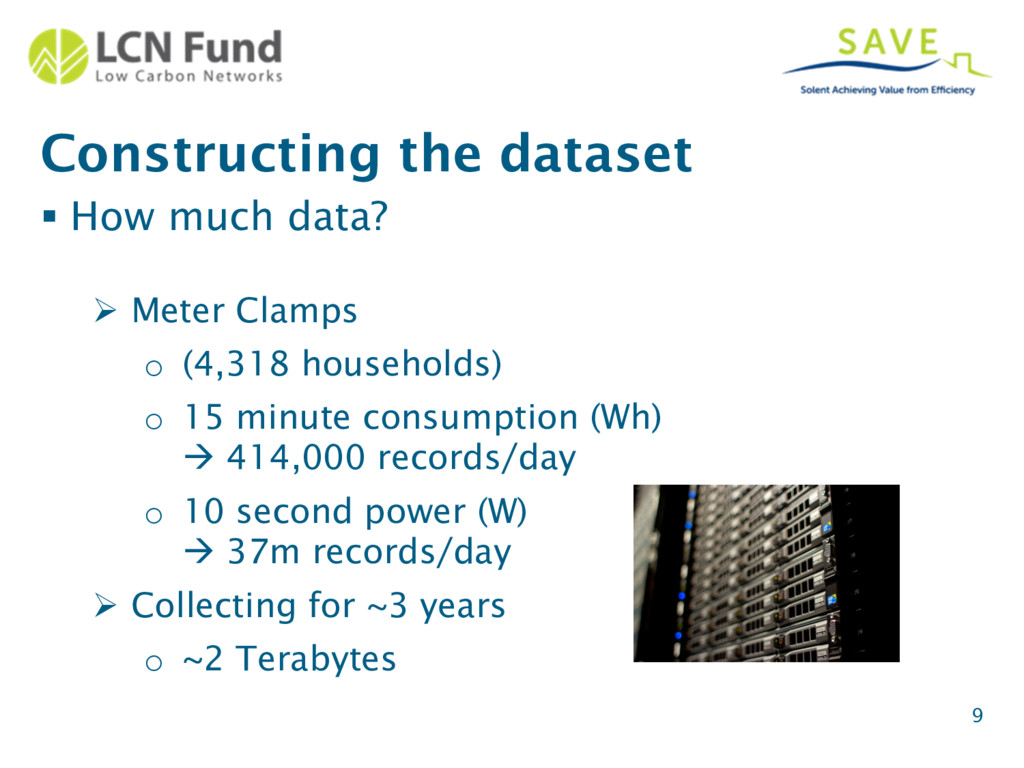
Clamps o (4,318 households) o 15 minute consumption (Wh) à 414,000 records/day o 10 second power (W) à 37m records/day Ø Collecting for ~3 years o ~2 Terabytes
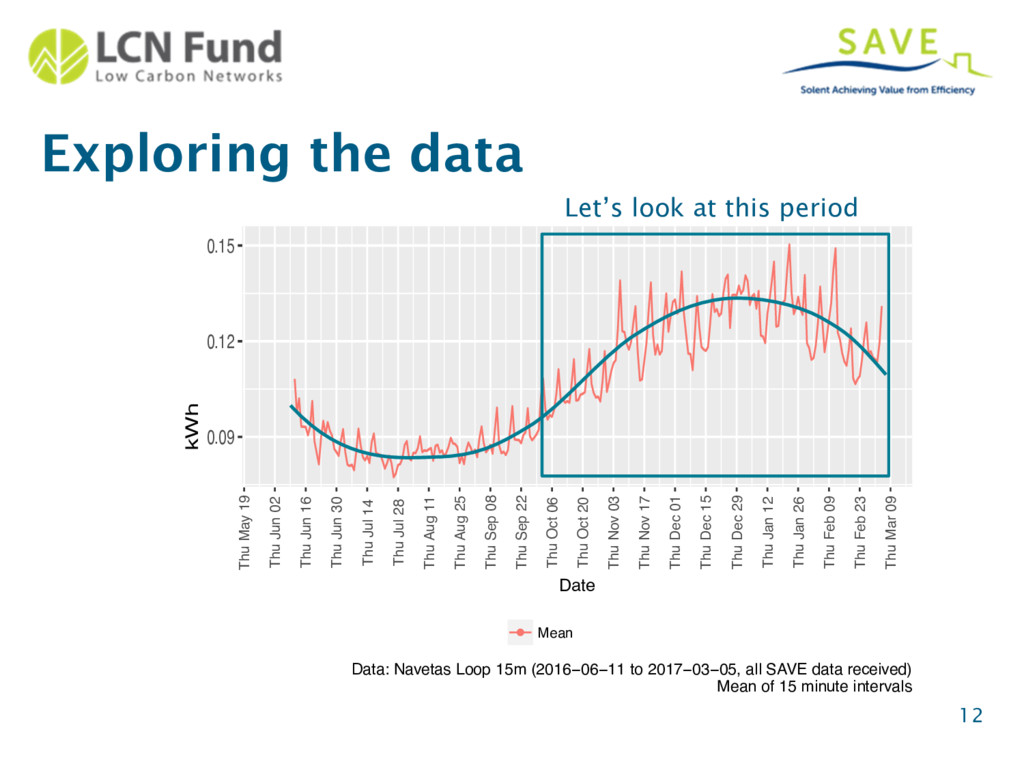
19 Thu Jun 02 Thu Jun 16 Thu Jun 30 Thu Jul 14 Thu Jul 28 Thu Aug 11 Thu Aug 25 Thu Sep 08 Thu Sep 22 Thu Oct 06 Thu Oct 20 Thu Nov 03 Thu Nov 17 Thu Dec 01 Thu Dec 15 Thu Dec 29 Thu Jan 12 Thu Jan 26 Thu Feb 09 Thu Feb 23 Thu Mar 09 kWh Let’s look at this period 0.06 0.09 0.12 0.15 Thu May 19 Thu Jun 02 Thu Jun 16 Thu Jun 30 Thu Jul 14 Thu Jul 28 Thu Aug 11 Thu Aug 25 Thu Sep 08 Thu Sep 22 Thu Oct 06 Thu Oct 20 Thu Nov 03 Thu Nov 17 Thu Dec 01 Thu Dec 15 Thu Dec 29 Thu Jan 12 Thu Jan 26 Thu Feb 09 Thu Feb 23 Thu Mar 09 Date kWh Mean Median Data: Navetas Loop 15m (2016−06−11 to 2017−03−05, all SAVE data received) Mean of 15 minute intervals
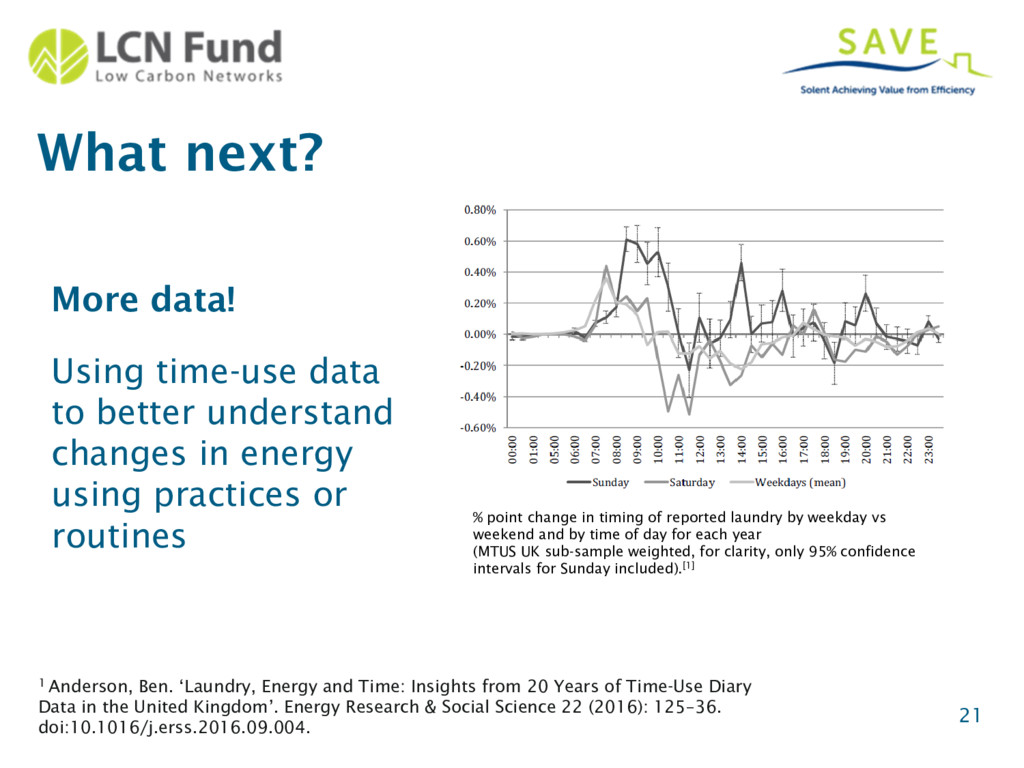
changes in energy using practices or routines 21 % point change in timing of reported laundry by weekday vs weekend and by time of day for each year (MTUS UK sub-sample weighted, for clarity, only 95% confidence intervals for Sunday included).[1] 1 Anderson, Ben. ‘Laundry, Energy and Time: Insights from 20 Years of Time-Use Diary Data in the United Kingdom’. Energy Research & Social Science 22 (2016): 125–36. doi:10.1016/j.erss.2016.09.004.
![Decoding the SAVE project data Tom Rushby [email protected] @tom_rushby Ben](https://files.speakerdeck.com/presentations/9ed60fd23c5b43eb93fbabc6ab18377c/slide_0.jpg)