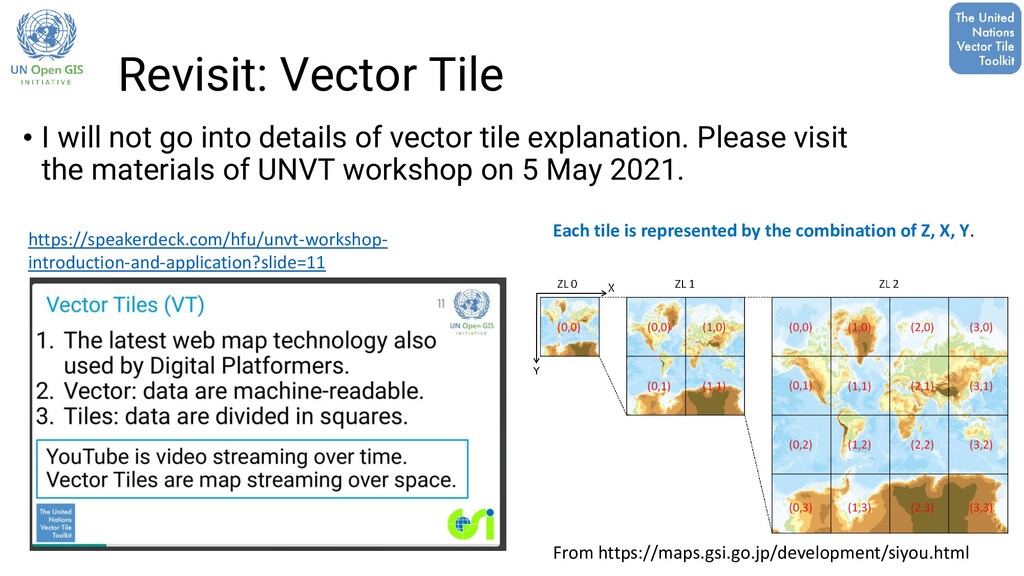
of vector tile explanation. Please visit the materials of UNVT workshop on 5 May 2021. https://speakerdeck.com/hfu/unvt-workshop- introduction-and-application?slide=11 From https://maps.gsi.go.jp/development/siyou.html Each tile is represented by the combination of Z, X, Y.
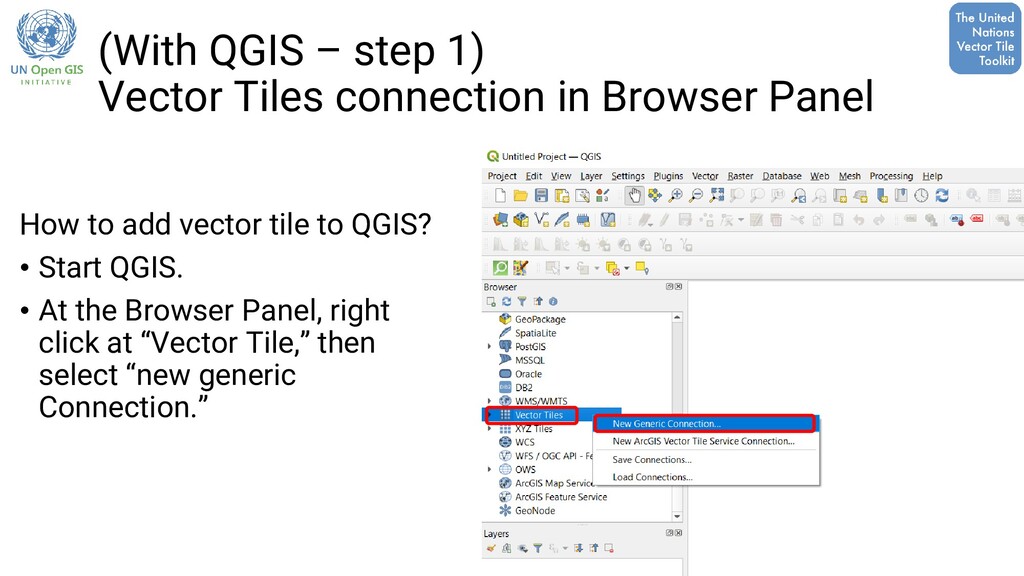
step, let’s read the vector tile from the Internet. • What: • Existing Vector Tiles • How: • With QGIS (ver 3.16 or later) • Or, with Maputnik (https://maputnik.github.io/ )
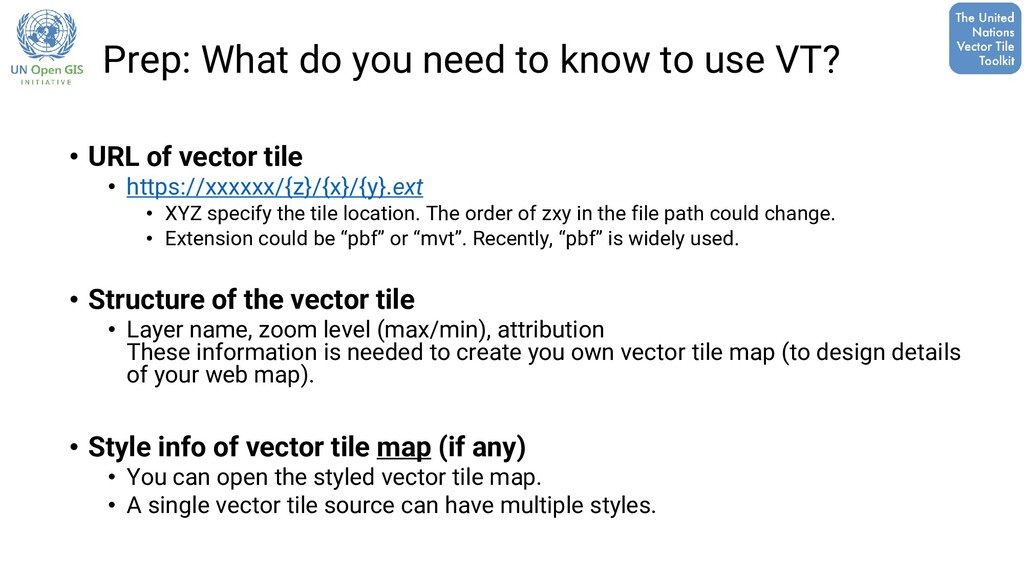
• URL of vector tile • https://xxxxxx/{z}/{x}/{y}.ext • XYZ specify the tile location. The order of zxy in the file path could change. • Extension could be “pbf” or “mvt”. Recently, “pbf” is widely used. • Structure of the vector tile • Layer name, zoom level (max/min), attribution These information is needed to create you own vector tile map (to design details of your web map). • Style info of vector tile map (if any) • You can open the styled vector tile map. • A single vector tile source can have multiple styles.
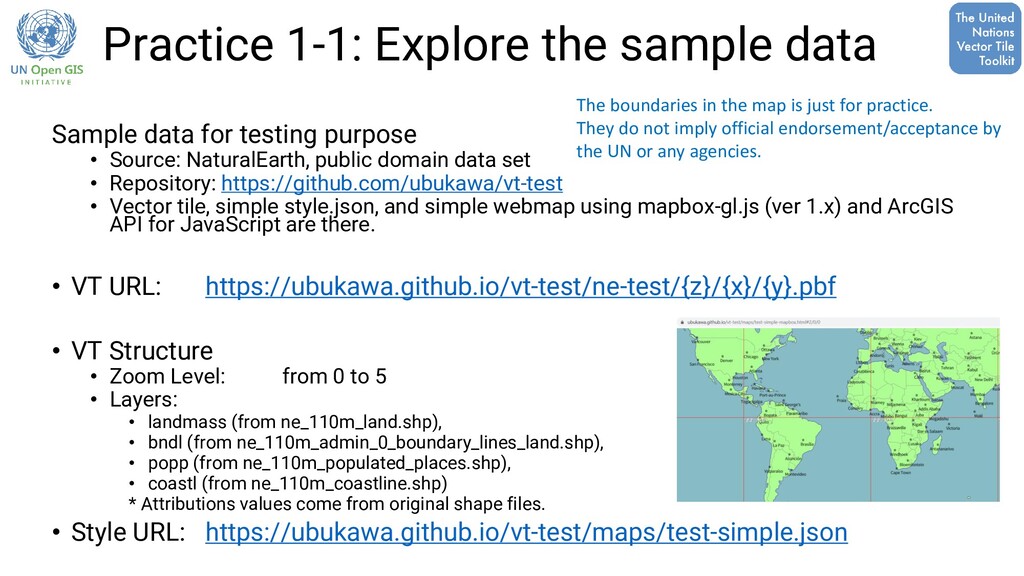
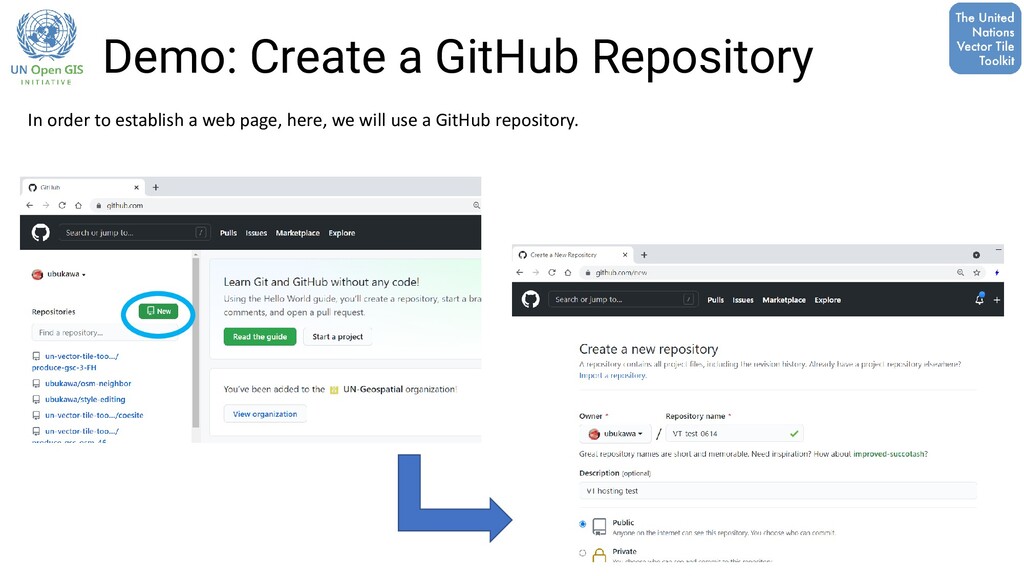
purpose • Source: NaturalEarth, public domain data set • Repository: https://github.com/ubukawa/vt-test • Vector tile, simple style.json, and simple webmap using mapbox-gl.js (ver 1.x) and ArcGIS API for JavaScript are there. • VT URL: https://ubukawa.github.io/vt-test/ne-test/{z}/{x}/{y}.pbf • VT Structure • Zoom Level: from 0 to 5 • Layers: • landmass (from ne_110m_land.shp), • bndl (from ne_110m_admin_0_boundary_lines_land.shp), • popp (from ne_110m_populated_places.shp), • coastl (from ne_110m_coastline.shp) * Attributions values come from original shape files. • Style URL: https://ubukawa.github.io/vt-test/maps/test-simple.json The boundaries in the map is just for practice. They do not imply official endorsement/acceptance by the UN or any agencies.
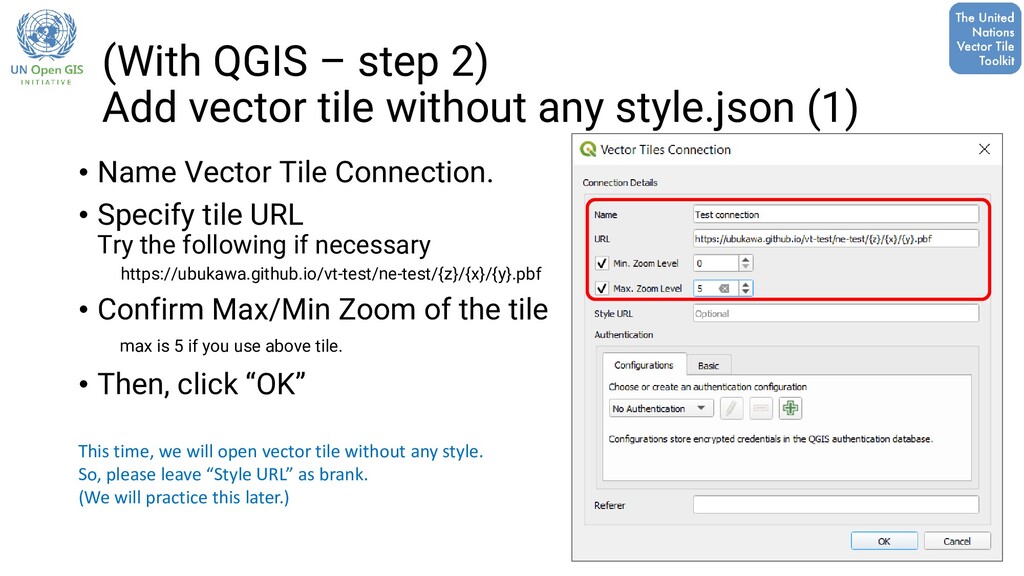
style.json (1) • Name Vector Tile Connection. • Specify tile URL Try the following if necessary https://ubukawa.github.io/vt-test/ne-test/{z}/{x}/{y}.pbf • Confirm Max/Min Zoom of the tile max is 5 if you use above tile. • Then, click “OK” This time, we will open vector tile without any style. So, please leave “Style URL” as brank. (We will practice this later.)
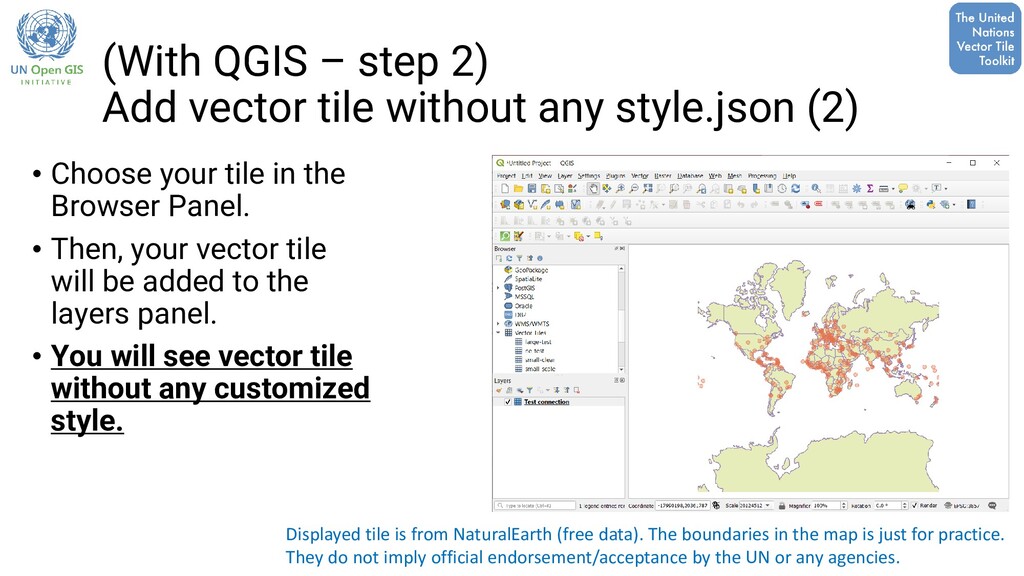
style.json (2) • Choose your tile in the Browser Panel. • Then, your vector tile will be added to the layers panel. • You will see vector tile without any customized style. Displayed tile is from NaturalEarth (free data). The boundaries in the map is just for practice. They do not imply official endorsement/acceptance by the UN or any agencies.
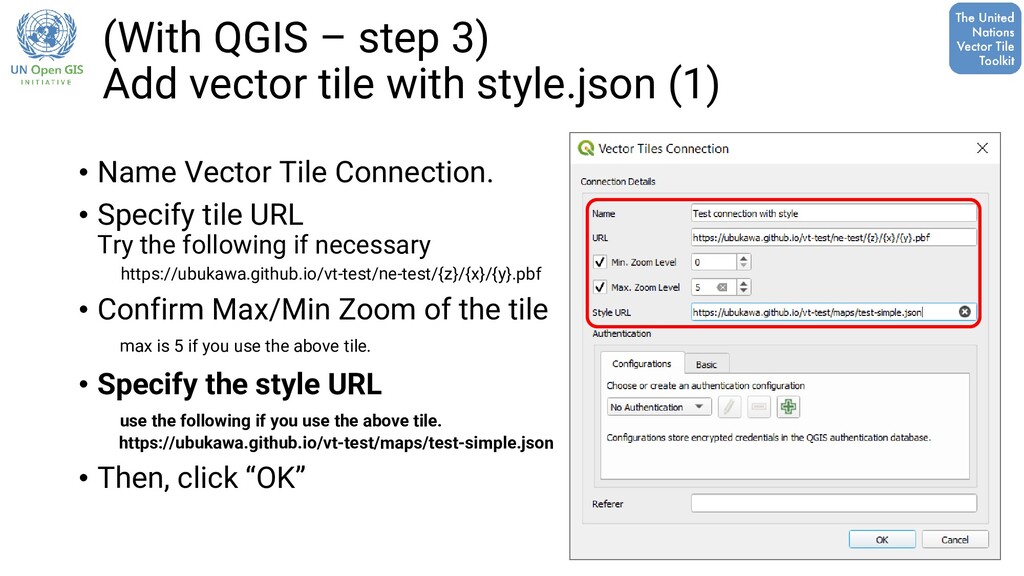
(1) • Name Vector Tile Connection. • Specify tile URL Try the following if necessary https://ubukawa.github.io/vt-test/ne-test/{z}/{x}/{y}.pbf • Confirm Max/Min Zoom of the tile max is 5 if you use the above tile. • Specify the style URL use the following if you use the above tile. https://ubukawa.github.io/vt-test/maps/test-simple.json • Then, click “OK”
(2) Displayed tile is from NaturalEarth (free data). The boundaries in the map is just for practice. They do not imply official endorsement/acceptance by the UN or any agencies. • Choose your tile in the Browser Panel. • Then, your vector tile will be added to the layers panel. • You will see vector tile with customized style. • QGIS does not work exactly same with mapbox-gl js library. So, the style for QGIS should be simple. (This case, the point layer uses icon and has no paint-info, so it was skipped.)
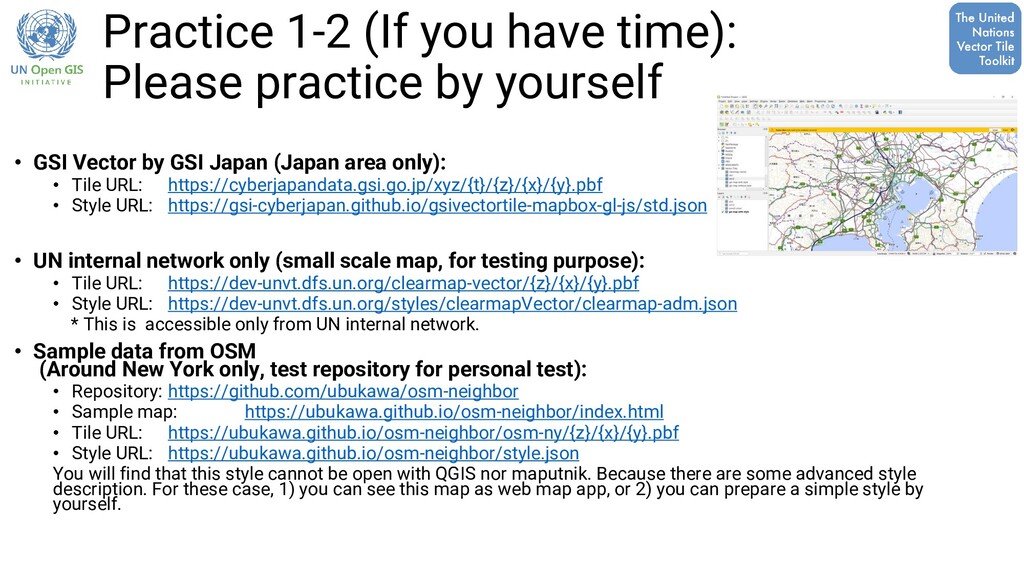
• GSI Vector by GSI Japan (Japan area only): • Tile URL: https://cyberjapandata.gsi.go.jp/xyz/{t}/{z}/{x}/{y}.pbf • Style URL: https://gsi-cyberjapan.github.io/gsivectortile-mapbox-gl-js/std.json • UN internal network only (small scale map, for testing purpose): • Tile URL: https://dev-unvt.dfs.un.org/clearmap-vector/{z}/{x}/{y}.pbf • Style URL: https://dev-unvt.dfs.un.org/styles/clearmapVector/clearmap-adm.json * This is accessible only from UN internal network. • Sample data from OSM (Around New York only, test repository for personal test): • Repository: https://github.com/ubukawa/osm-neighbor • Sample map: https://ubukawa.github.io/osm-neighbor/index.html • Tile URL: https://ubukawa.github.io/osm-neighbor/osm-ny/{z}/{x}/{y}.pbf • Style URL: https://ubukawa.github.io/osm-neighbor/style.json You will find that this style cannot be open with QGIS nor maputnik. Because there are some advanced style description. For these case, 1) you can see this map as web map app, or 2) you can prepare a simple style by yourself.
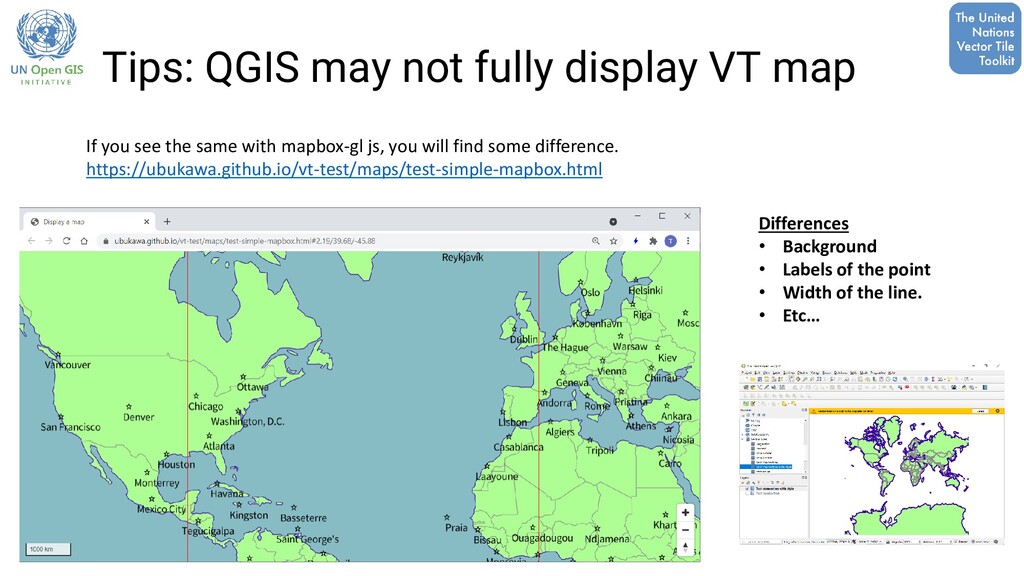
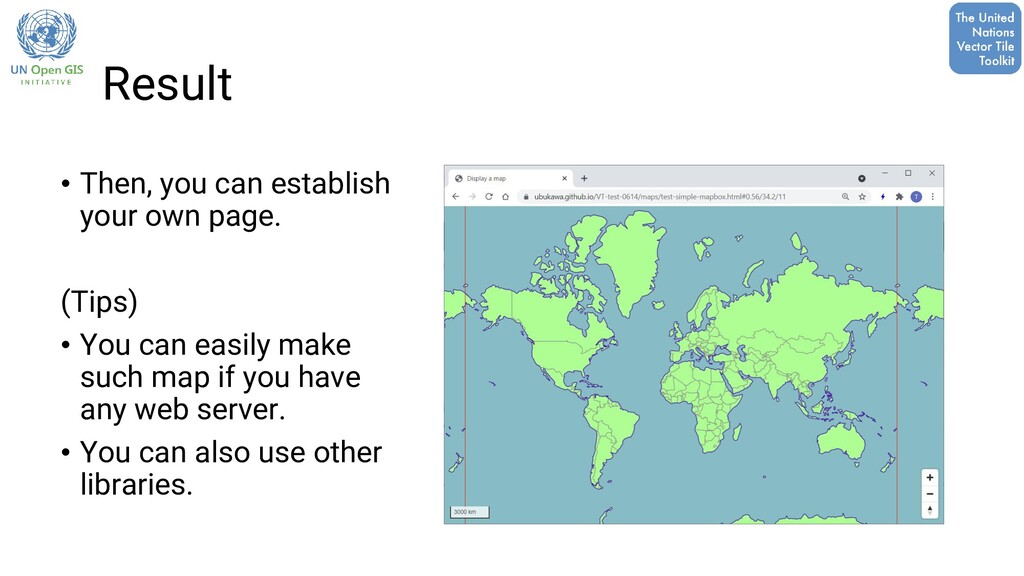
Background • Labels of the point • Width of the line. • Etc… If you see the same with mapbox-gl js, you will find some difference. https://ubukawa.github.io/vt-test/maps/test-simple-mapbox.html
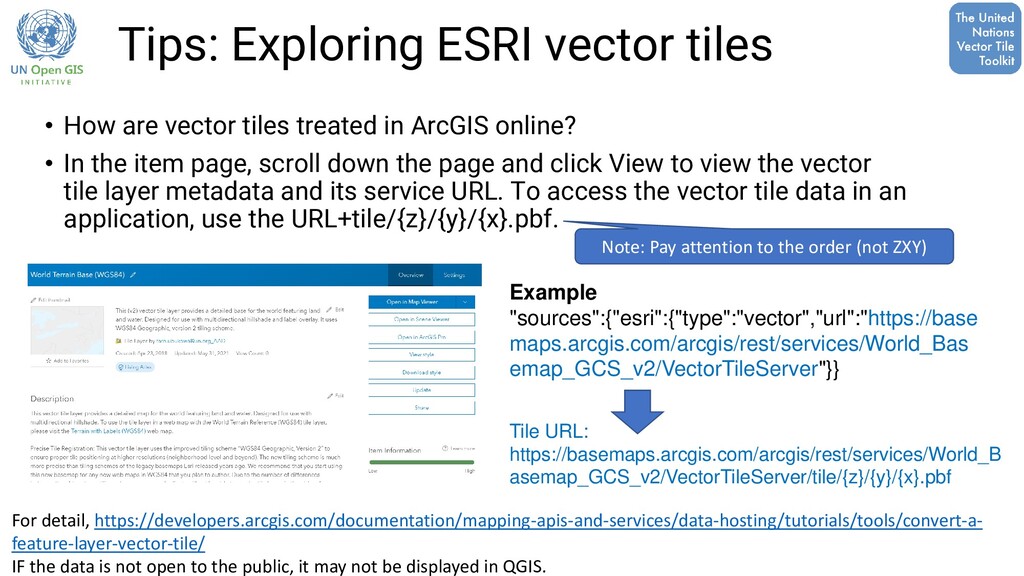
treated in ArcGIS online? • In the item page, scroll down the page and click View to view the vector tile layer metadata and its service URL. To access the vector tile data in an application, use the URL+tile/{z}/{y}/{x}.pbf. Example "sources":{"esri":{"type":"vector","url":"https://base maps.arcgis.com/arcgis/rest/services/World_Bas emap_GCS_v2/VectorTileServer"}} For detail, https://developers.arcgis.com/documentation/mapping-apis-and-services/data-hosting/tutorials/tools/convert-a- feature-layer-vector-tile/ IF the data is not open to the public, it may not be displayed in QGIS. Tile URL: https://basemaps.arcgis.com/arcgis/rest/services/World_B asemap_GCS_v2/VectorTileServer/tile/{z}/{y}/{x}.pbf Note: Pay attention to the order (not ZXY)
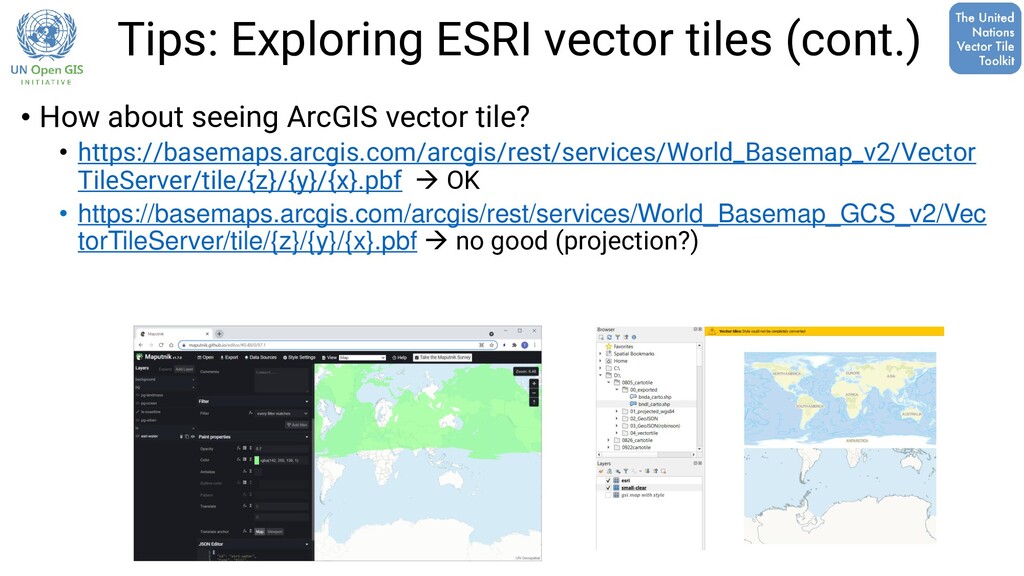
ArcGIS vector tile? • https://basemaps.arcgis.com/arcgis/rest/services/World_Basemap_v2/Vector TileServer/tile/{z}/{y}/{x}.pbf → OK • https://basemaps.arcgis.com/arcgis/rest/services/World_Basemap_GCS_v2/Vec torTileServer/tile/{z}/{y}/{x}.pbf → no good (projection?)
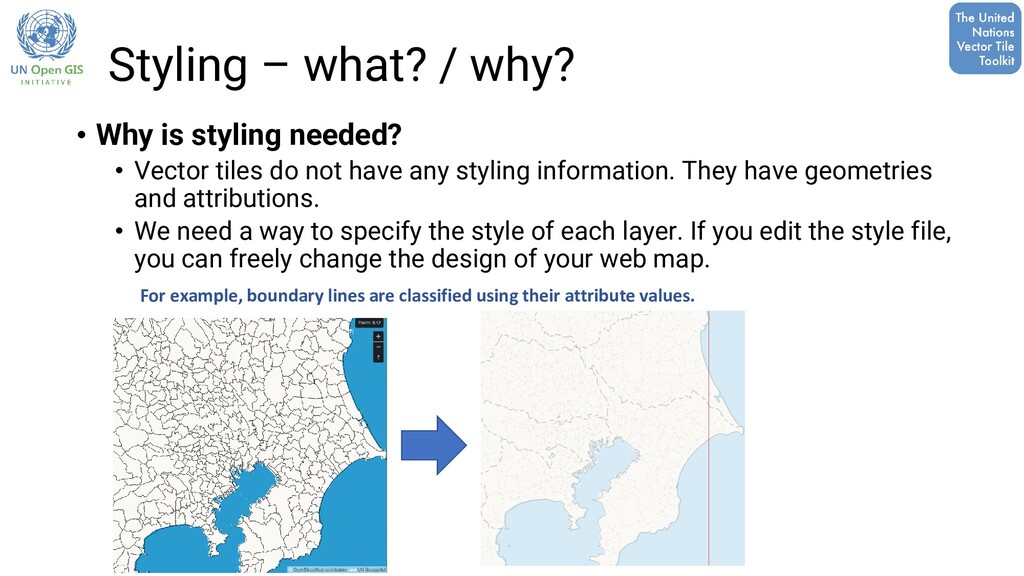
classified using their attribute values. • Why is styling needed? • Vector tiles do not have any styling information. They have geometries and attributions. • We need a way to specify the style of each layer. If you edit the style file, you can freely change the design of your web map.
add style information? mapbox-gl.js takes map styles that conform to the Mapbox Style Specification. For detail, go to: https://docs.mapbox.com/mapbox-gl-js/style-spec/ (Other map libraries also follows main part of that specification.) • A “style.json” • is a JSON object • with specific root level and nested properties (You can name it as you like.) • How we can make it? • By manual writing using text editor (it is tough work though…) • Mapbox Studio • Maputnik (an open source visual editor for mapbox style spec.) • UN Vector Tile Toolkit (e.g. naru with HOCON) ArcGIS Pro or ArcGIS Vector Tile Style editor may be able to edit style, but I felt that they were not so flexible for external source data.
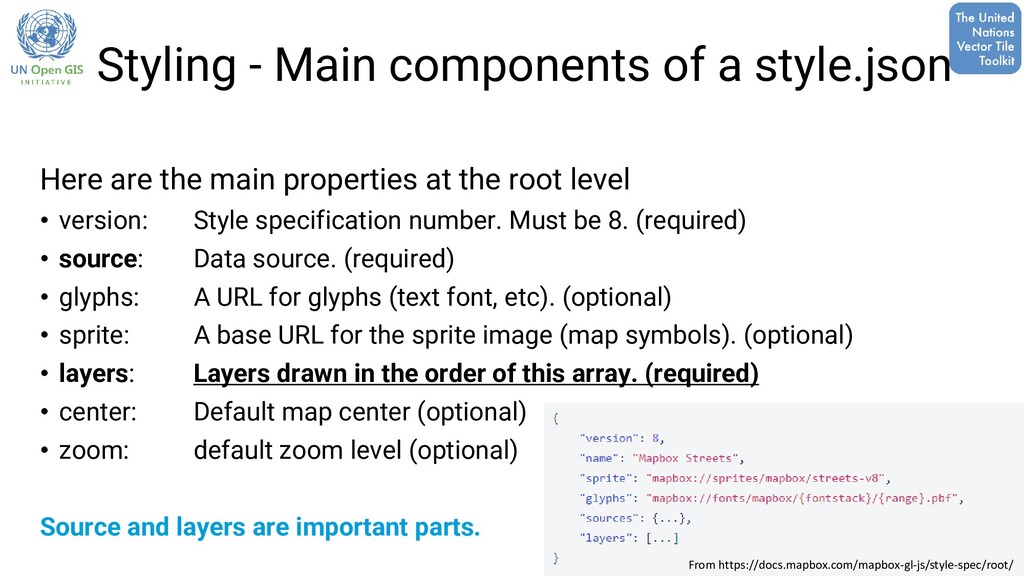
version: Style specification number. Must be 8. (required) • source: Data source. (required) • glyphs: A URL for glyphs (text font, etc). (optional) • sprite: A base URL for the sprite image (map symbols). (optional) • layers: Layers drawn in the order of this array. (required) • center: Default map center (optional) • zoom: default zoom level (optional) Source and layers are important parts. From https://docs.mapbox.com/mapbox-gl-js/style-spec/root/ Styling - Main components of a style.json
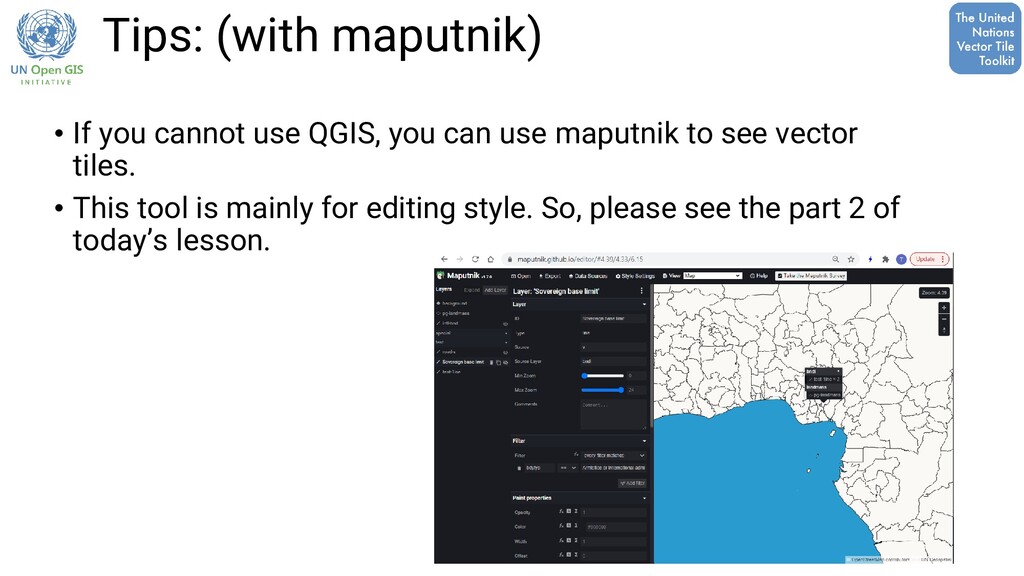
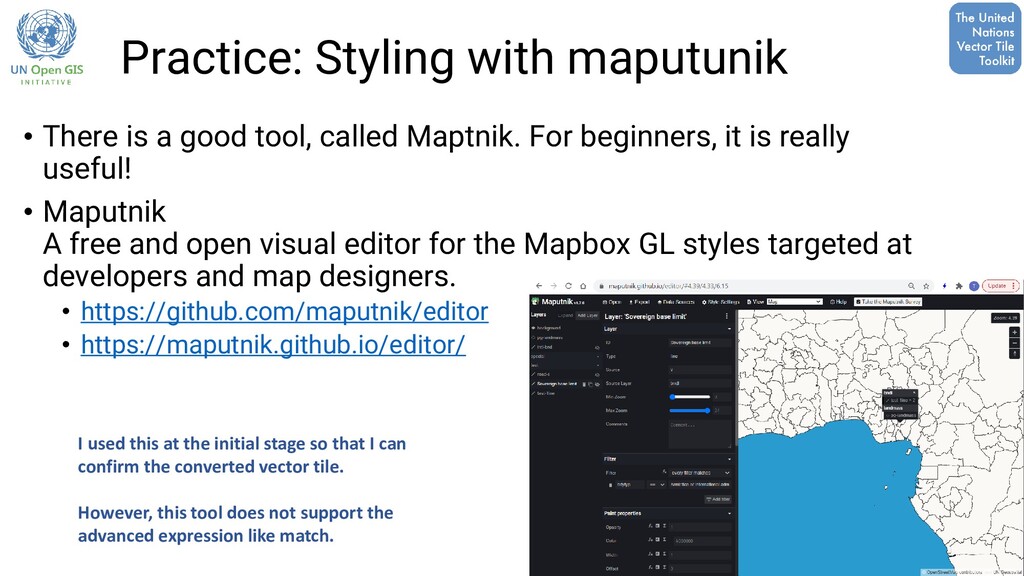
called Maptnik. For beginners, it is really useful! • Maputnik A free and open visual editor for the Mapbox GL styles targeted at developers and map designers. • https://github.com/maputnik/editor • https://maputnik.github.io/editor/ I used this at the initial stage so that I can confirm the converted vector tile. However, this tool does not support the advanced expression like match.
can import style.json (online) by specifying its path as below: https://maputnik.github.io/editor?style=(xxxx.json) • Let’s practice together with the following example. • https://maputnik.github.io/editor?style=https://ubukawa.github.io/vt- test/maps/test-simple.json
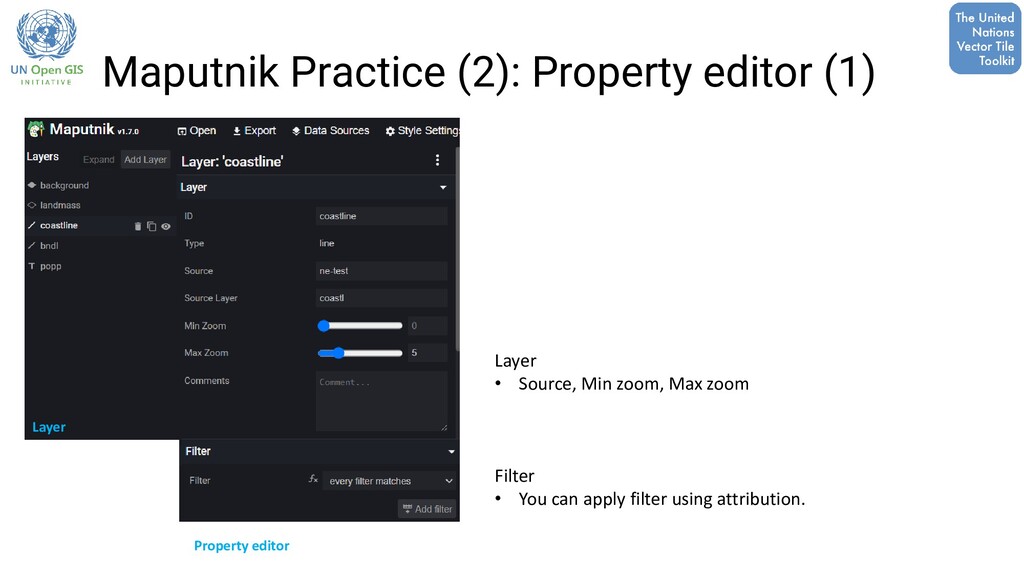
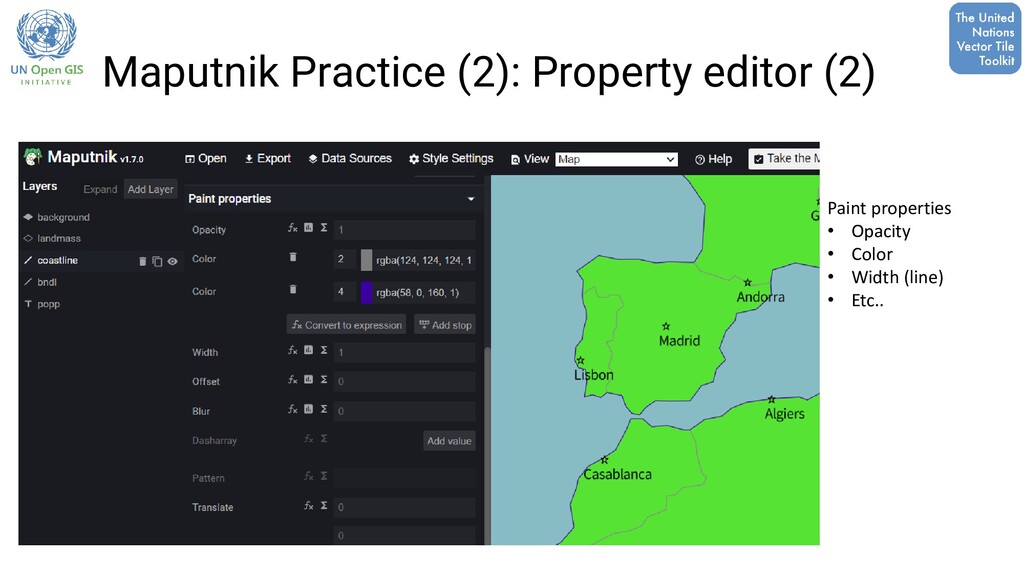
and glyphs location. (map symbols and text fonts) • “Data Sources” to confirm the vector tile source. • Click “export” to export the current style. • Edit layers • Fill (Polygon) • Line • Symbol Displayed tile is from NaturalEarth (free data). The boundaries in the map is just for practice. They do not imply official endorsement/acceptance by the UN or any agencies. Top Menu Layer Property editor Map View
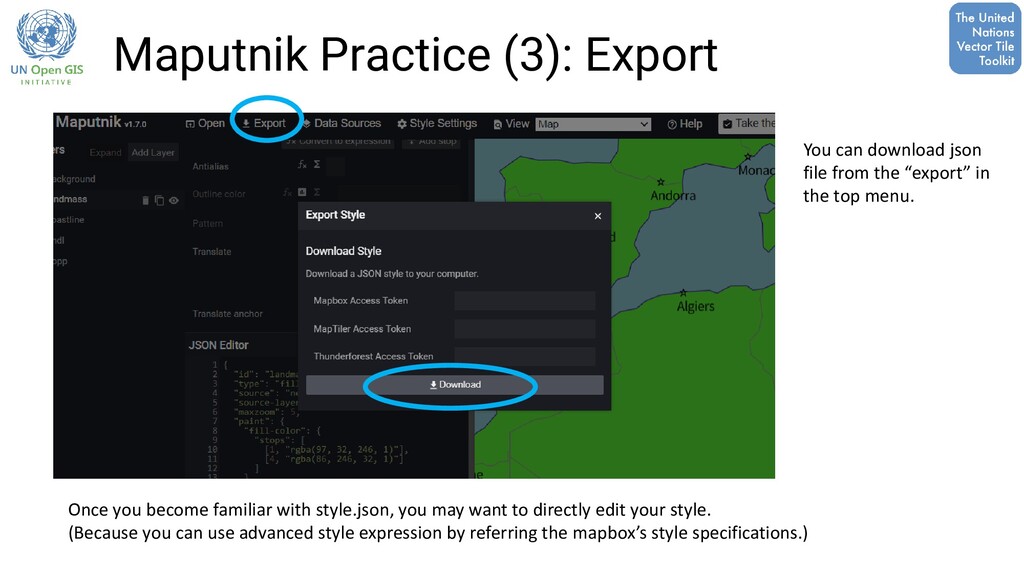
the “export” in the top menu. Once you become familiar with style.json, you may want to directly edit your style. (Because you can use advanced style expression by referring the mapbox’s style specifications.)
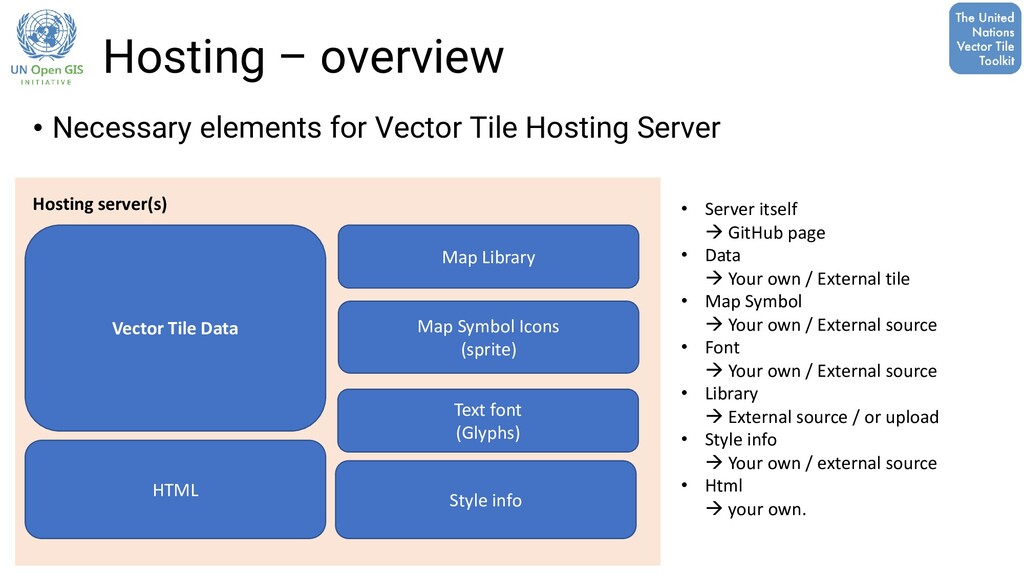
Server Vector Tile Data Map Library Map Symbol Icons (sprite) Text font (Glyphs) HTML Hosting server(s) • Server itself → GitHub page • Data → Your own / External tile • Map Symbol → Your own / External source • Font → Your own / External source • Library → External source / or upload • Style info → Your own / external source • Html → your own. Style info
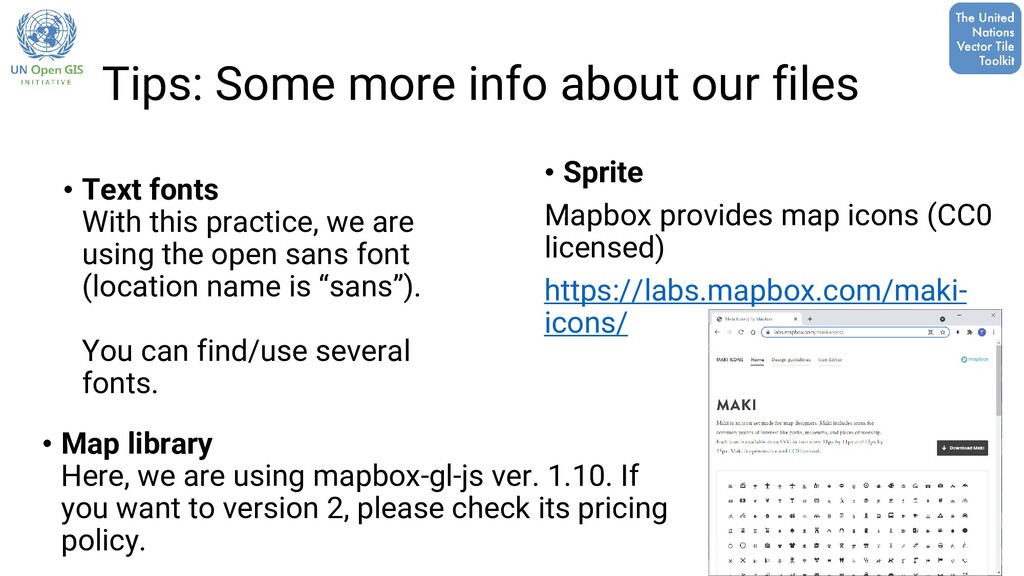
With this practice, we are using the open sans font (location name is “sans”). You can find/use several fonts. • Sprite Mapbox provides map icons (CC0 licensed) https://labs.mapbox.com/maki- icons/ • Map library Here, we are using mapbox-gl-js ver. 1.10. If you want to version 2, please check its pricing policy.
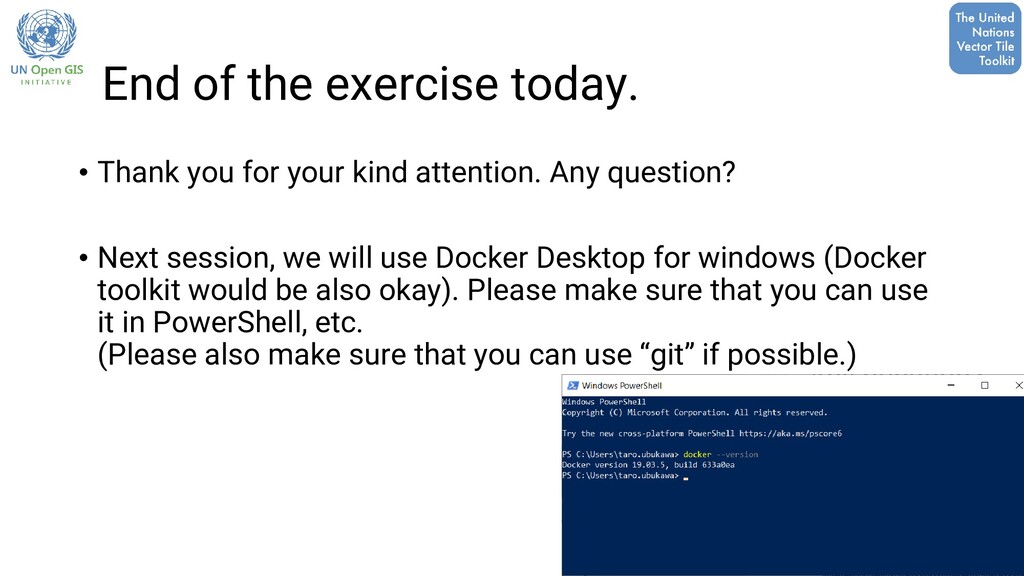
kind attention. Any question? • Next session, we will use Docker Desktop for windows (Docker toolkit would be also okay). Please make sure that you can use it in PowerShell, etc. (Please also make sure that you can use “git” if possible.)