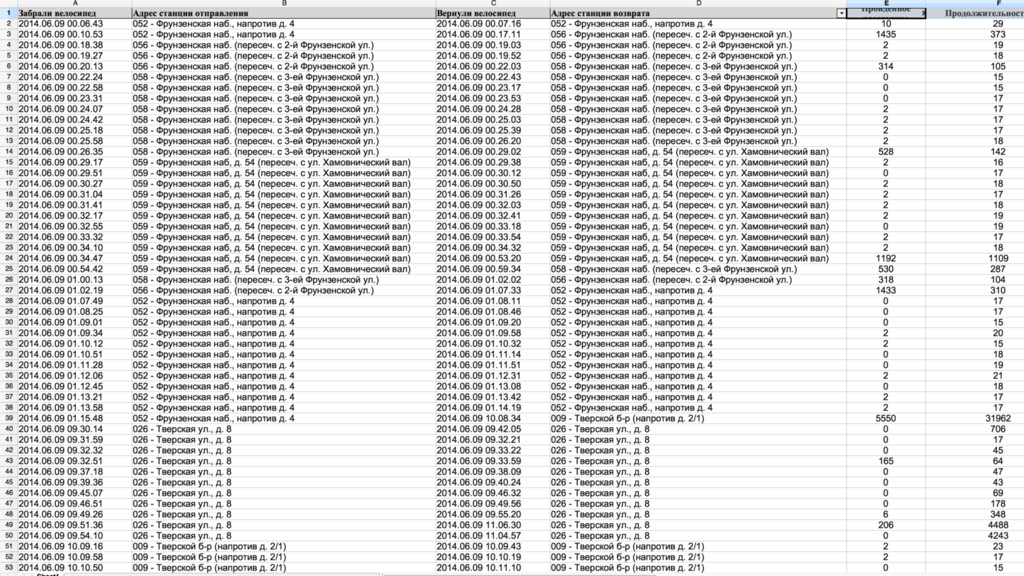
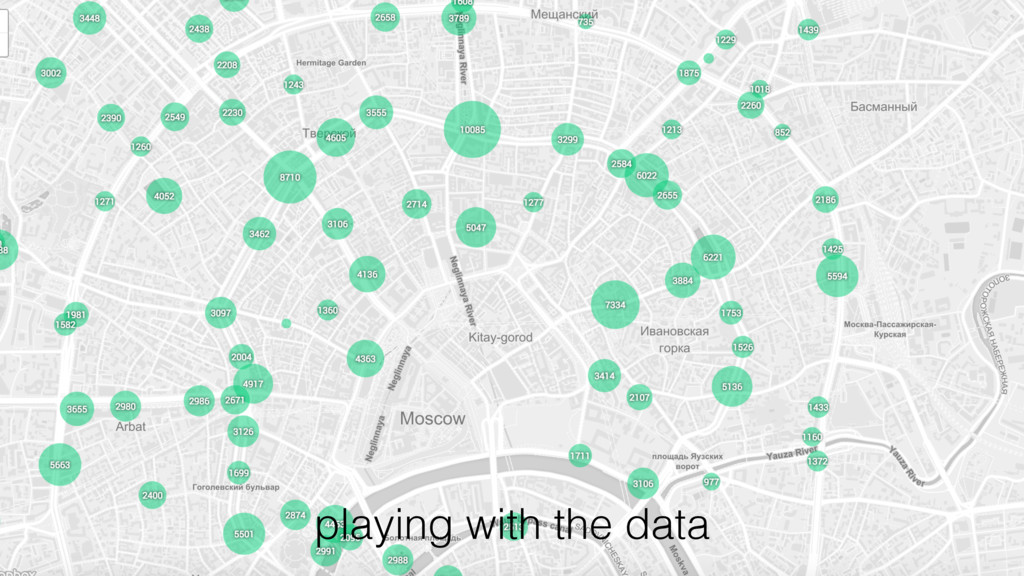
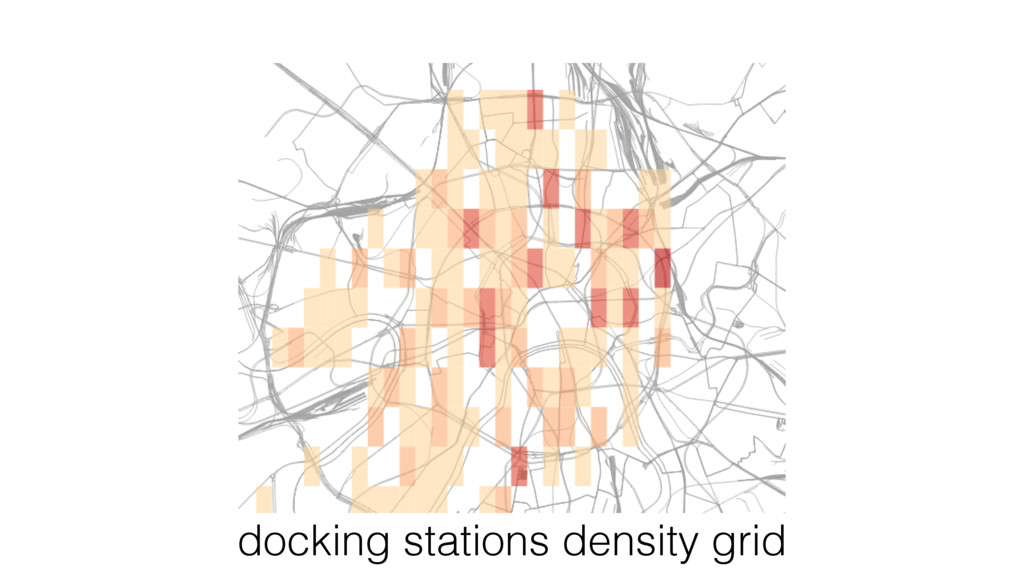
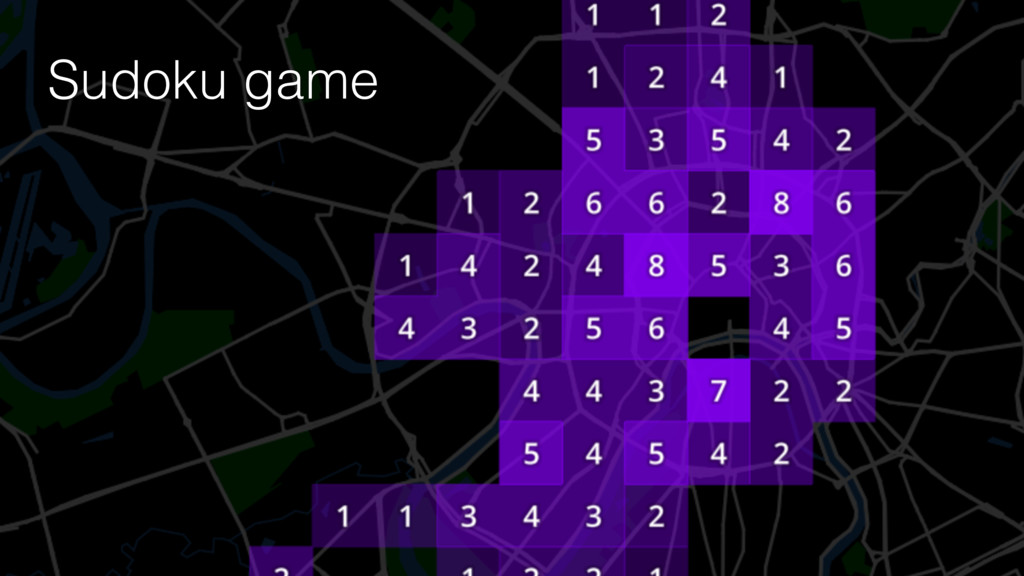
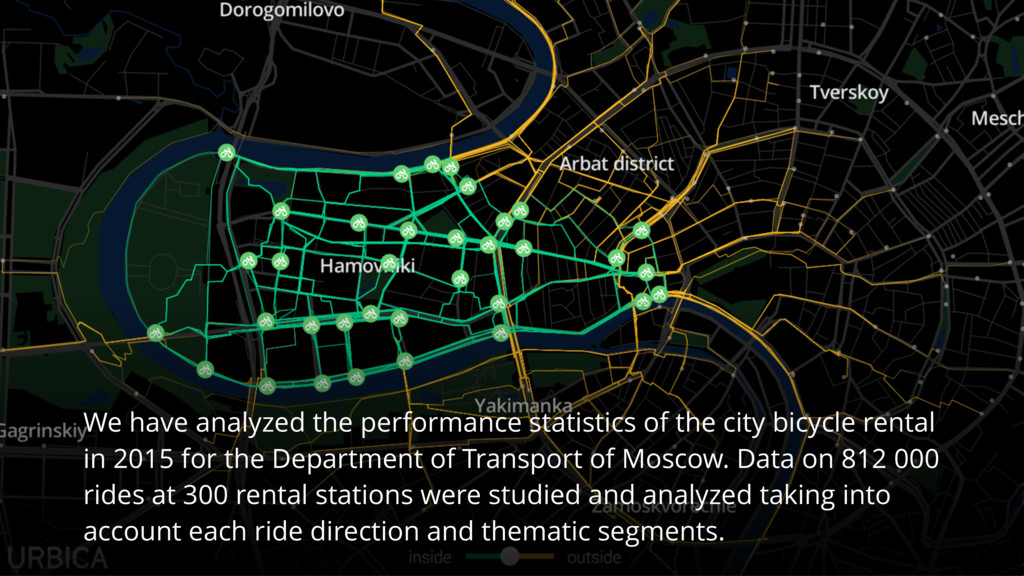
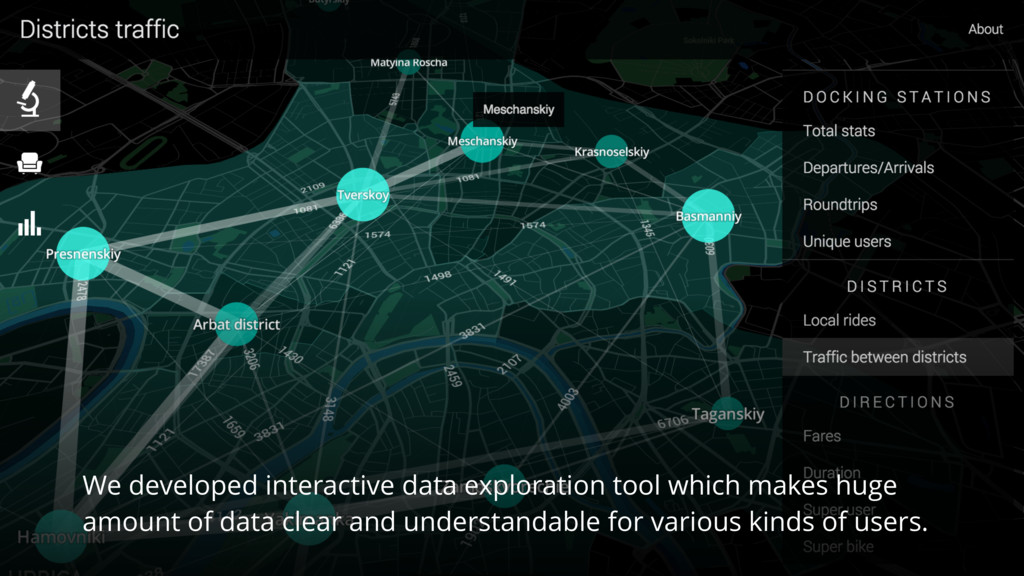
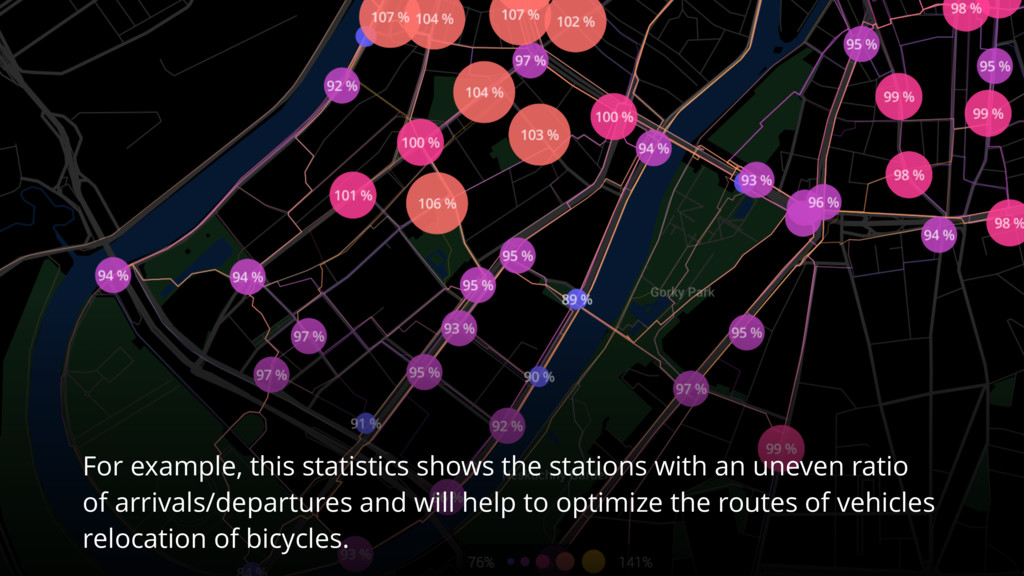
rental in 2015 for the Department of Transport of Moscow. Data on 812 000 rides at 300 rental stations were studied and analyzed taking into account each ride direction and thematic segments.
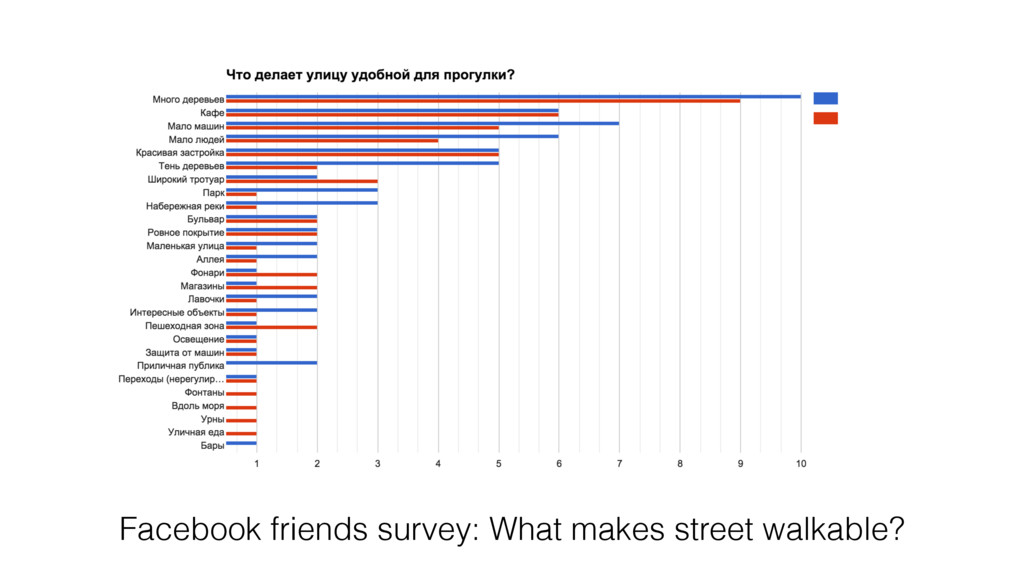
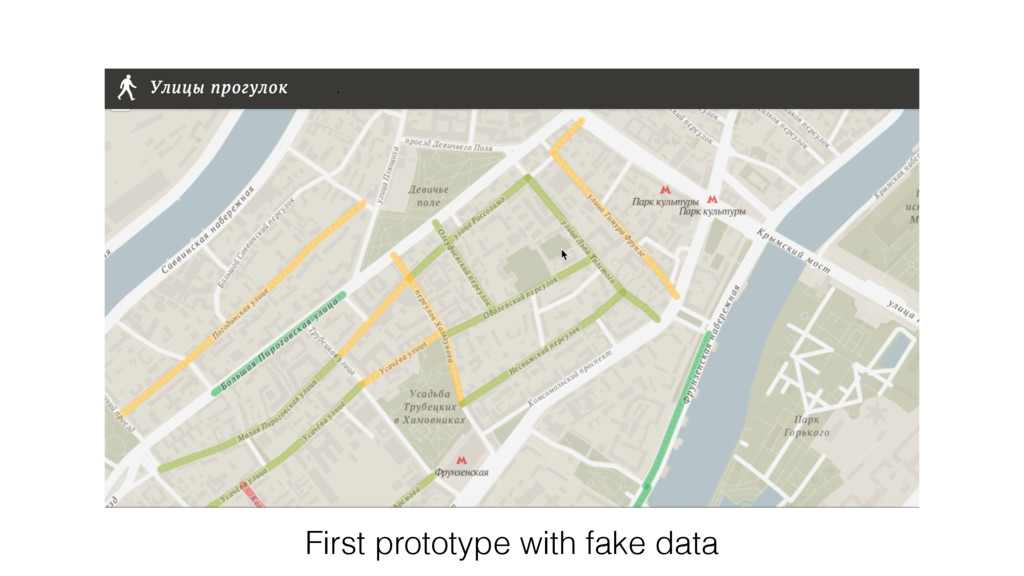
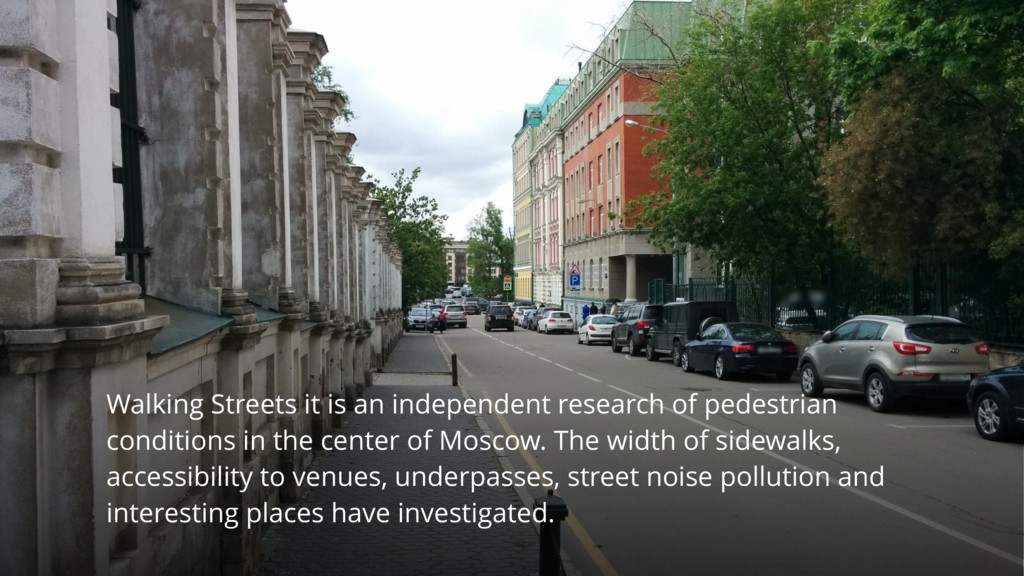
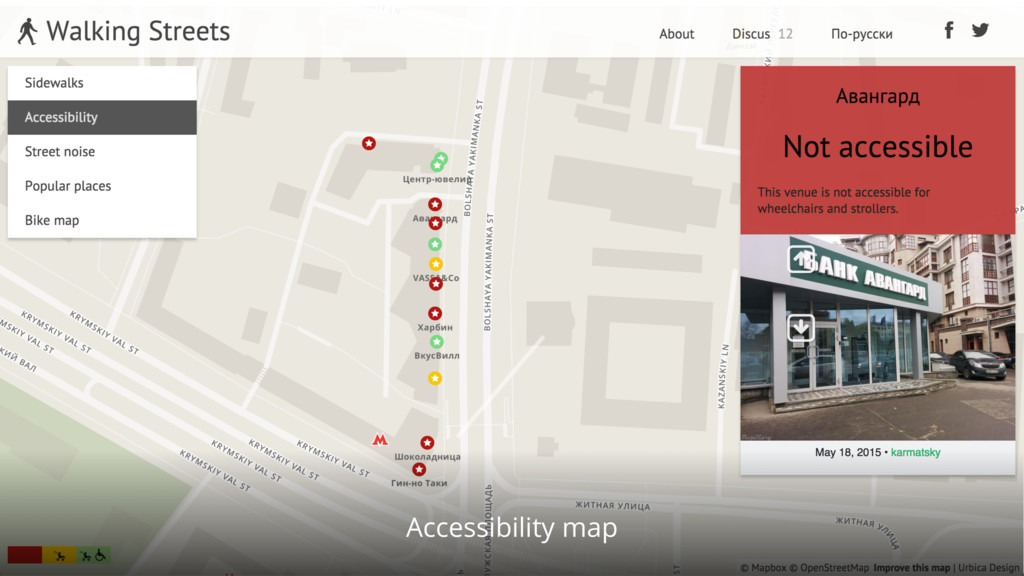
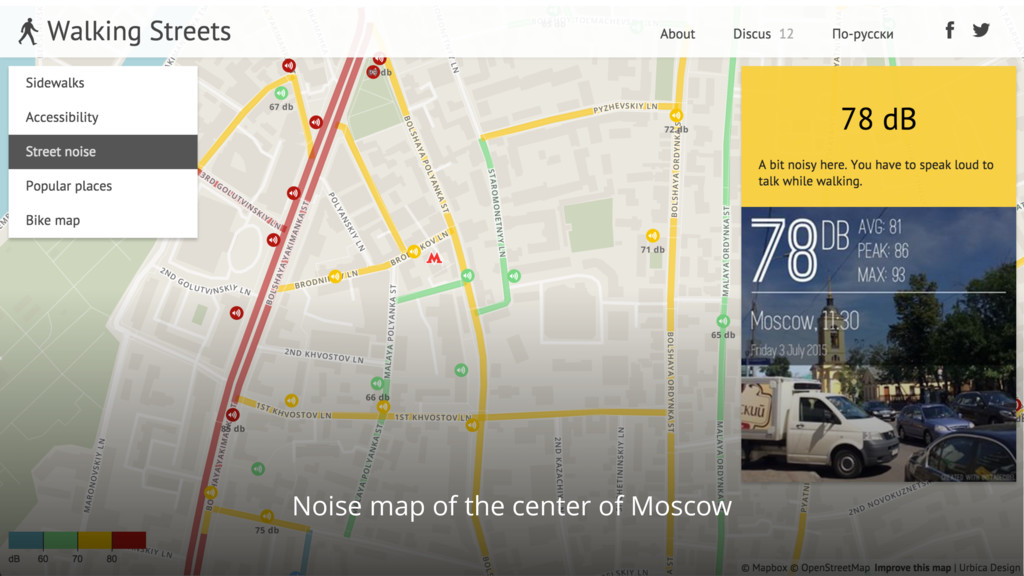
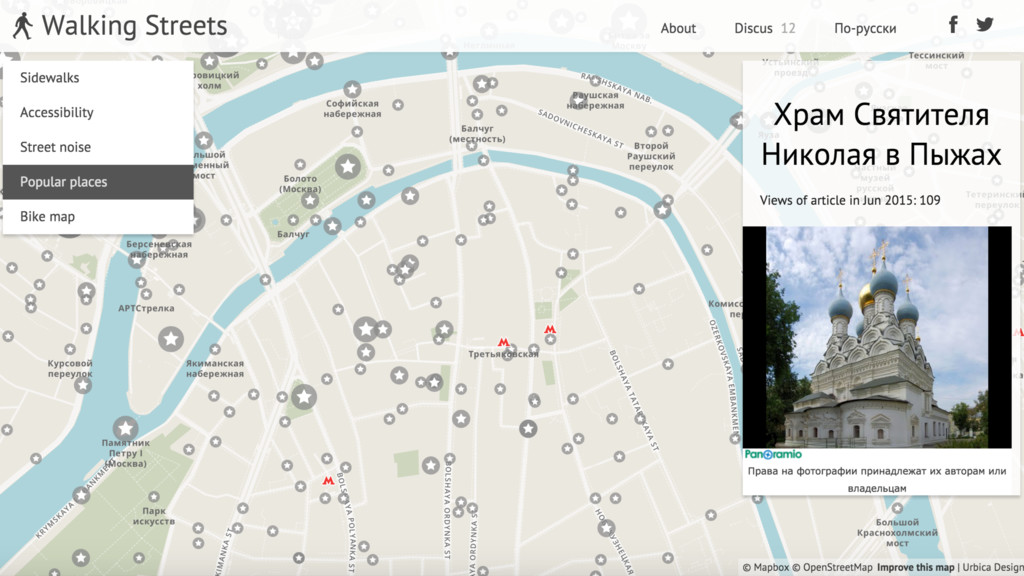
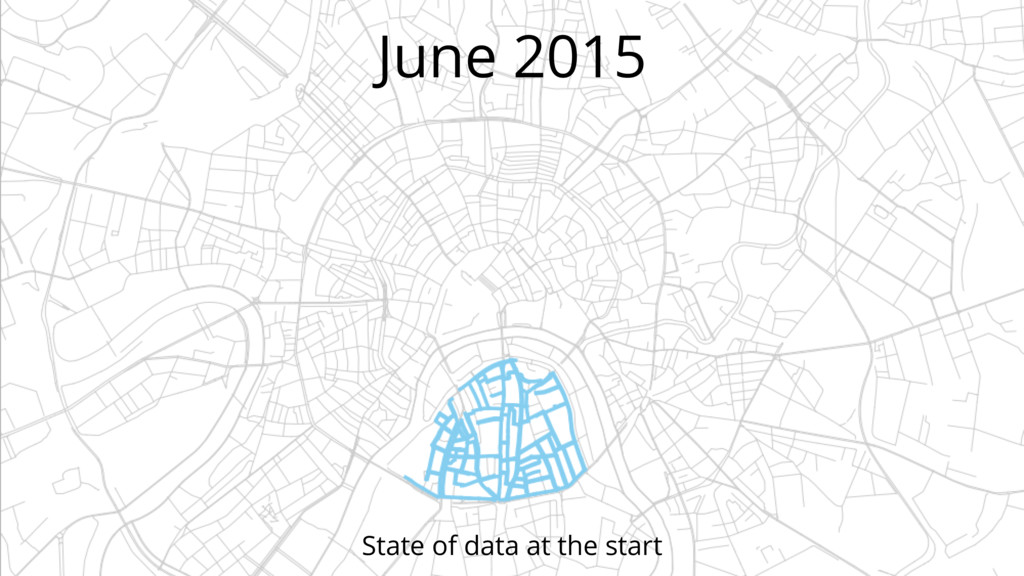
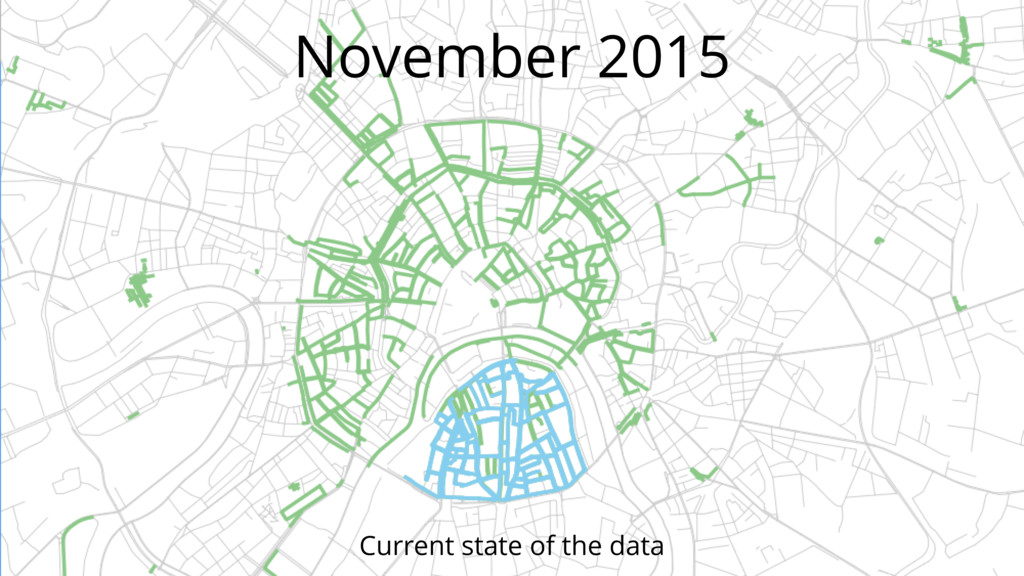
in the center of Moscow. The width of sidewalks, accessibility to venues, underpasses, street noise pollution and interesting places have investigated.