FADU-UBA ➔ Master in Communication Design. ➔ I studied infographics in the context of journalism. ➔ Since 2015, I work as an Experience Designer consultant with a strong focus on research, and have since then been presenting results. ➔ Currently, I am a Lead Experience Designer at Bound.
➔ Understand which infographic components are most appropriate for information types typically found in research reports. ➔ Keep the research report coherent and cohesive through consecutive slides.
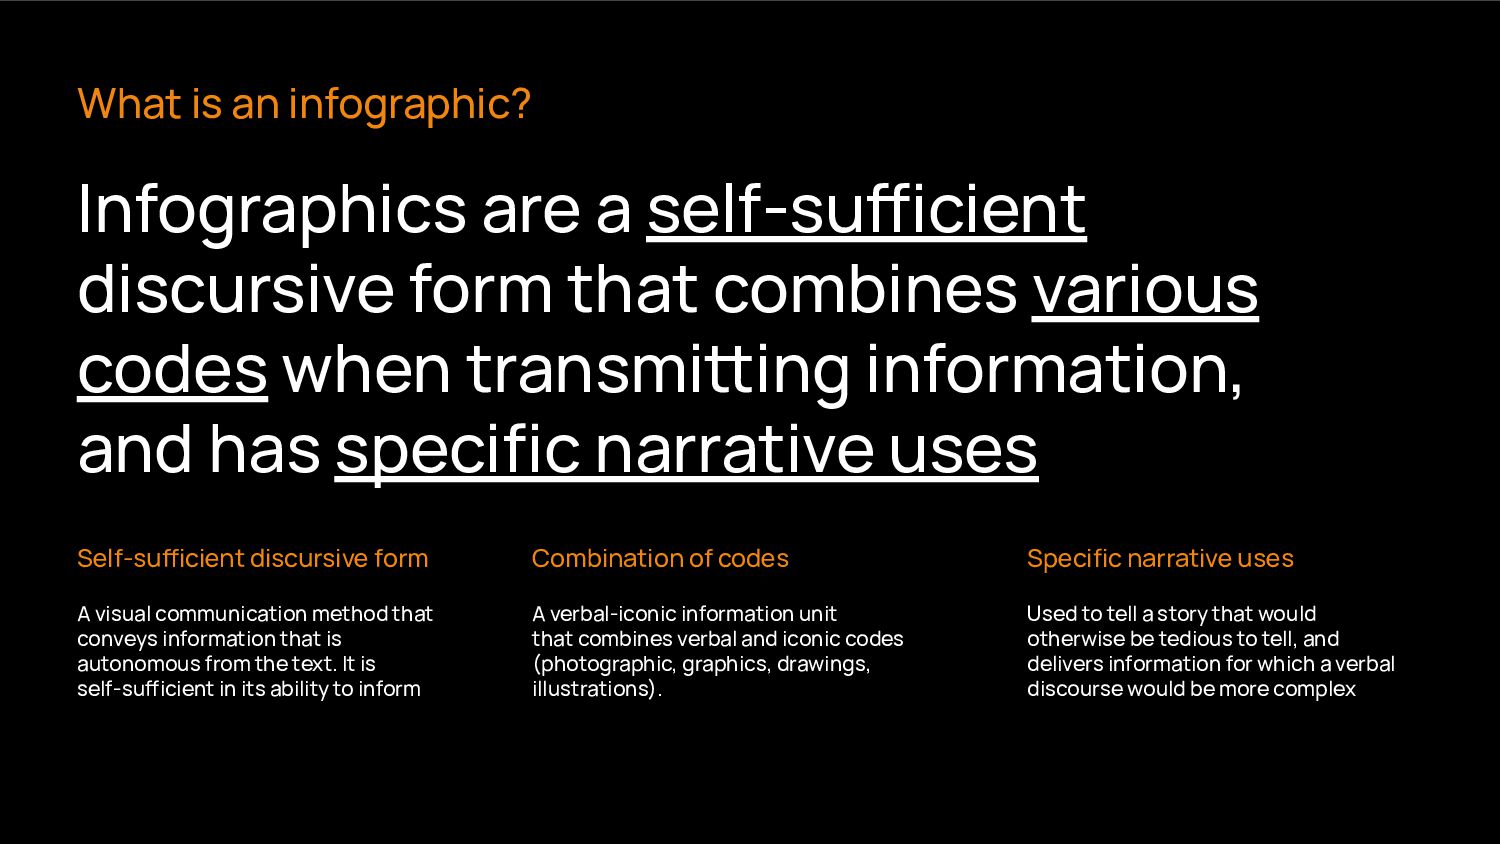
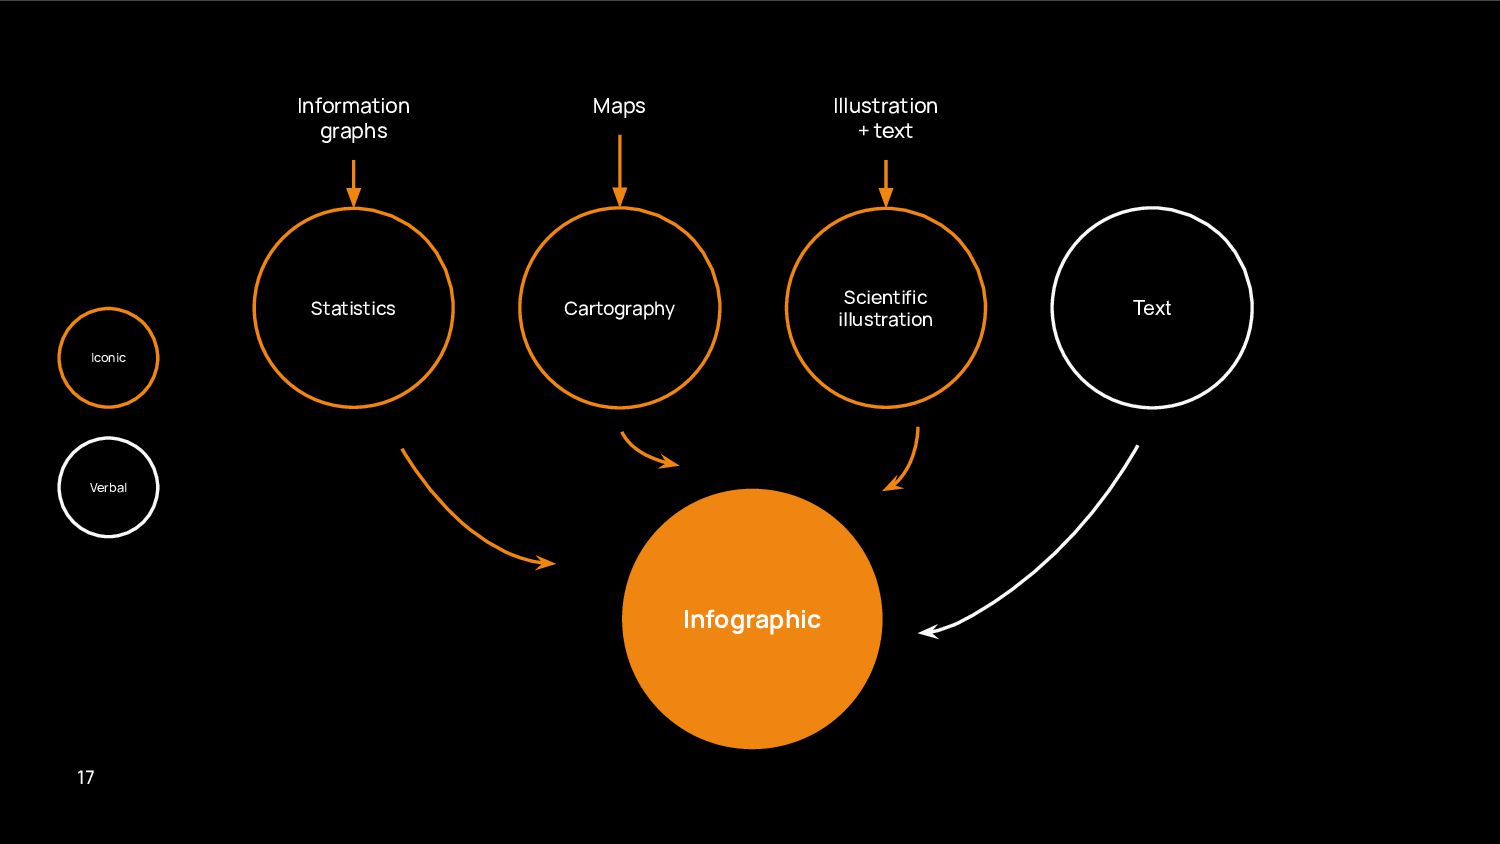
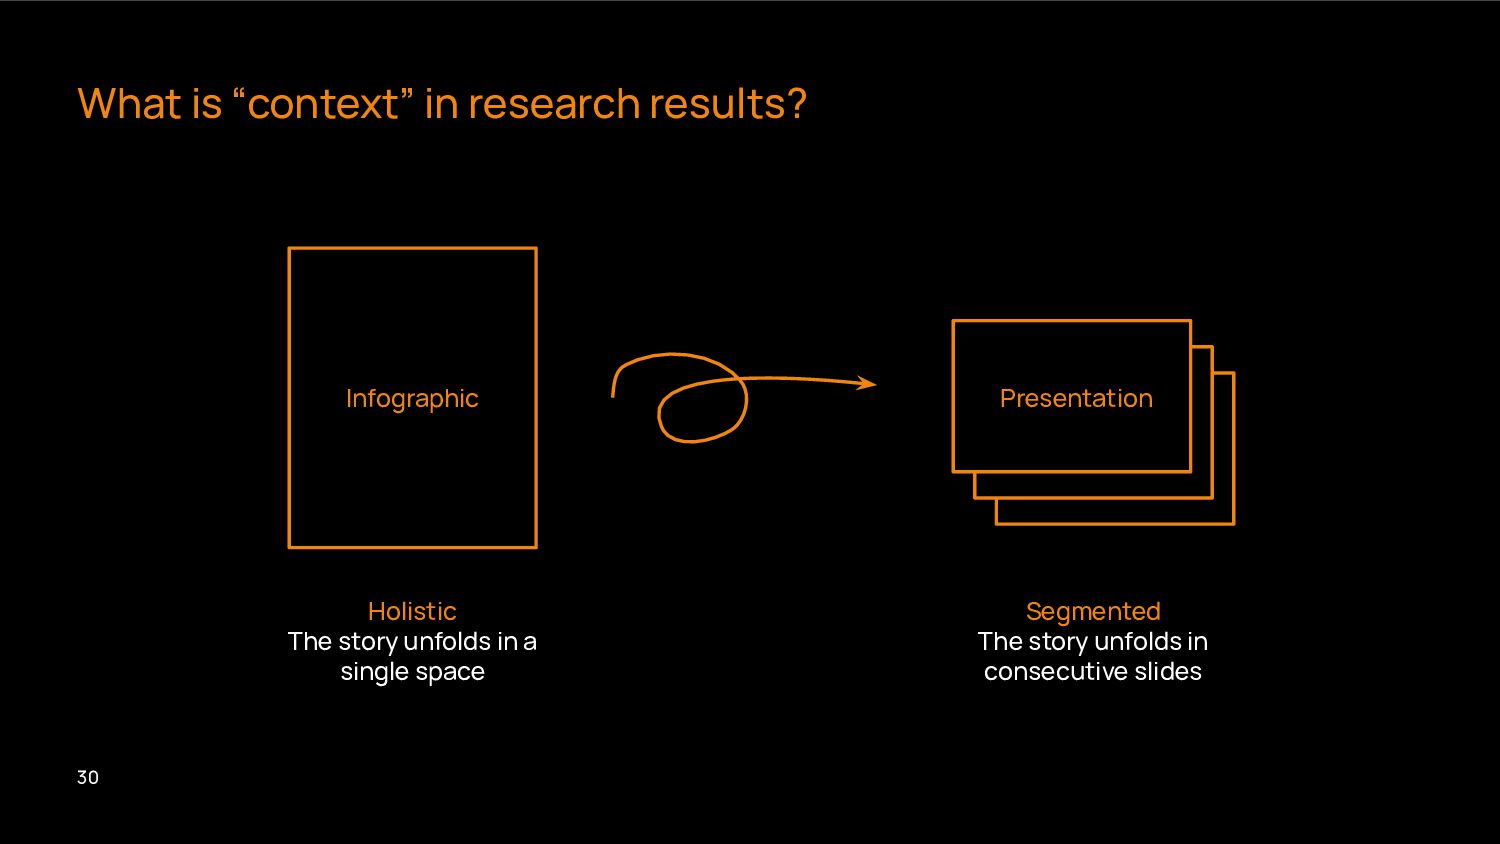
from the text. It is self-suicient in its ability to inform What is an infographic? Infographics are a self-suicient discursive form that combines various codes when transmiing information, and has specific narrative uses Self-suicient discursive form Combination of codes Specific narrative uses A verbal-iconic information unit that combines verbal and iconic codes (photographic, graphics, drawings, illustrations). Used to tell a story that would otherwise be tedious to tell, and delivers information for which a verbal discourse would be more complex
images using the term "infographics" will throw back results that can not be considered infographics under the definition we have provided, but components of it. 09
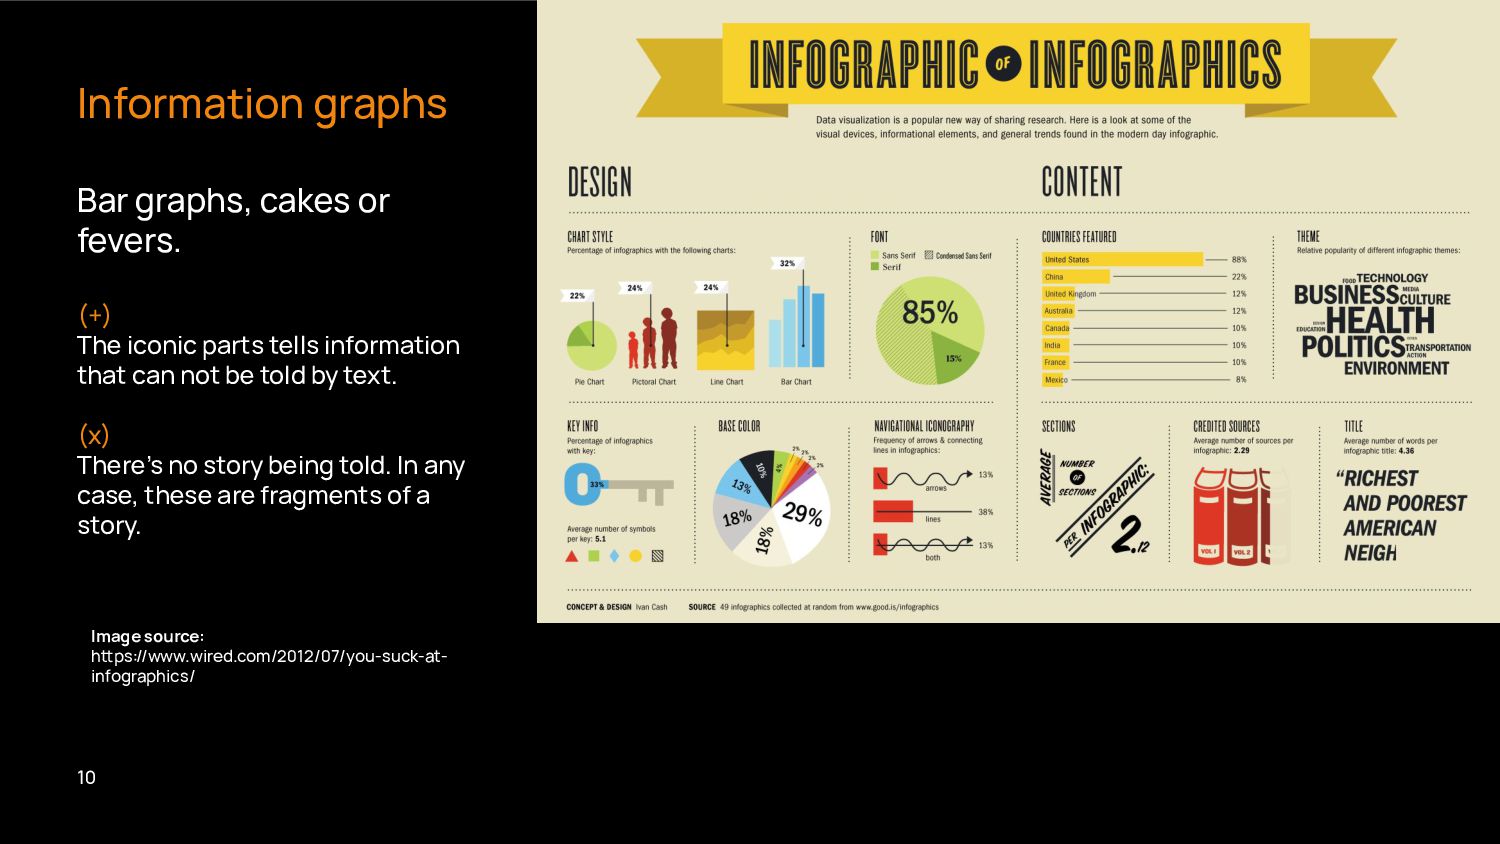
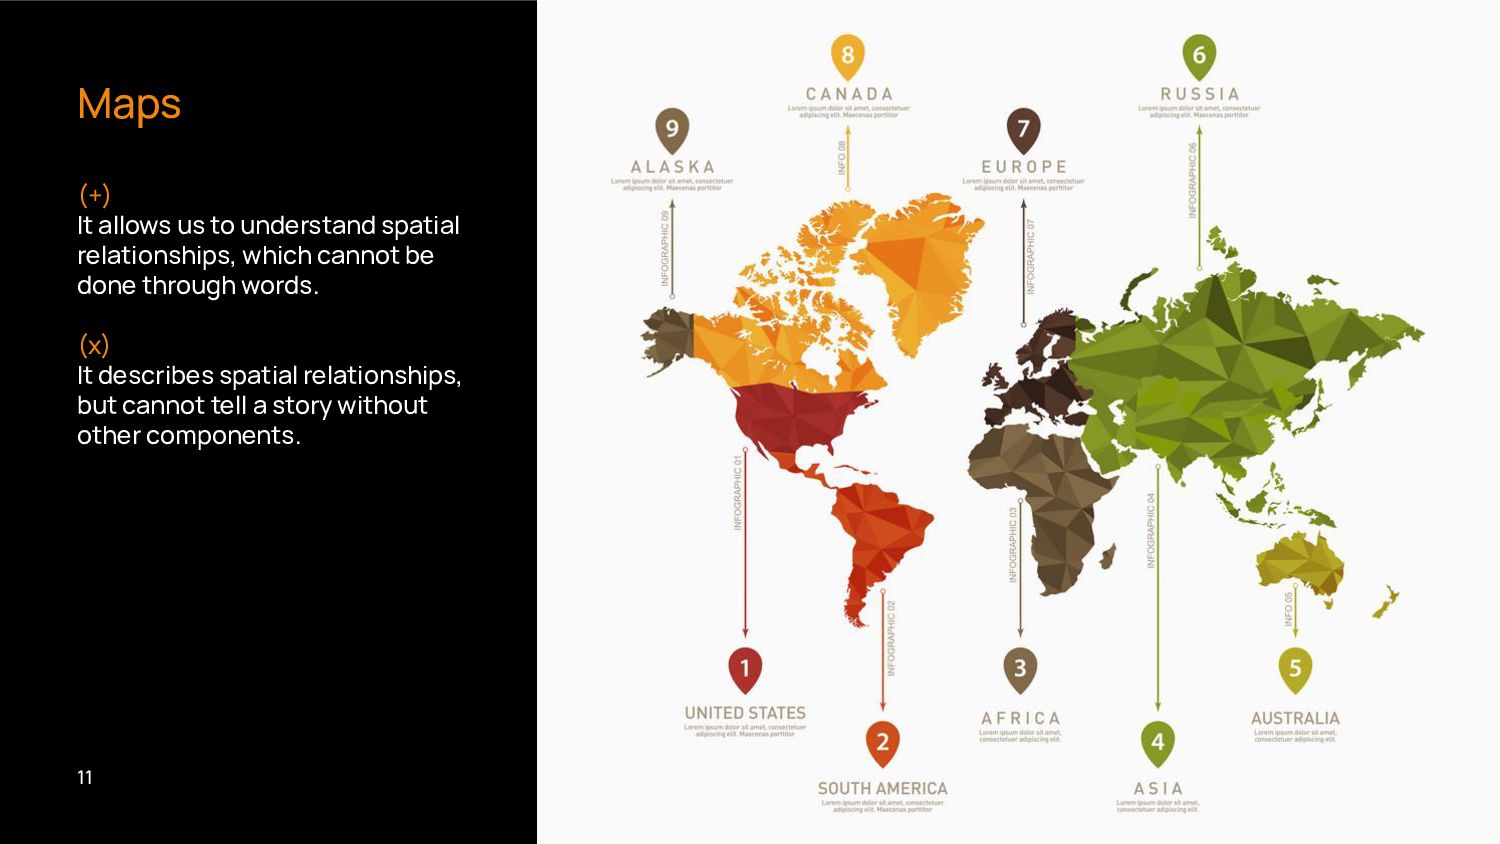
parts tells information that can not be told by text. (x) There’s no story being told. In any case, these are fragments of a story. Image source: hps://www.wired.com/2012/07/you-suck-at- infographics/ 10
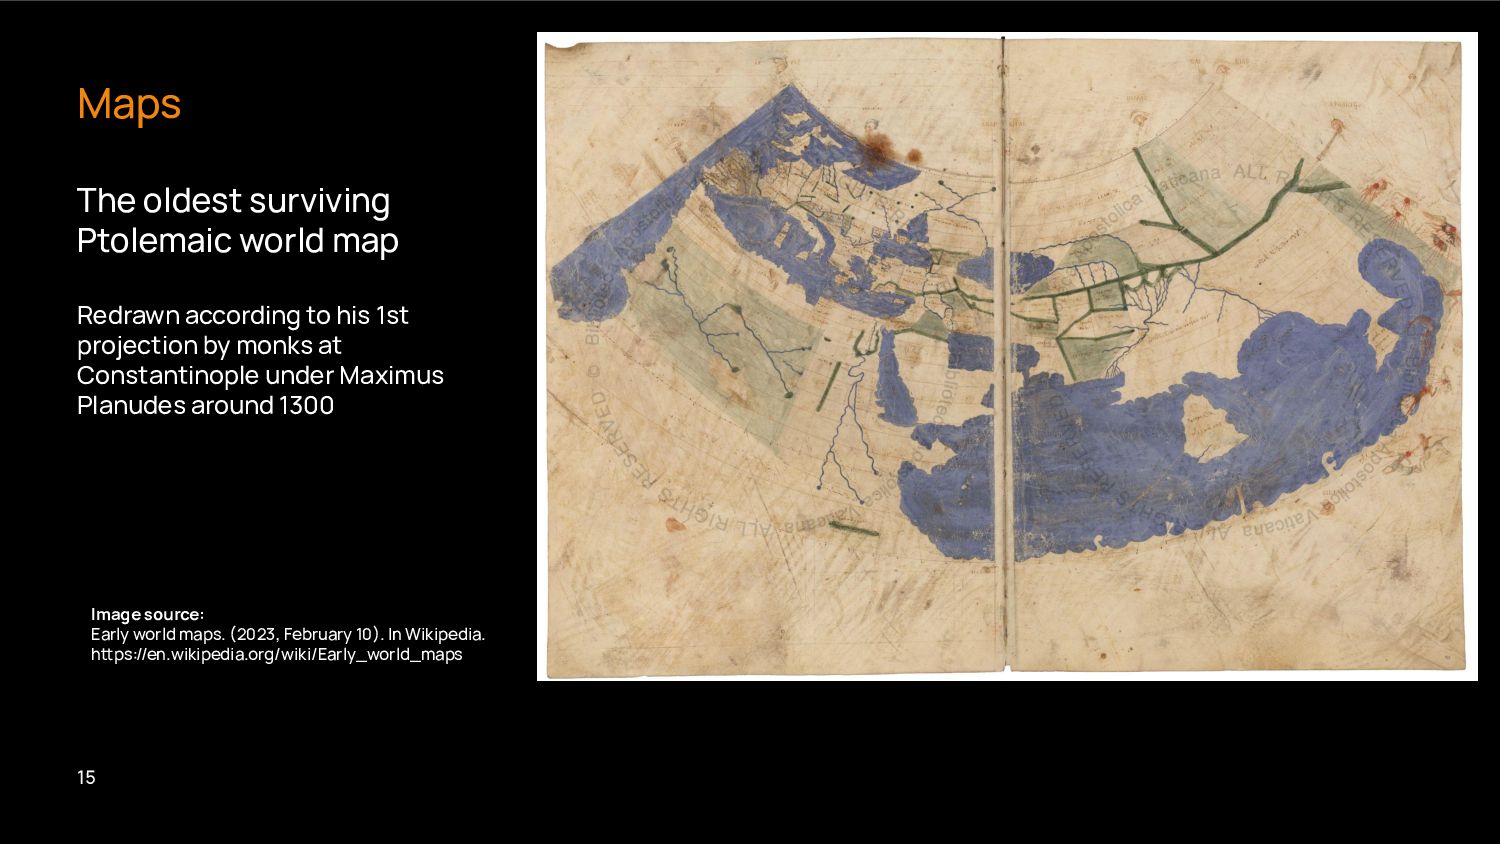
1st projection by monks at Constantinople under Maximus Planudes around 1300 Maps Image source: Early world maps. (2023, February 10). In Wikipedia. hps://en.wikipedia.org/wiki/Early_world_maps 15
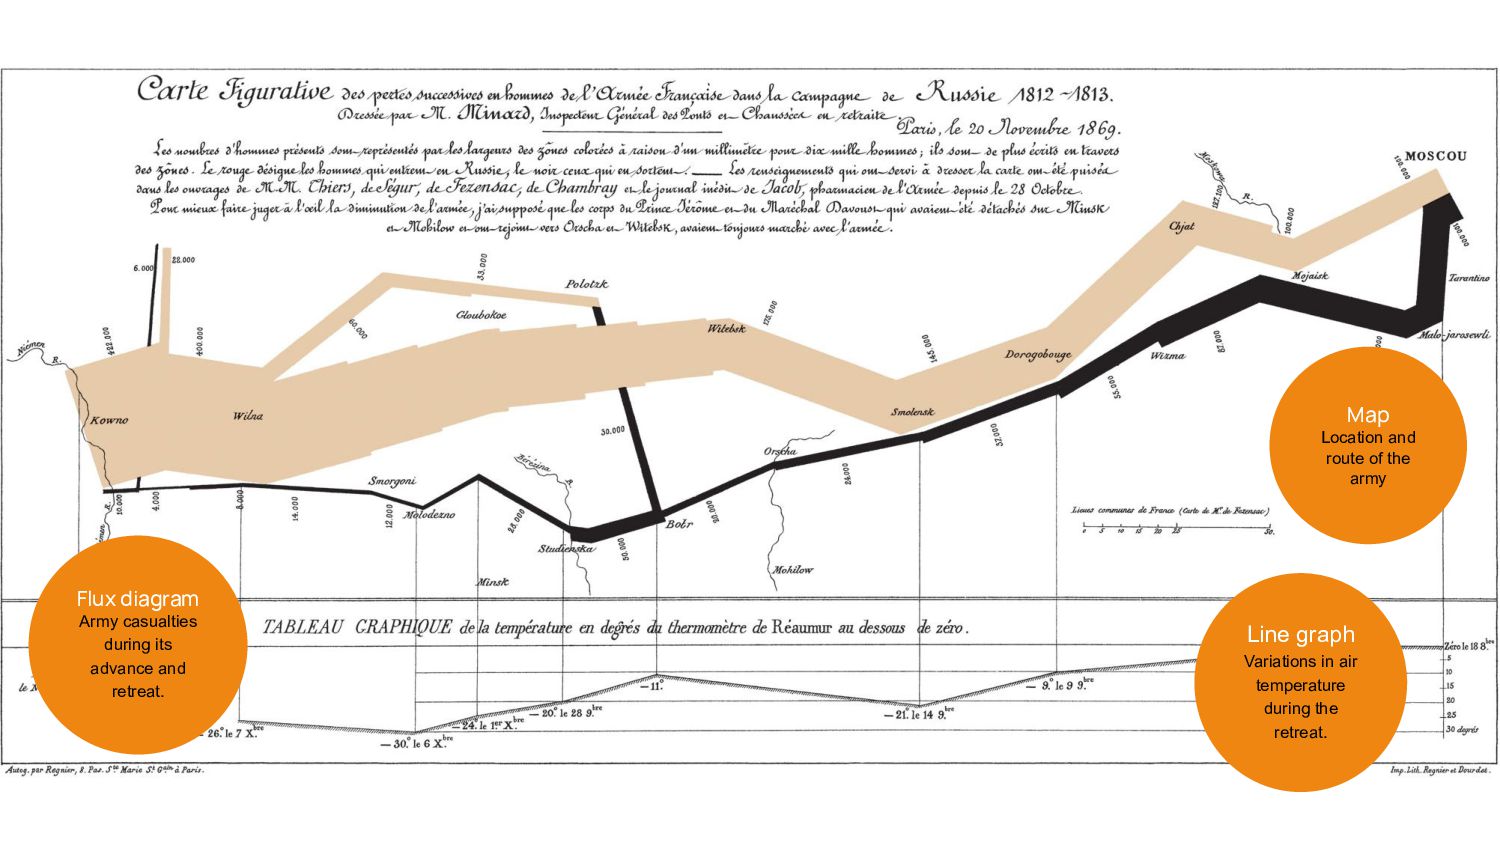
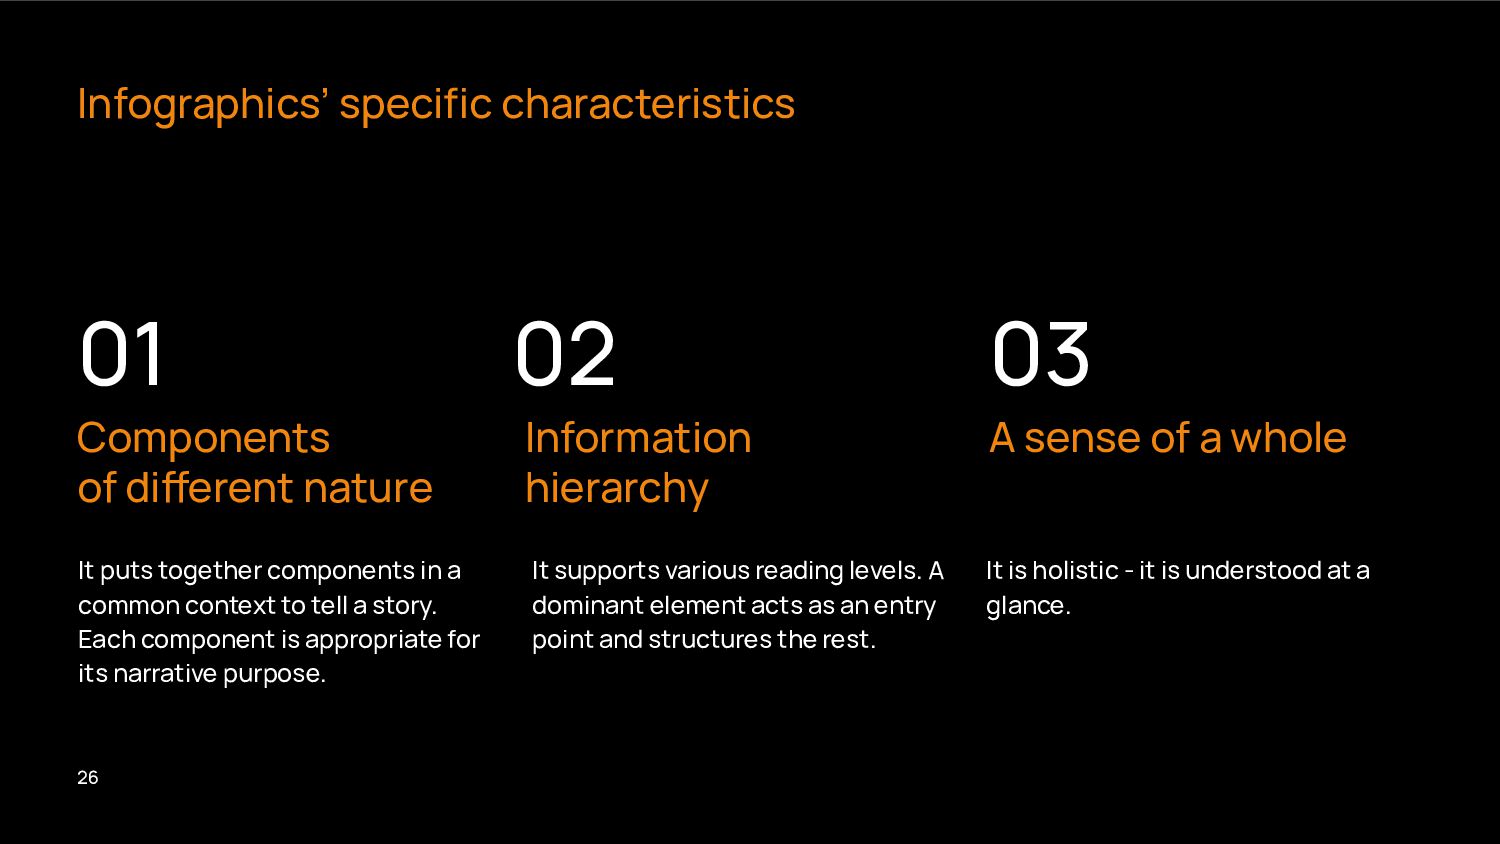
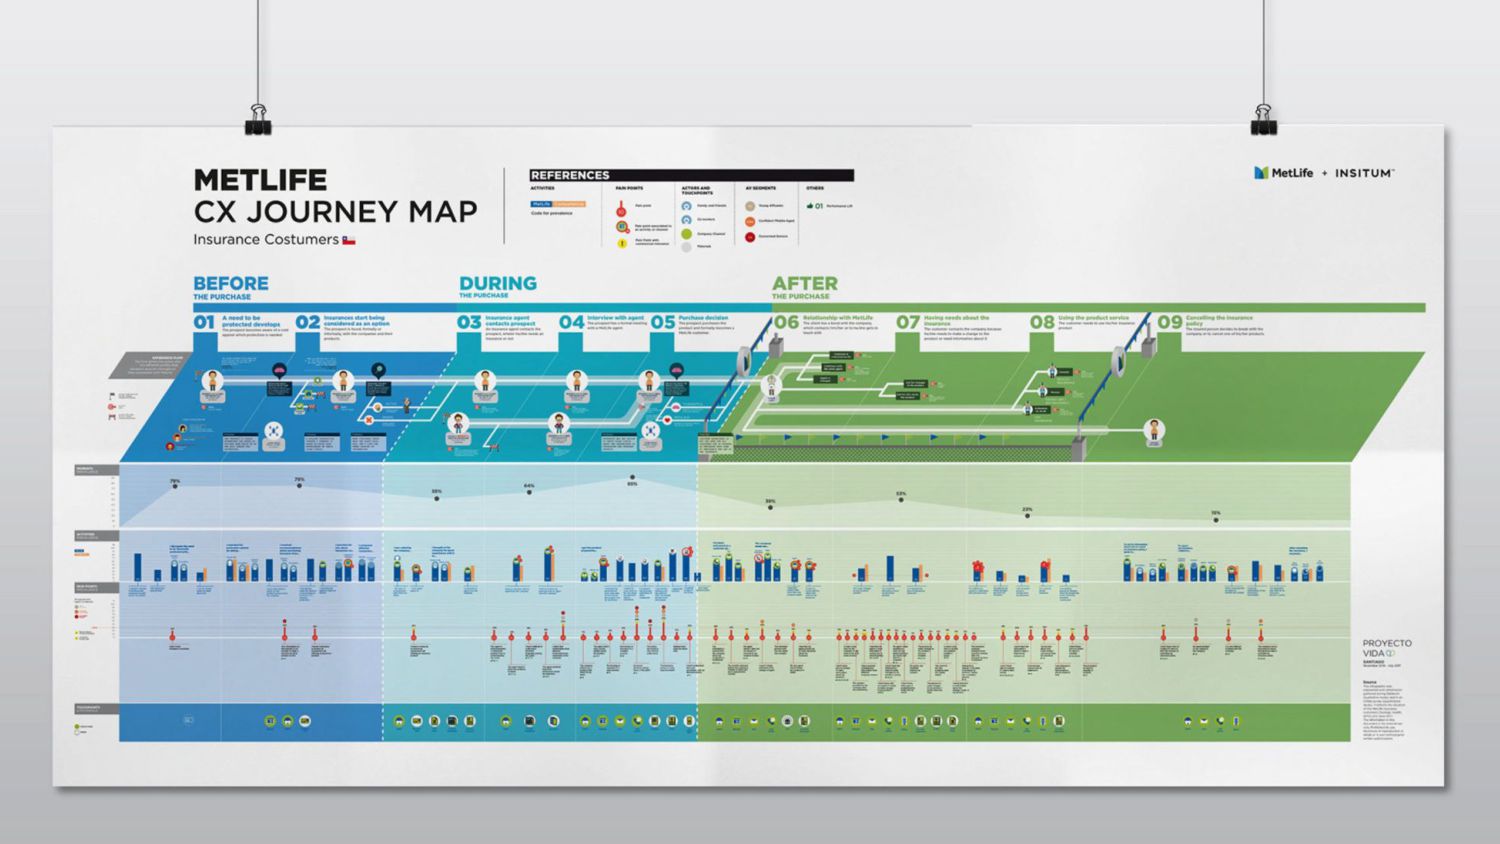
a story. Each component is appropriate for its narrative purpose. It supports various reading levels. A dominant element acts as an entry point and structures the rest. It is holistic - it is understood at a glance. Infographics’ specific characteristics Components of dierent nature Information hierarchy A sense of a whole 01 02 03 26
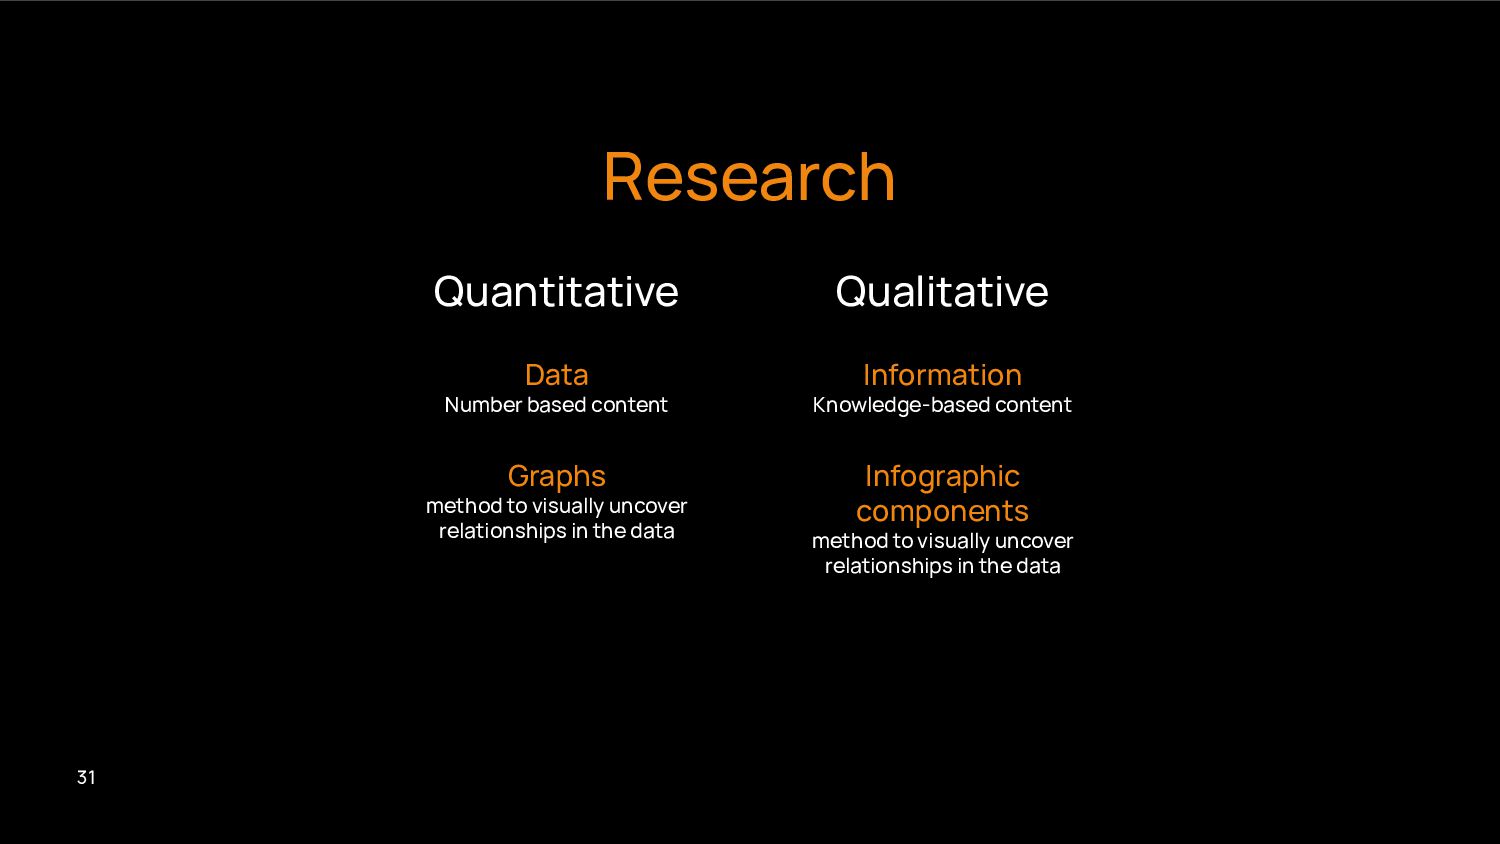
visually uncover relationships in the data Infographic components method to visually uncover relationships in the data Quantitative Qualitative Research 31
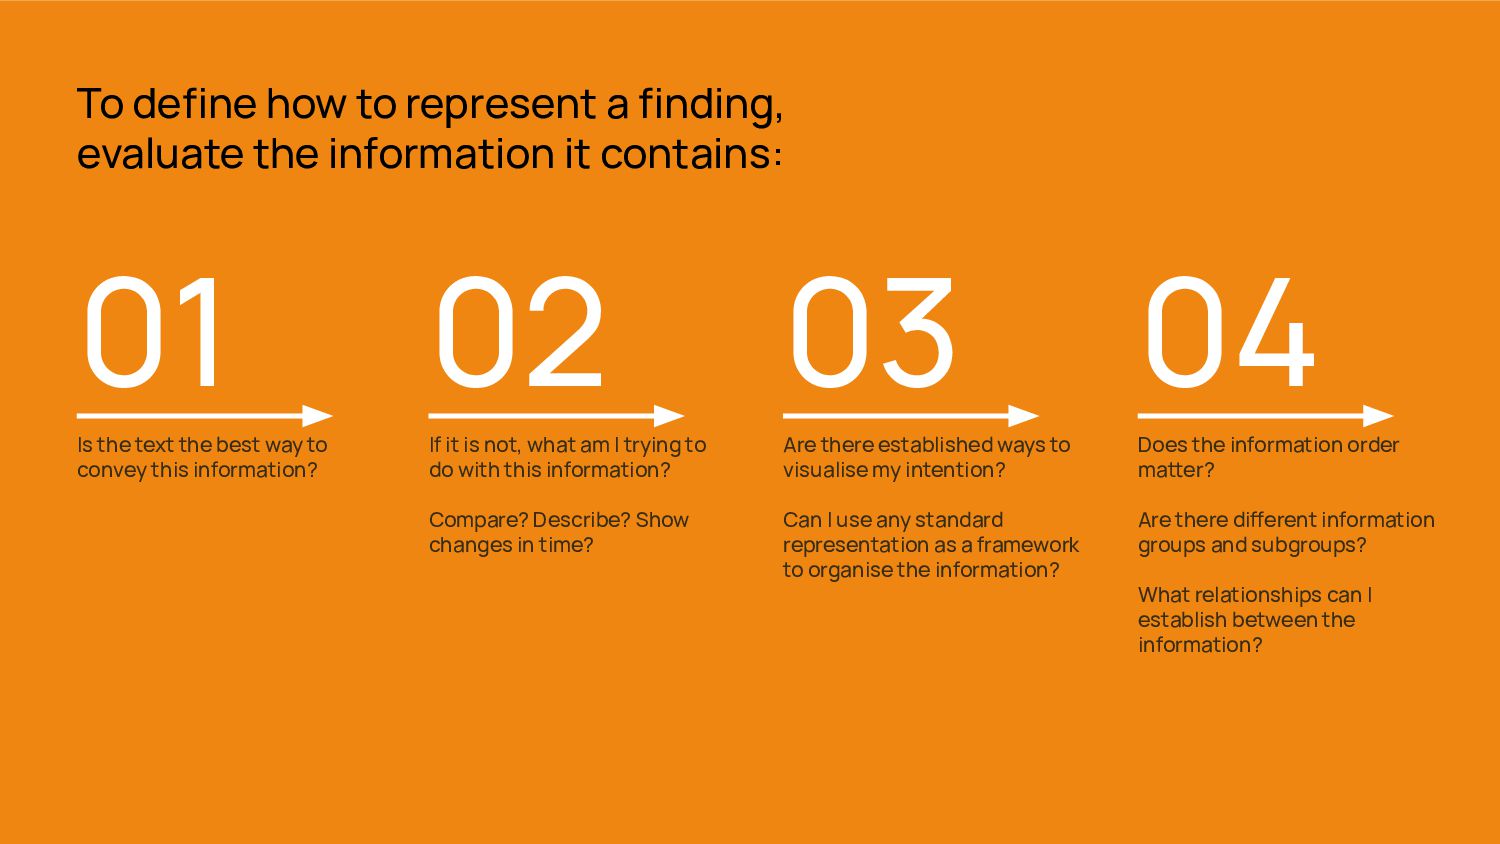
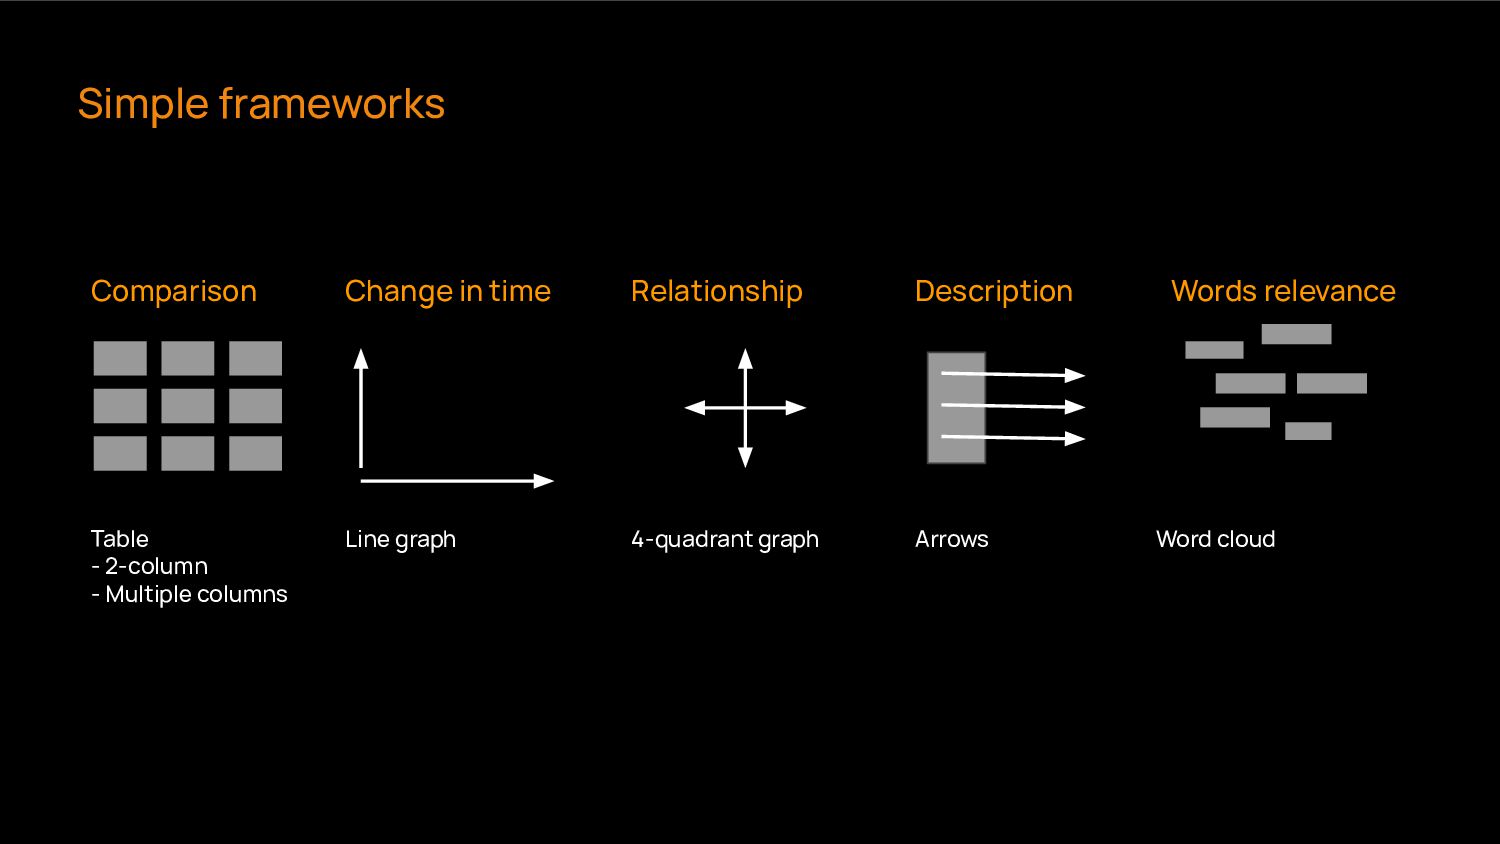
do with this information? Compare? Describe? Show changes in time? To define how to represent a finding, evaluate the information it contains: 03 Are there established ways to visualise my intention? Can I use any standard representation as a framework to organise the information? 04 Does the information order maer? Are there dierent information groups and subgroups? What relationships can I establish between the information? 01 Is the text the best way to convey this information?
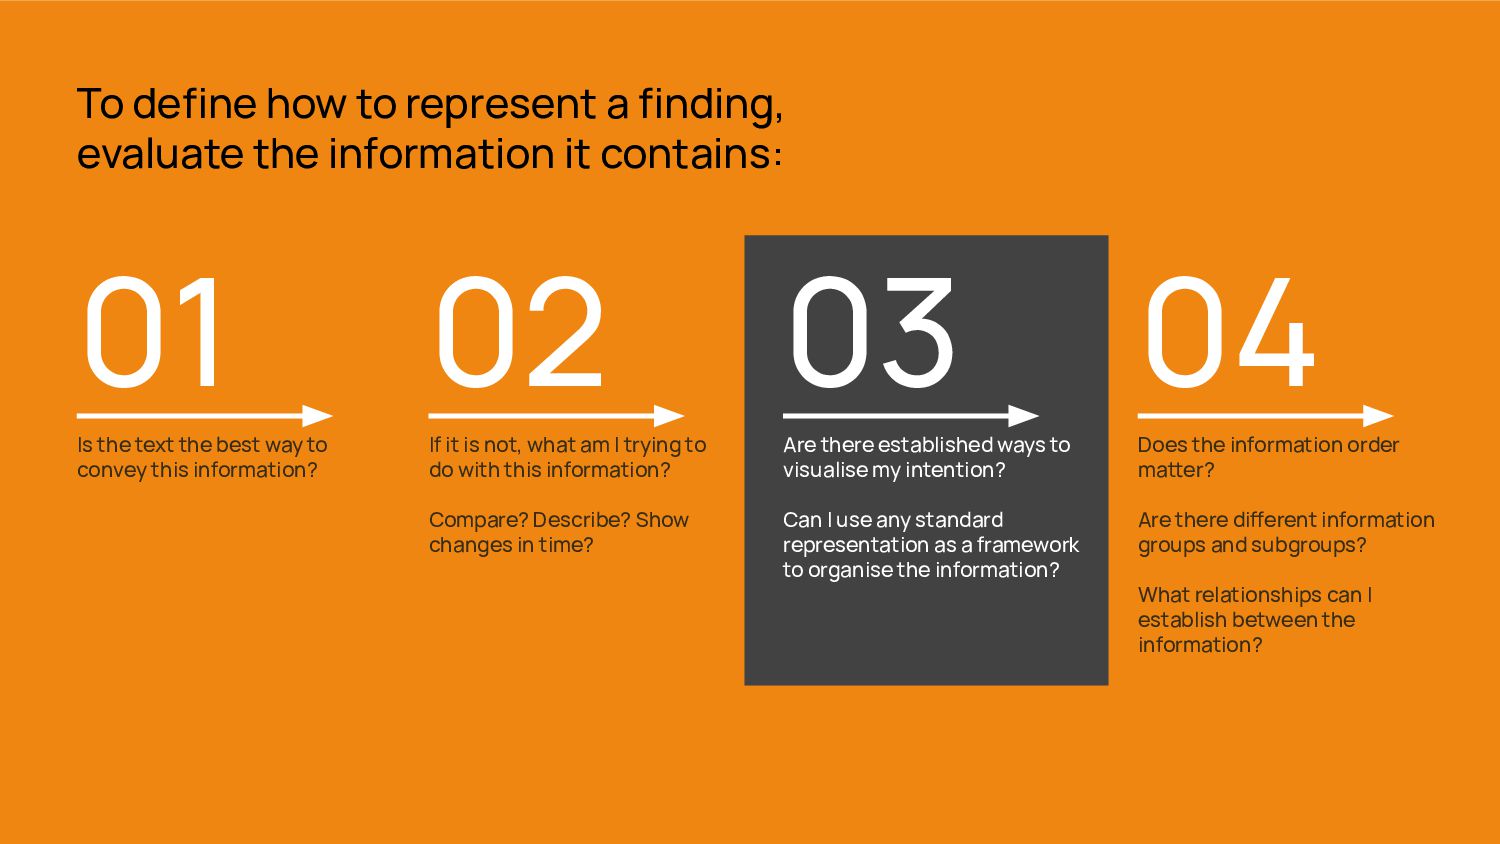
do with this information? Compare? Describe? Show changes in time? To define how to represent a finding, evaluate the information it contains: 03 Are there established ways to visualise my intention? Can I use any standard representation as a framework to organise the information? 04 Does the information order maer? Are there dierent information groups and subgroups? What relationships can I establish between the information? 01 Is the text the best way to convey this information?
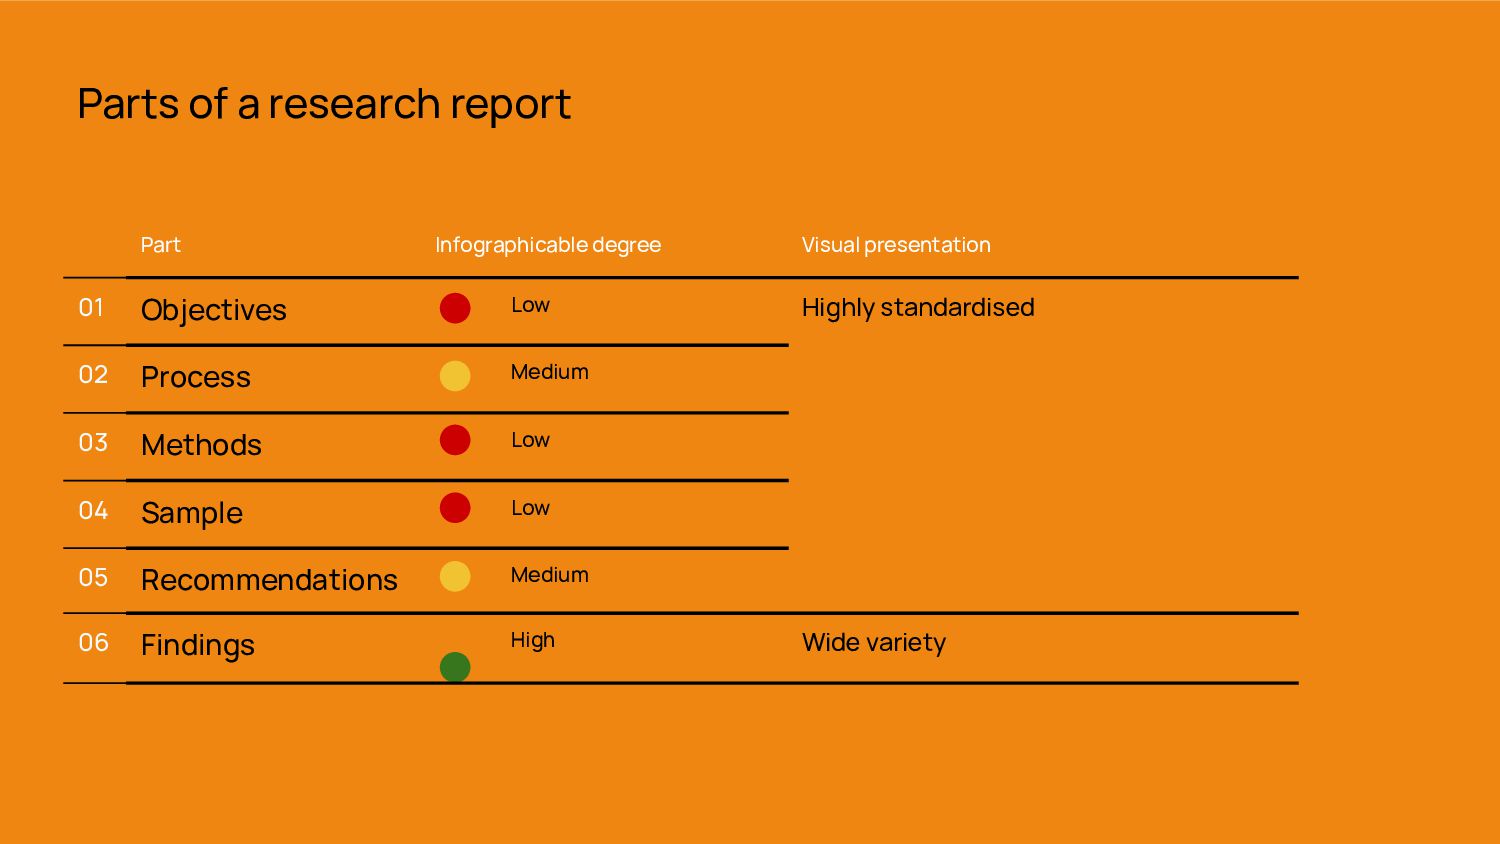
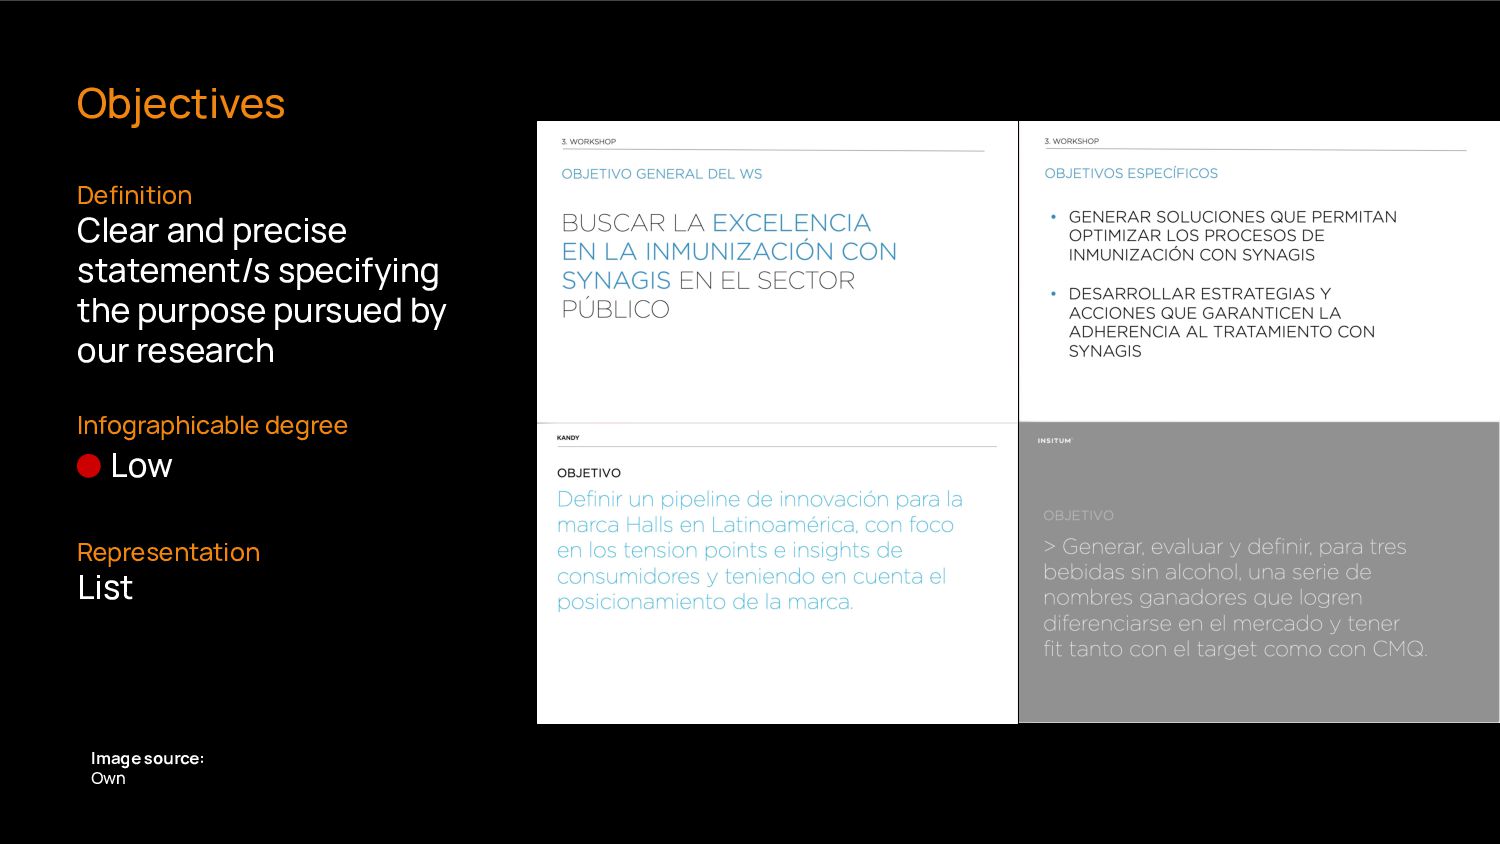
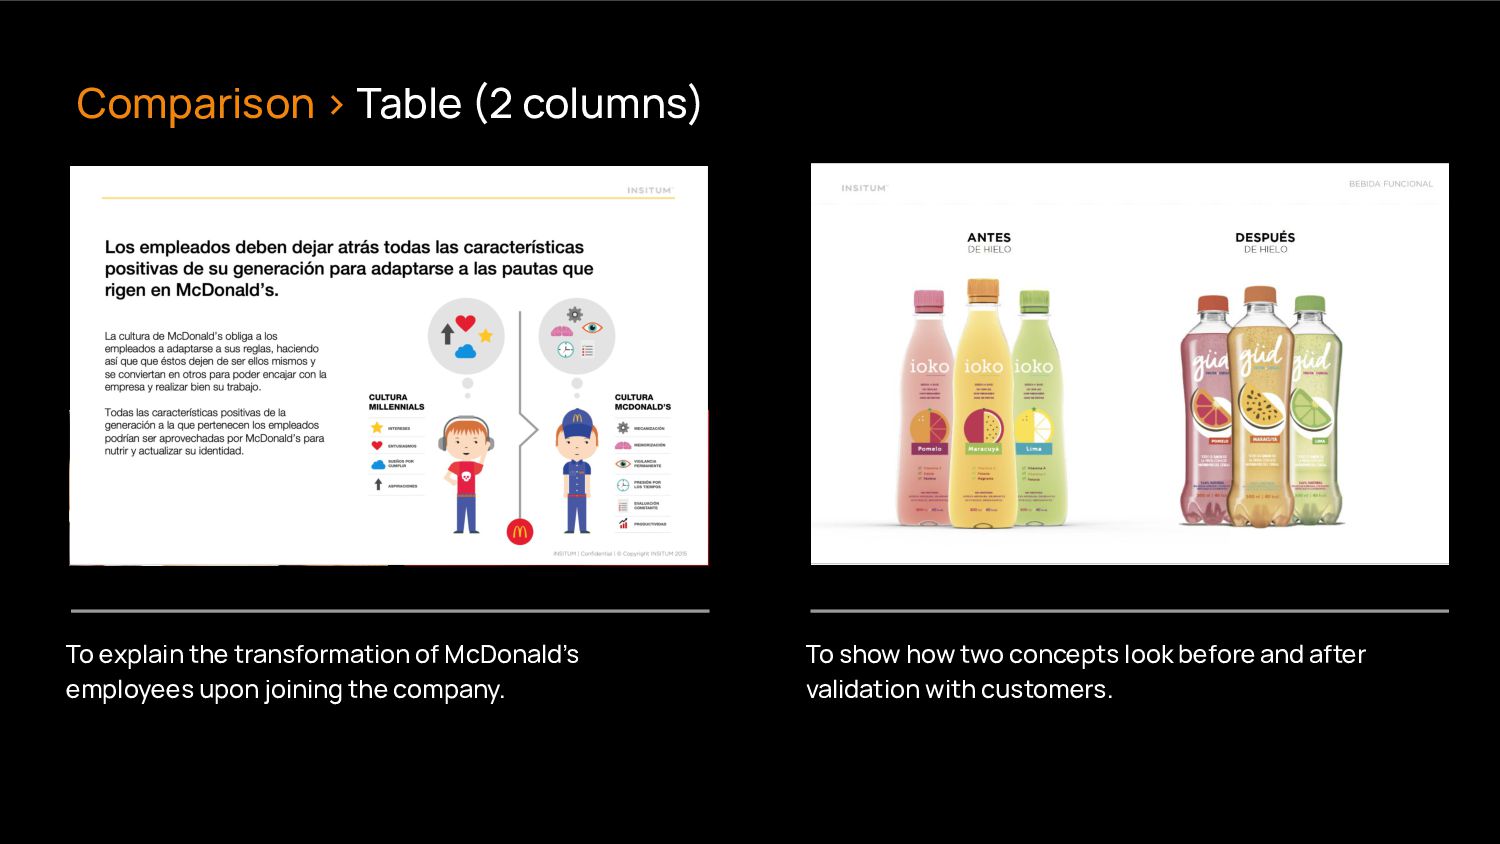
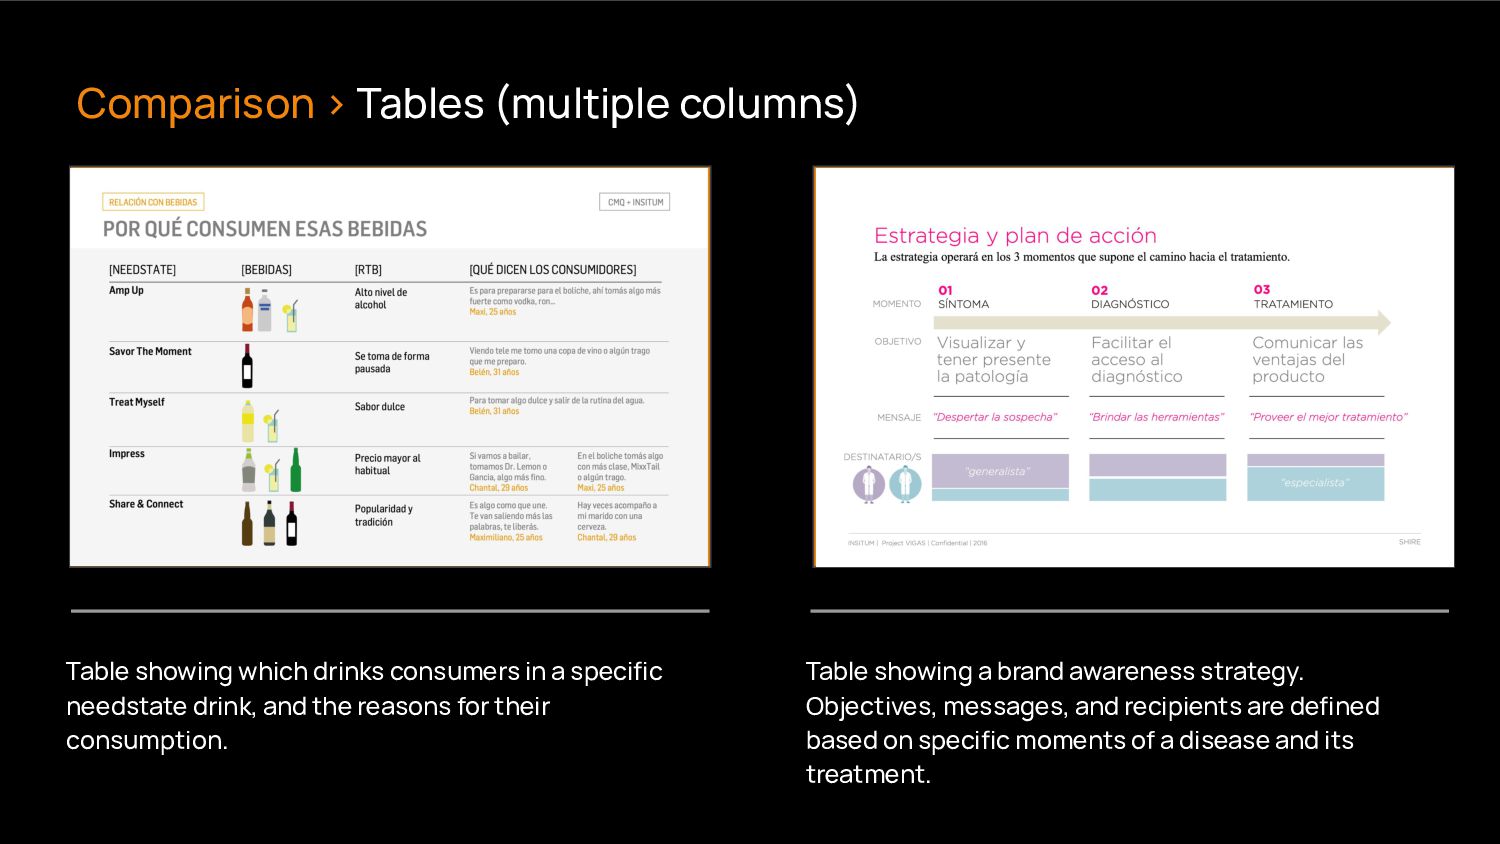
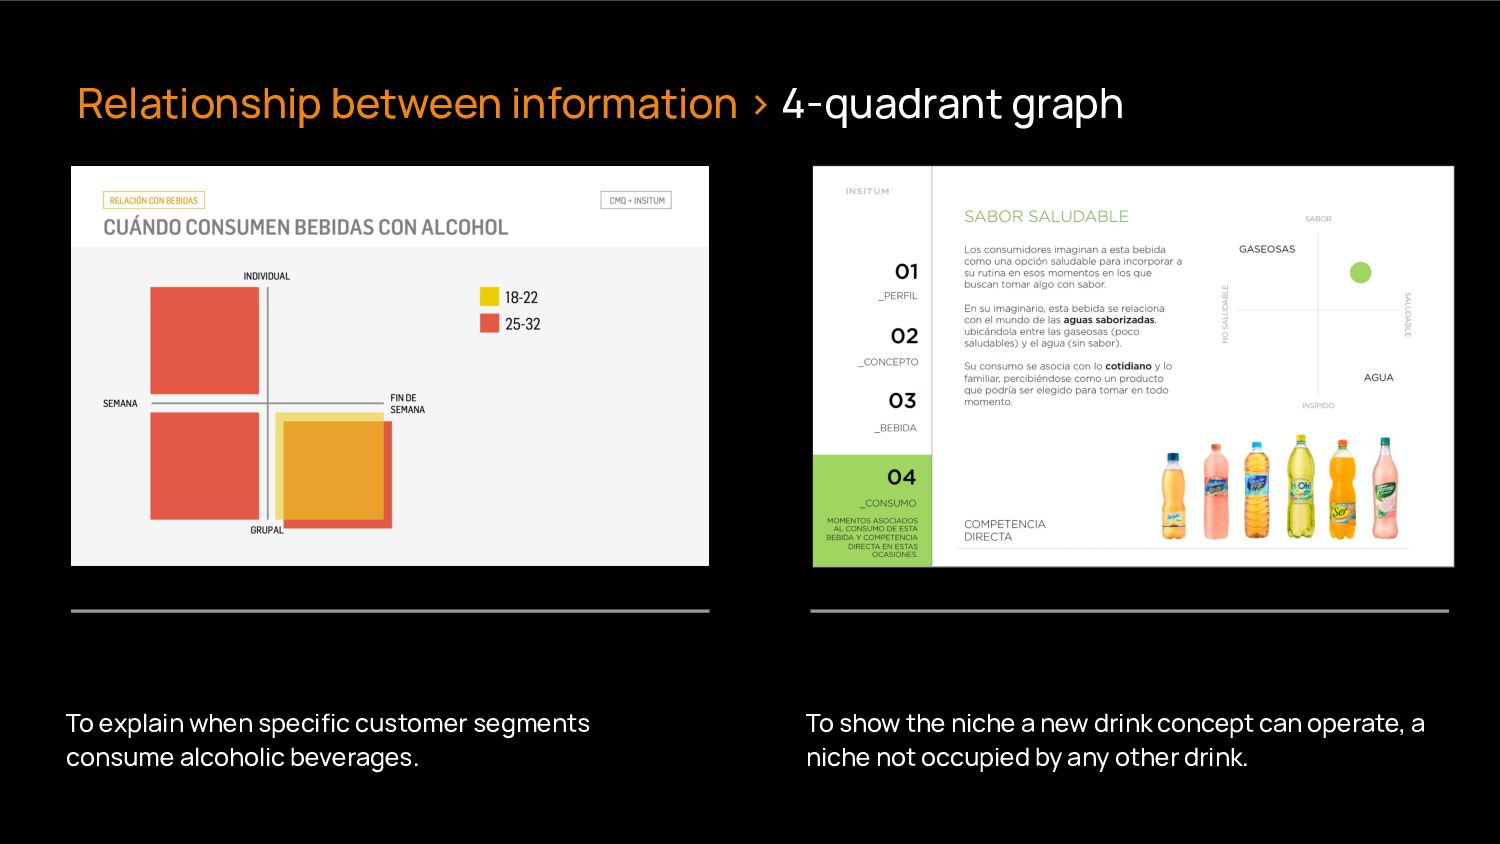
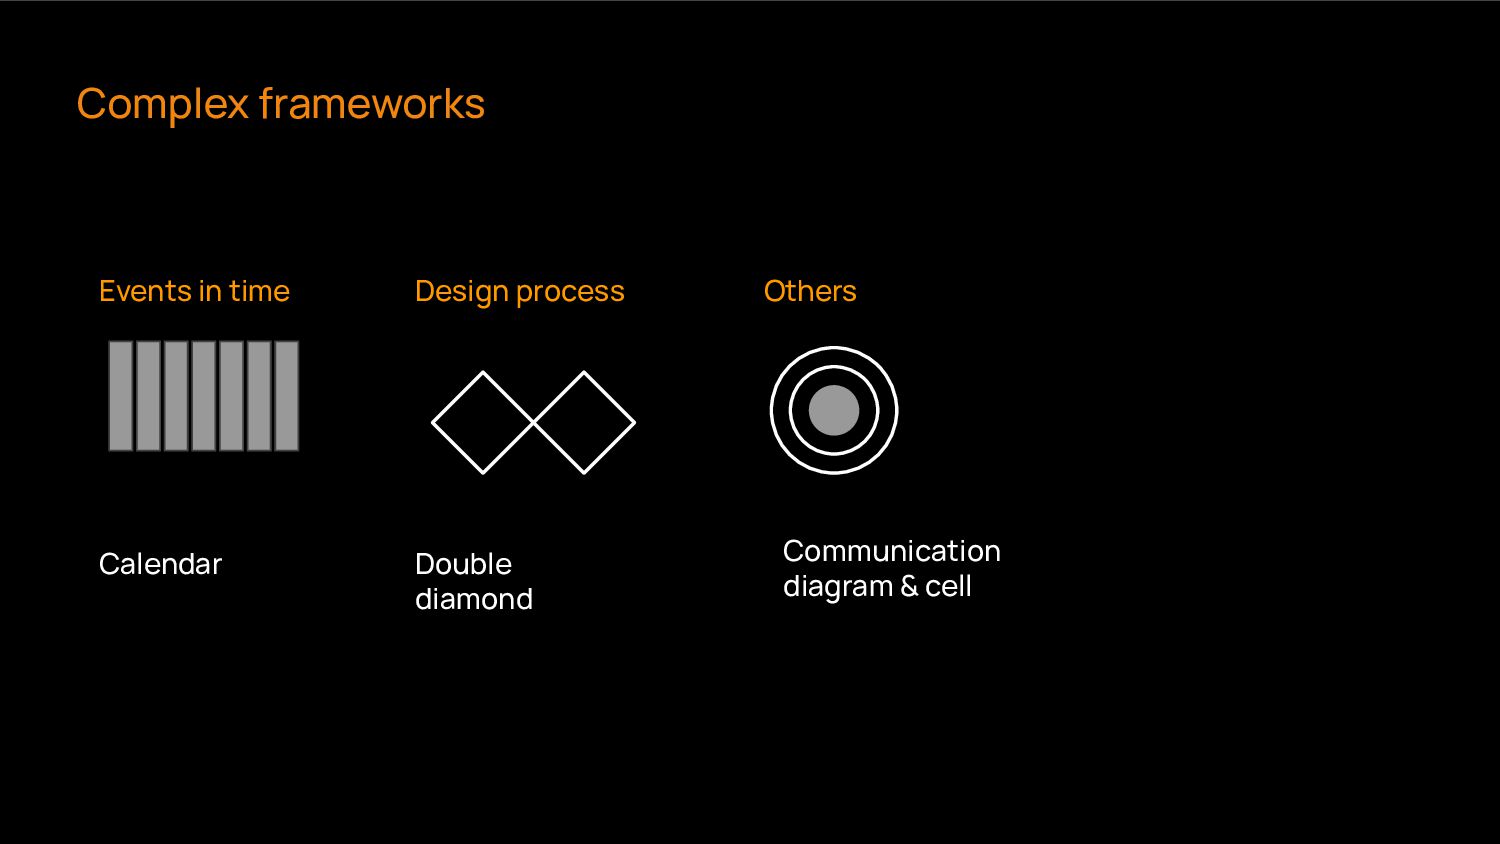
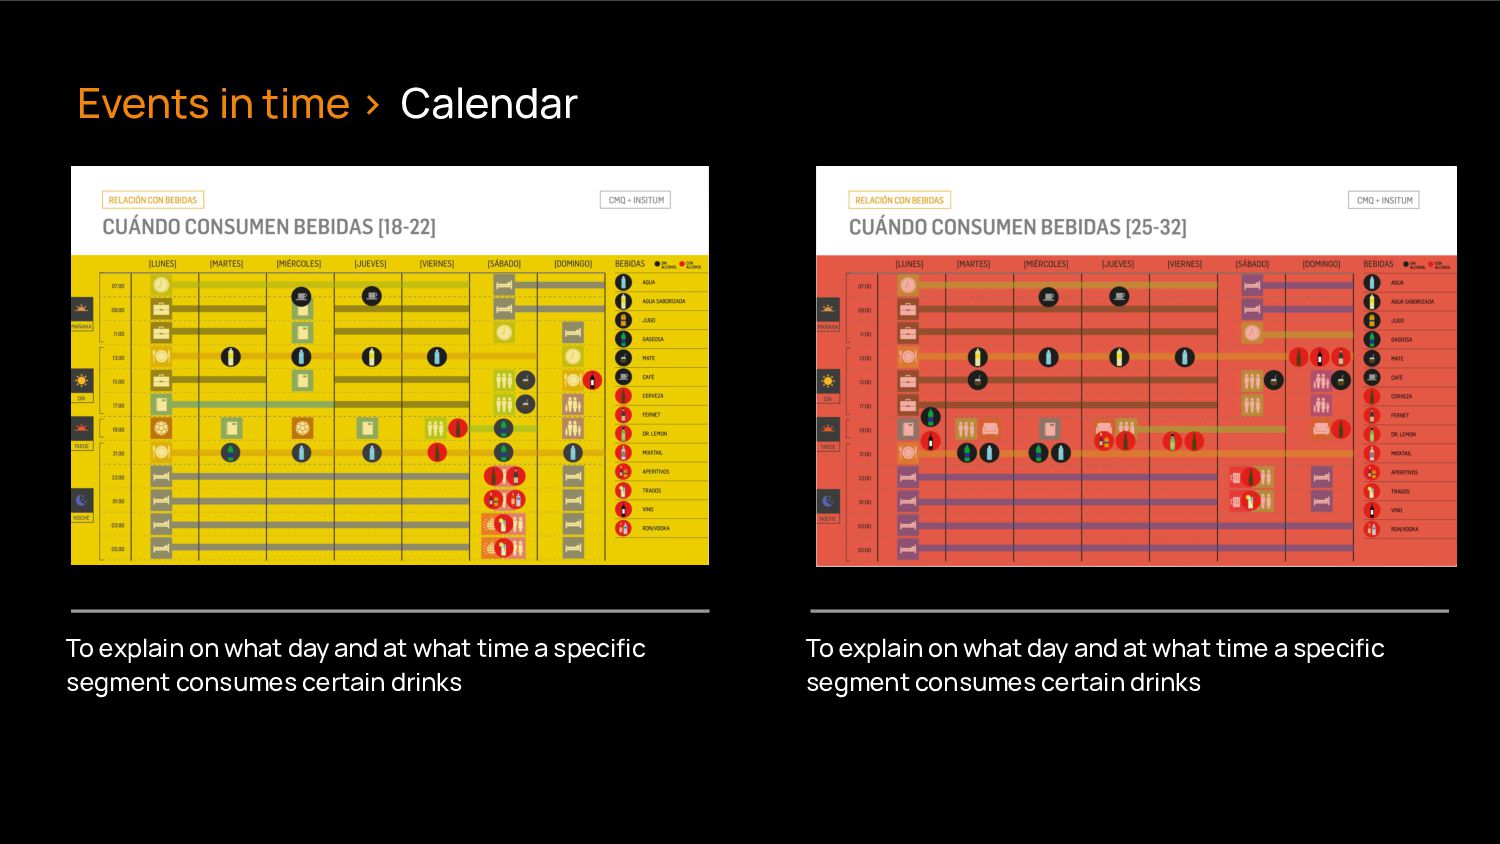
and the reasons for their consumption. Table showing a brand awareness strategy. Objectives, messages, and recipients are defined based on specific moments of a disease and its treatment. Comparison > Tables (multiple columns)
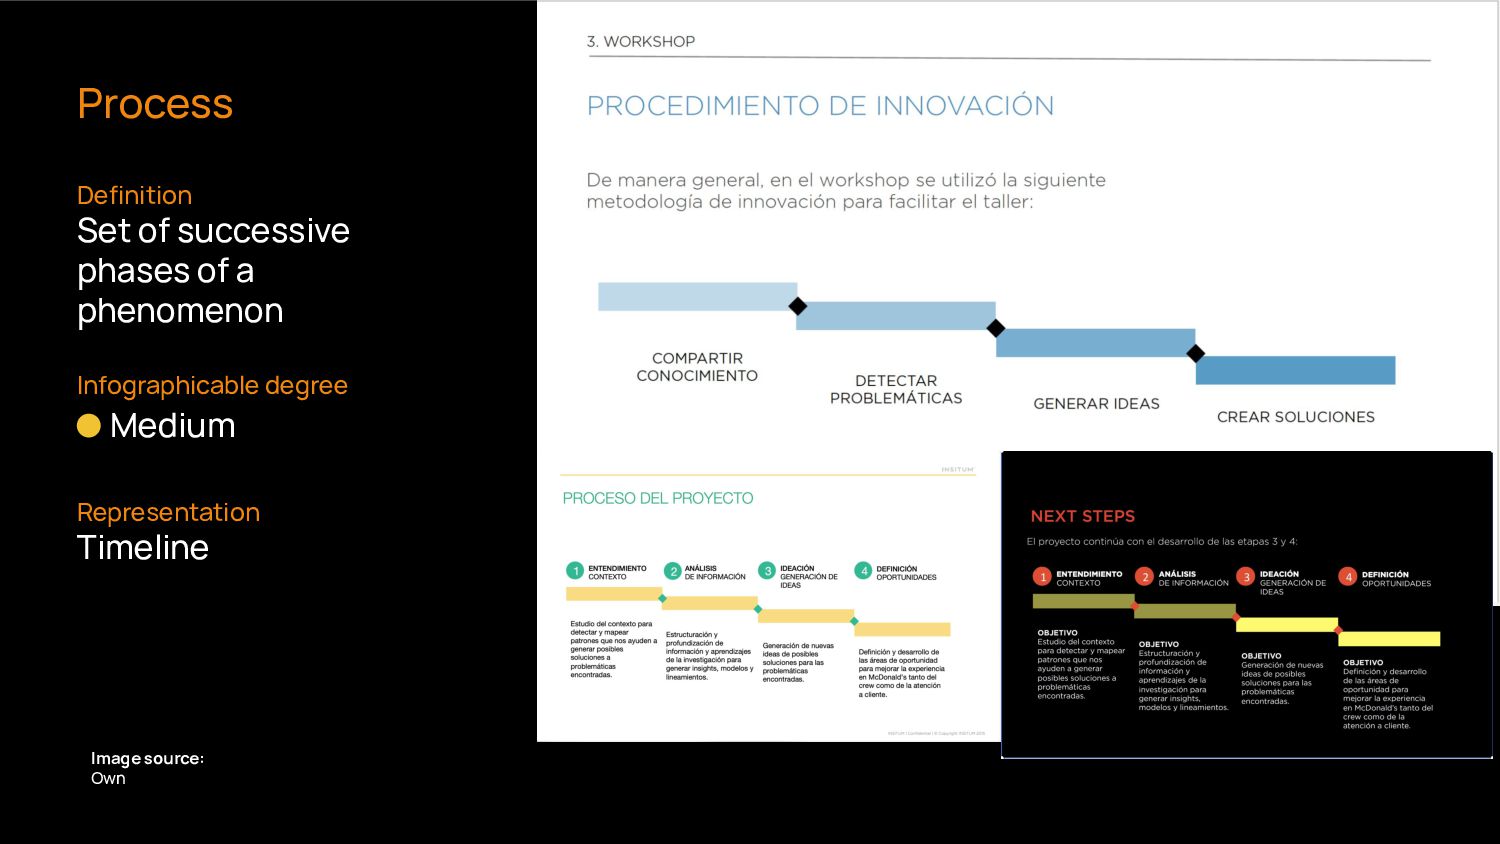
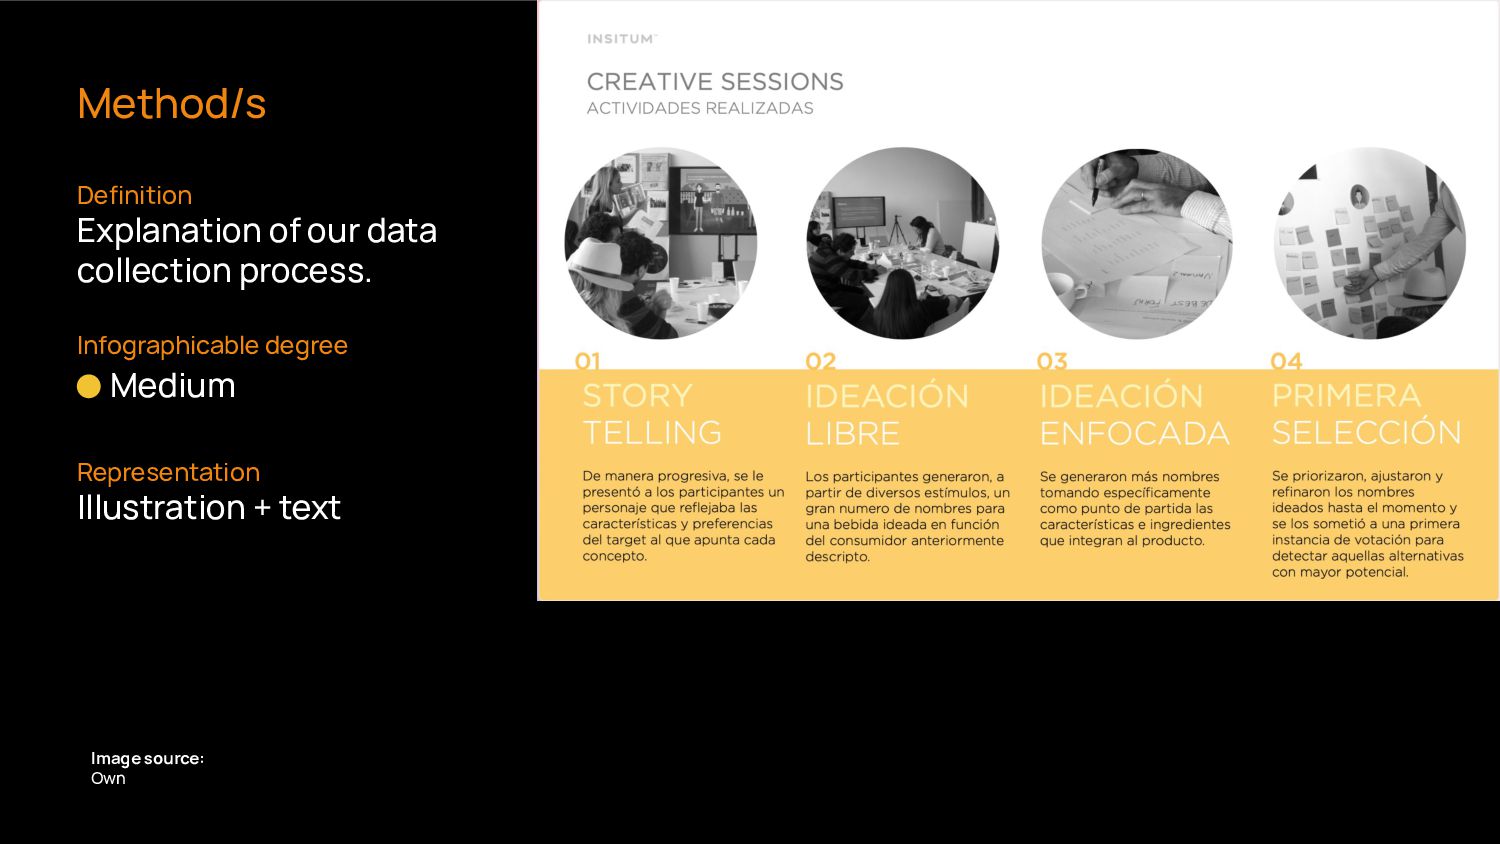
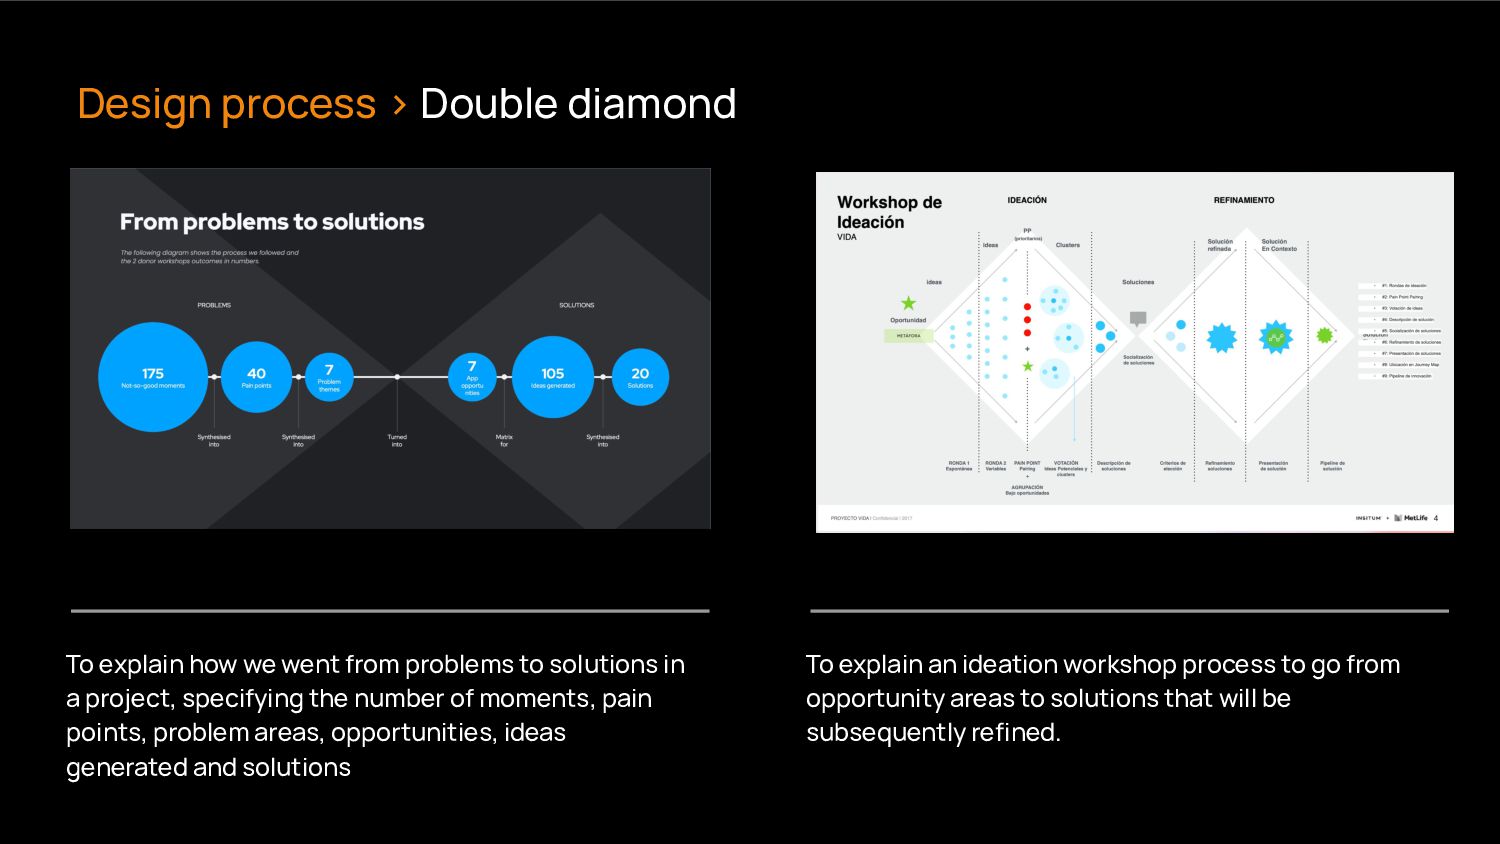
a project, specifying the number of moments, pain points, problem areas, opportunities, ideas generated and solutions To explain an ideation workshop process to go from opportunity areas to solutions that will be subsequently refined. Design process > Double diamond
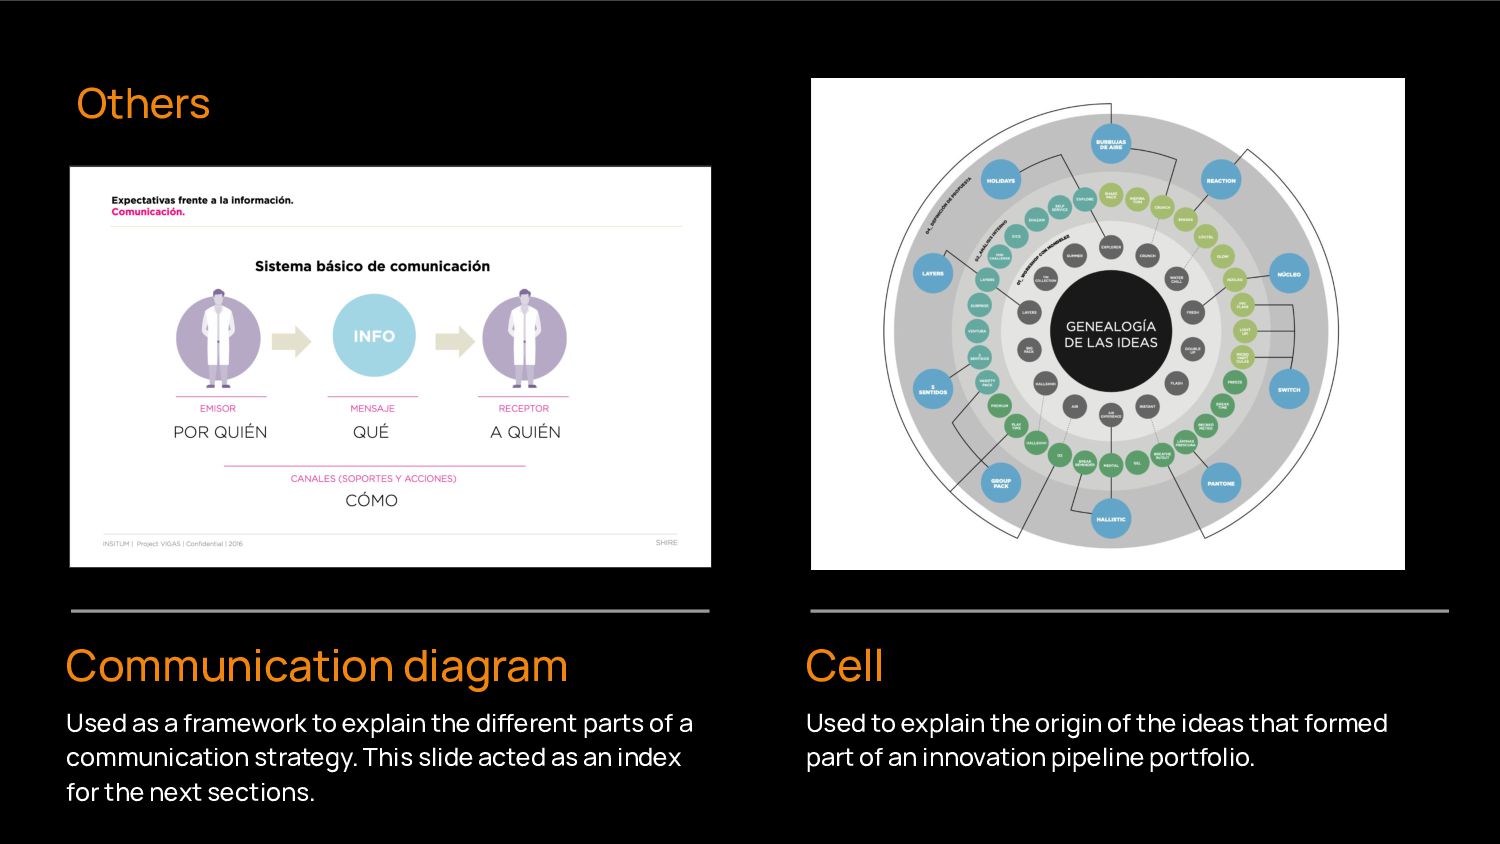
dierent parts of a communication strategy. This slide acted as an index for the next sections. Used to explain the origin of the ideas that formed part of an innovation pipeline portfolio. Others
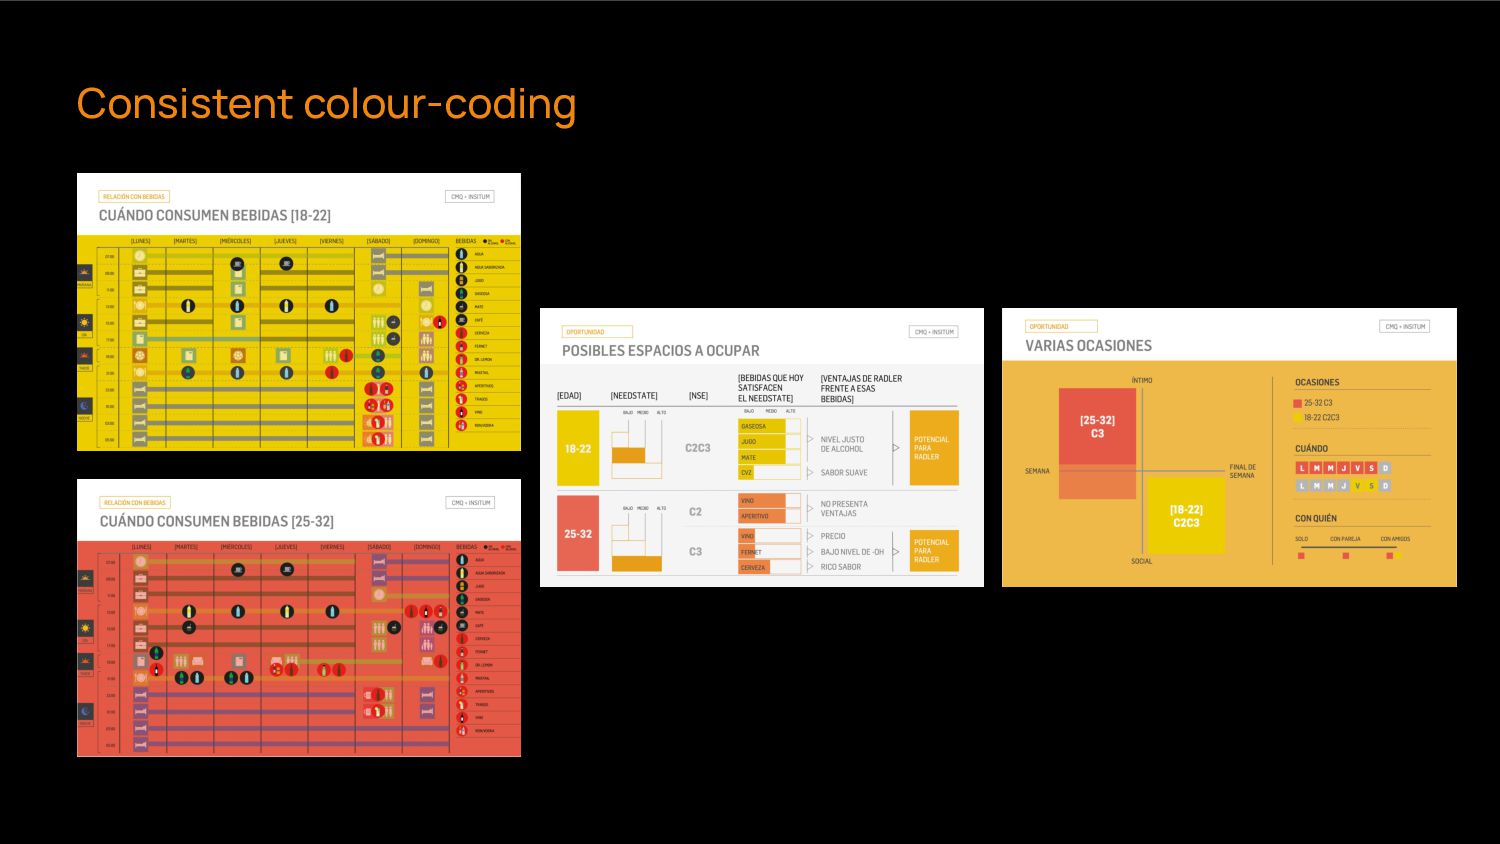
mindful of established colour associations. ➔ Assign a specific colour to each section in a presentation. ➔ Define what’s important to show through colour (too much colour can be confusing)
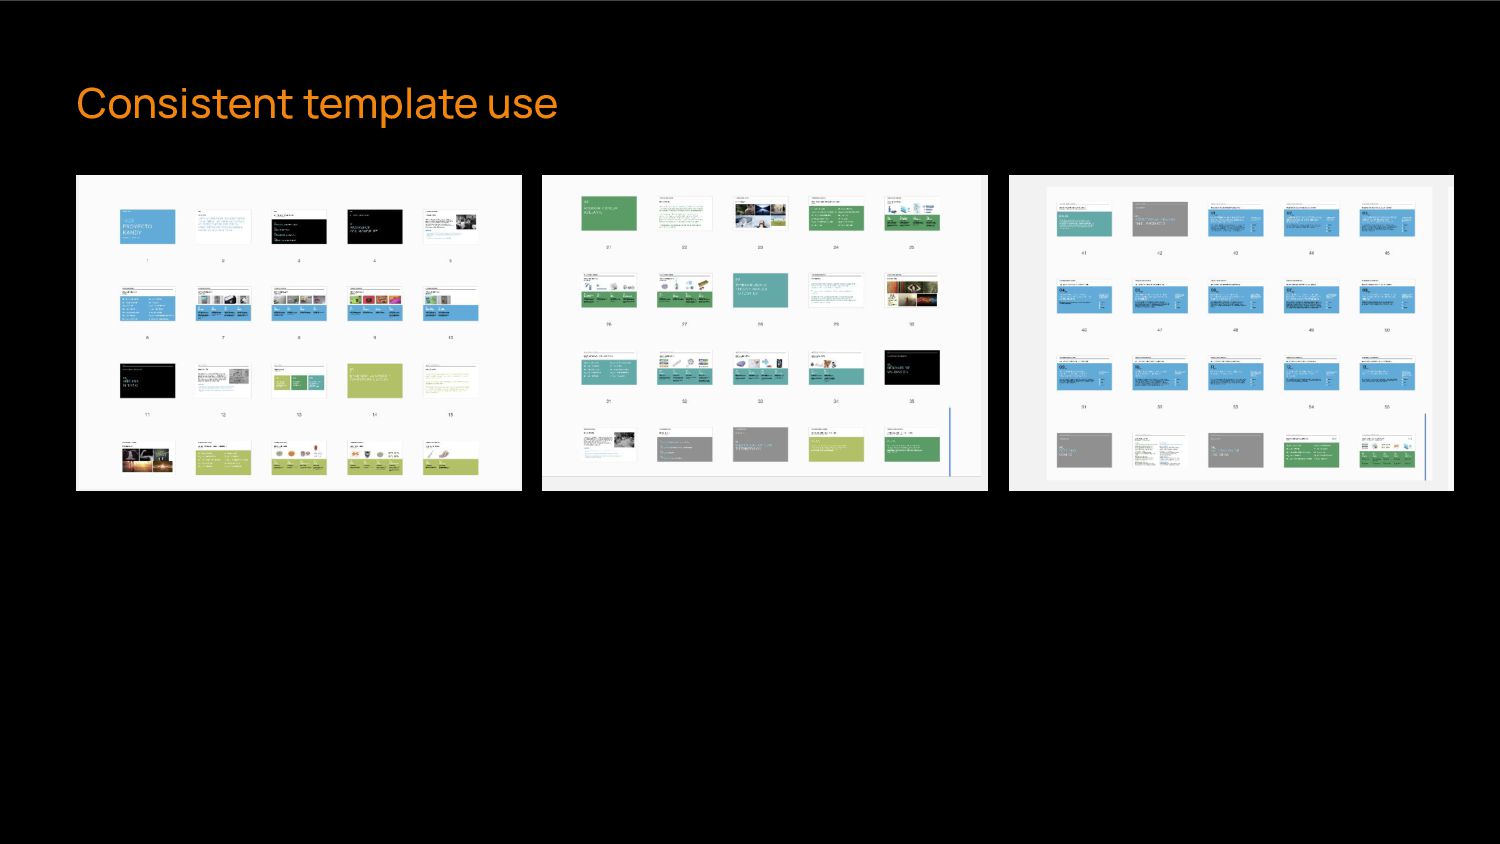
indexes for sections and subsections. ➔ Let readers know where they are standing by using numbers. ➔ Assign dierent colours to dierent sections. A clear structure will help the readers orientate themselves in the entire presentation.
can be more understandable by linking the elements on dierent slides. ➔ Assign the same template to slides with a similar role in the structure ➔ Maintain the colour coding consistent throughout the presentation.
create infographic presentations, but semiotic knowledge to identify when an element supports the message you are trying to convey and when it doesn’t.
![[email protected] Thank you! 01 Story-showing](https://files.speakerdeck.com/presentations/cf497631518f410781eb12f5b57e4993/slide_66.jpg)