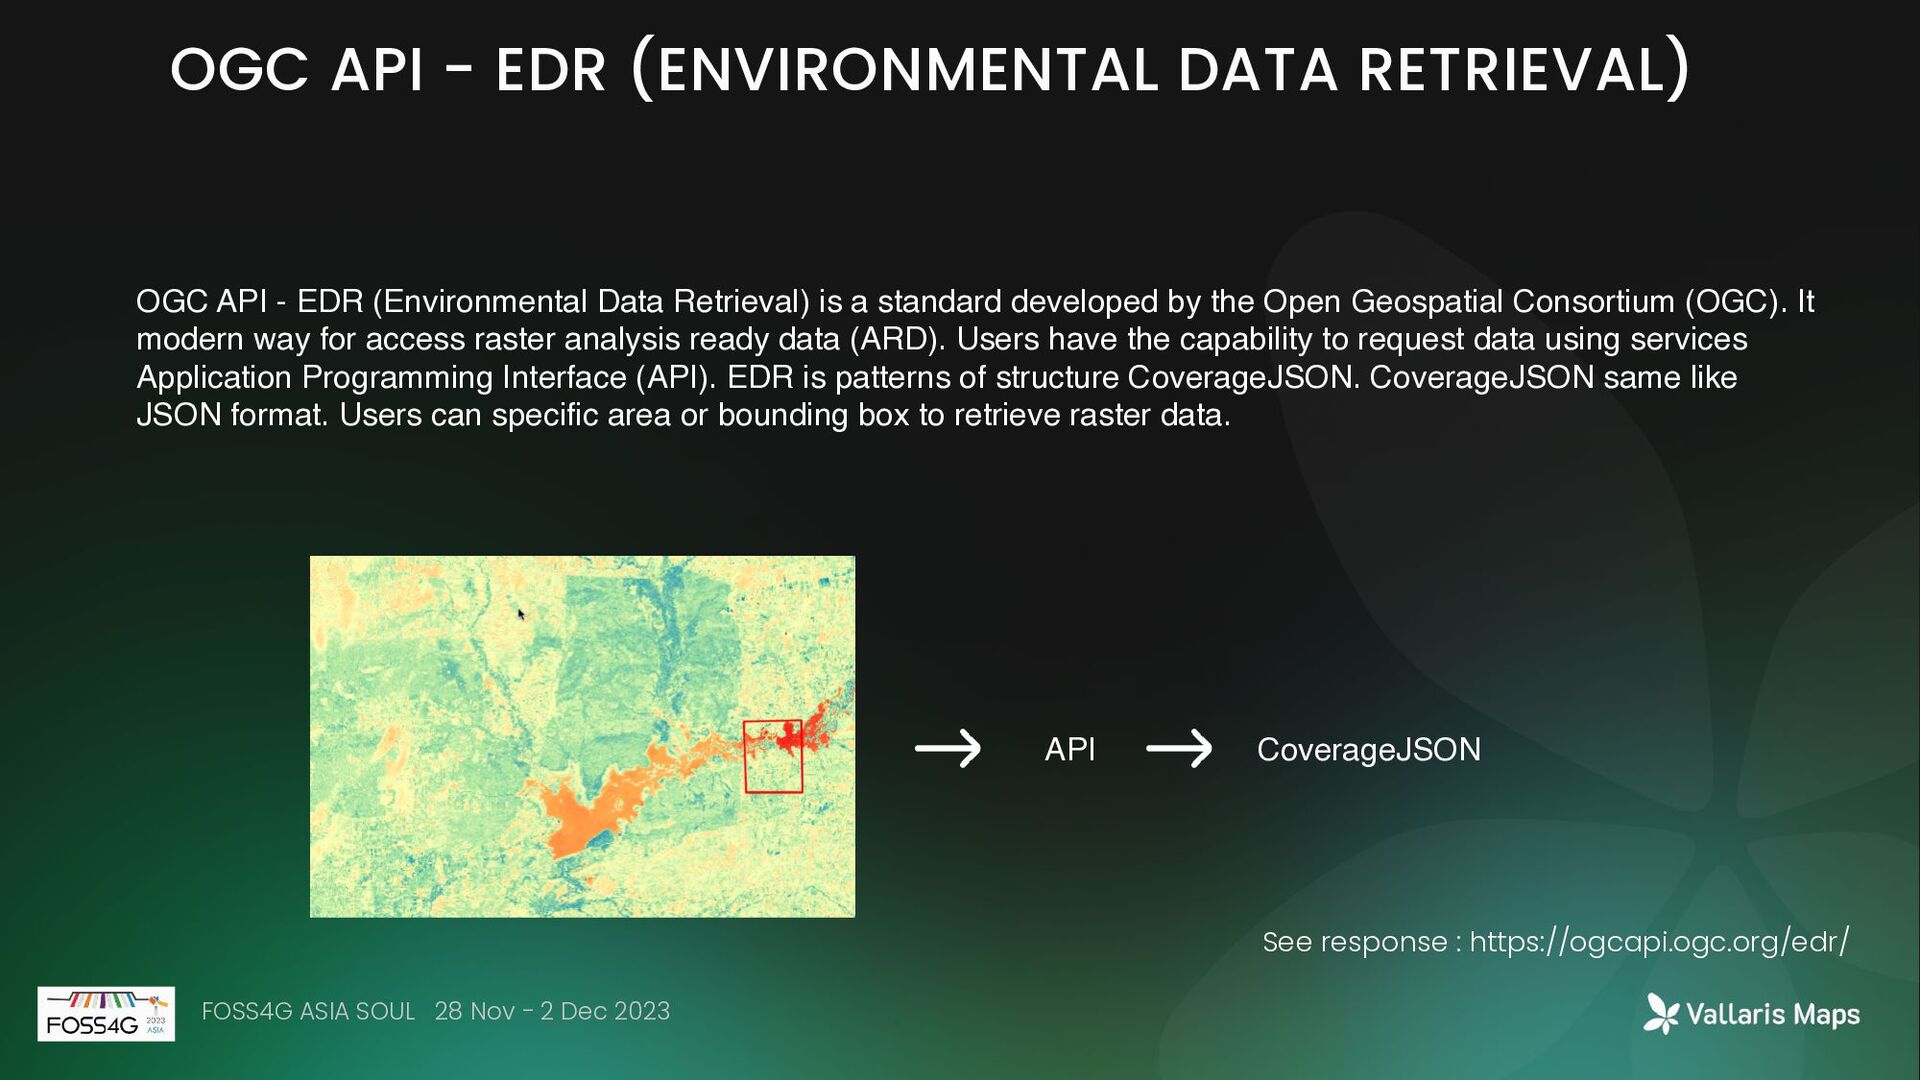
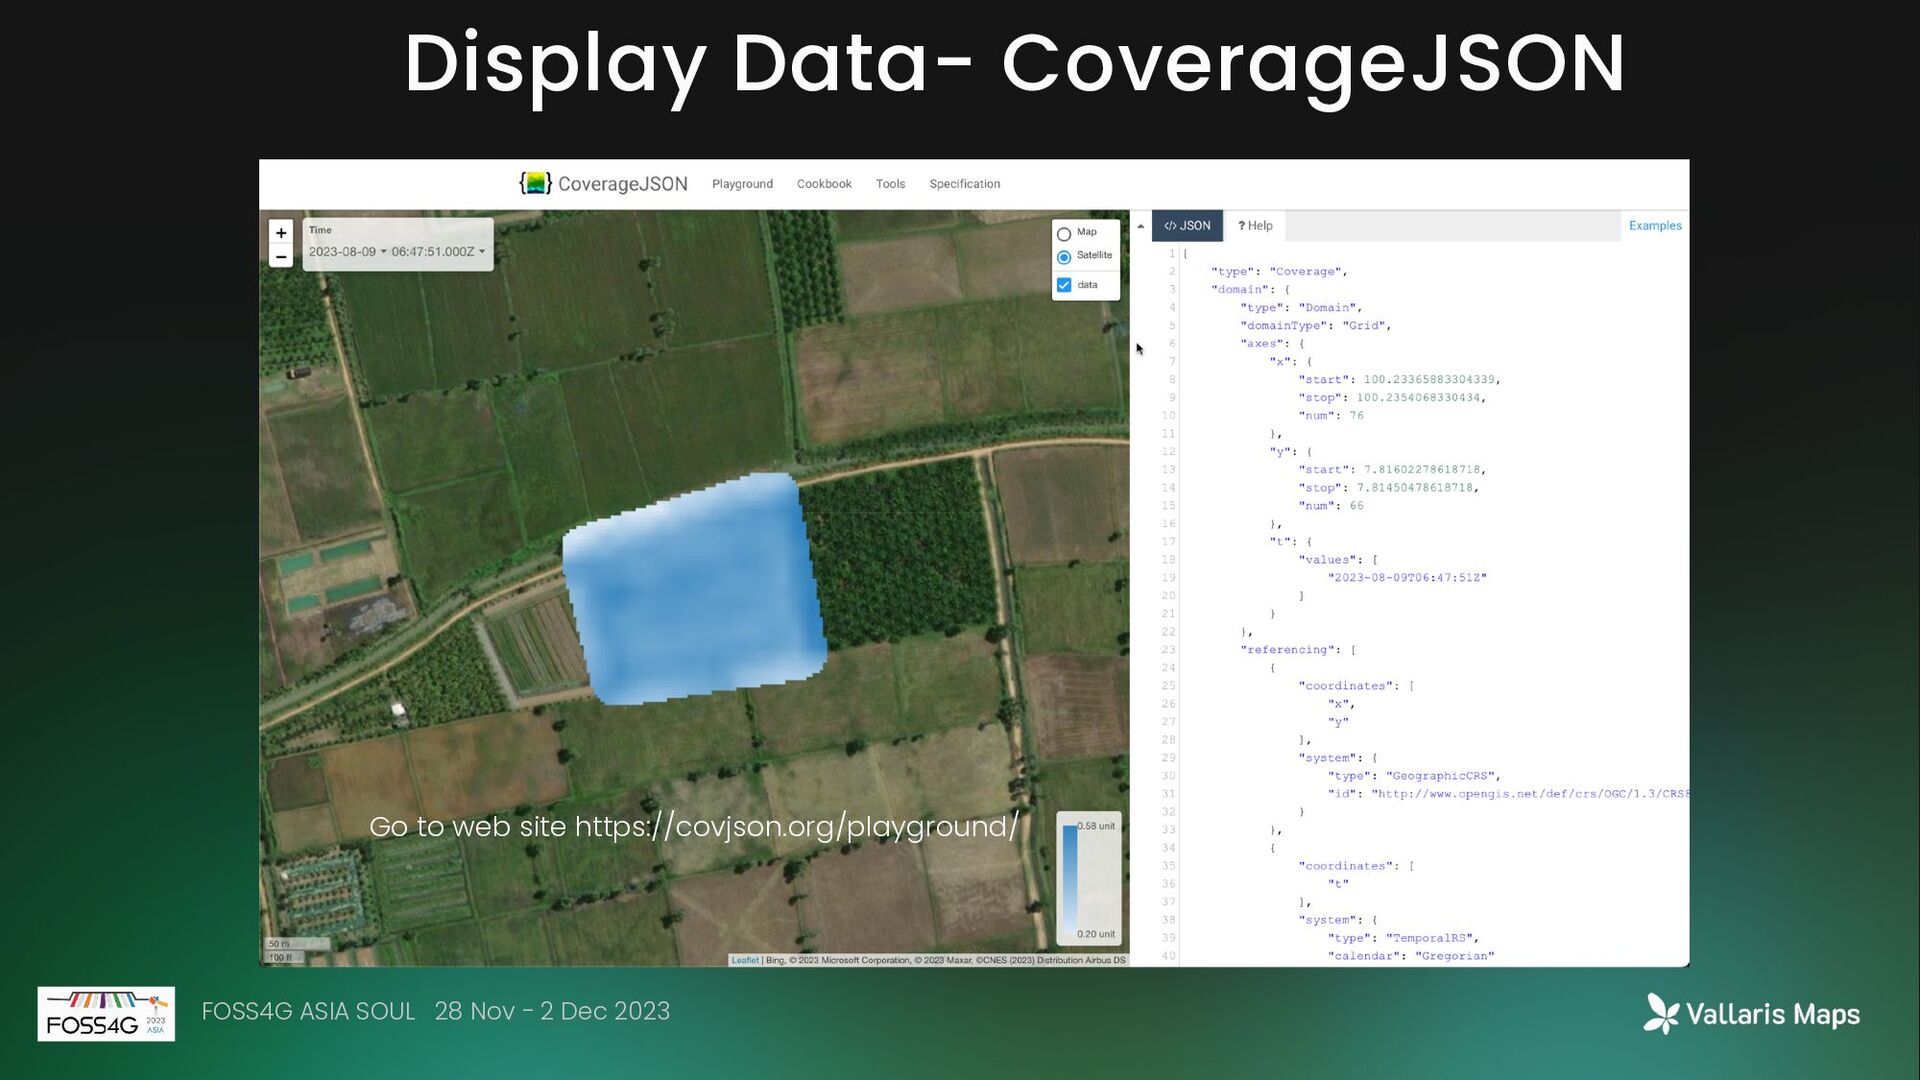
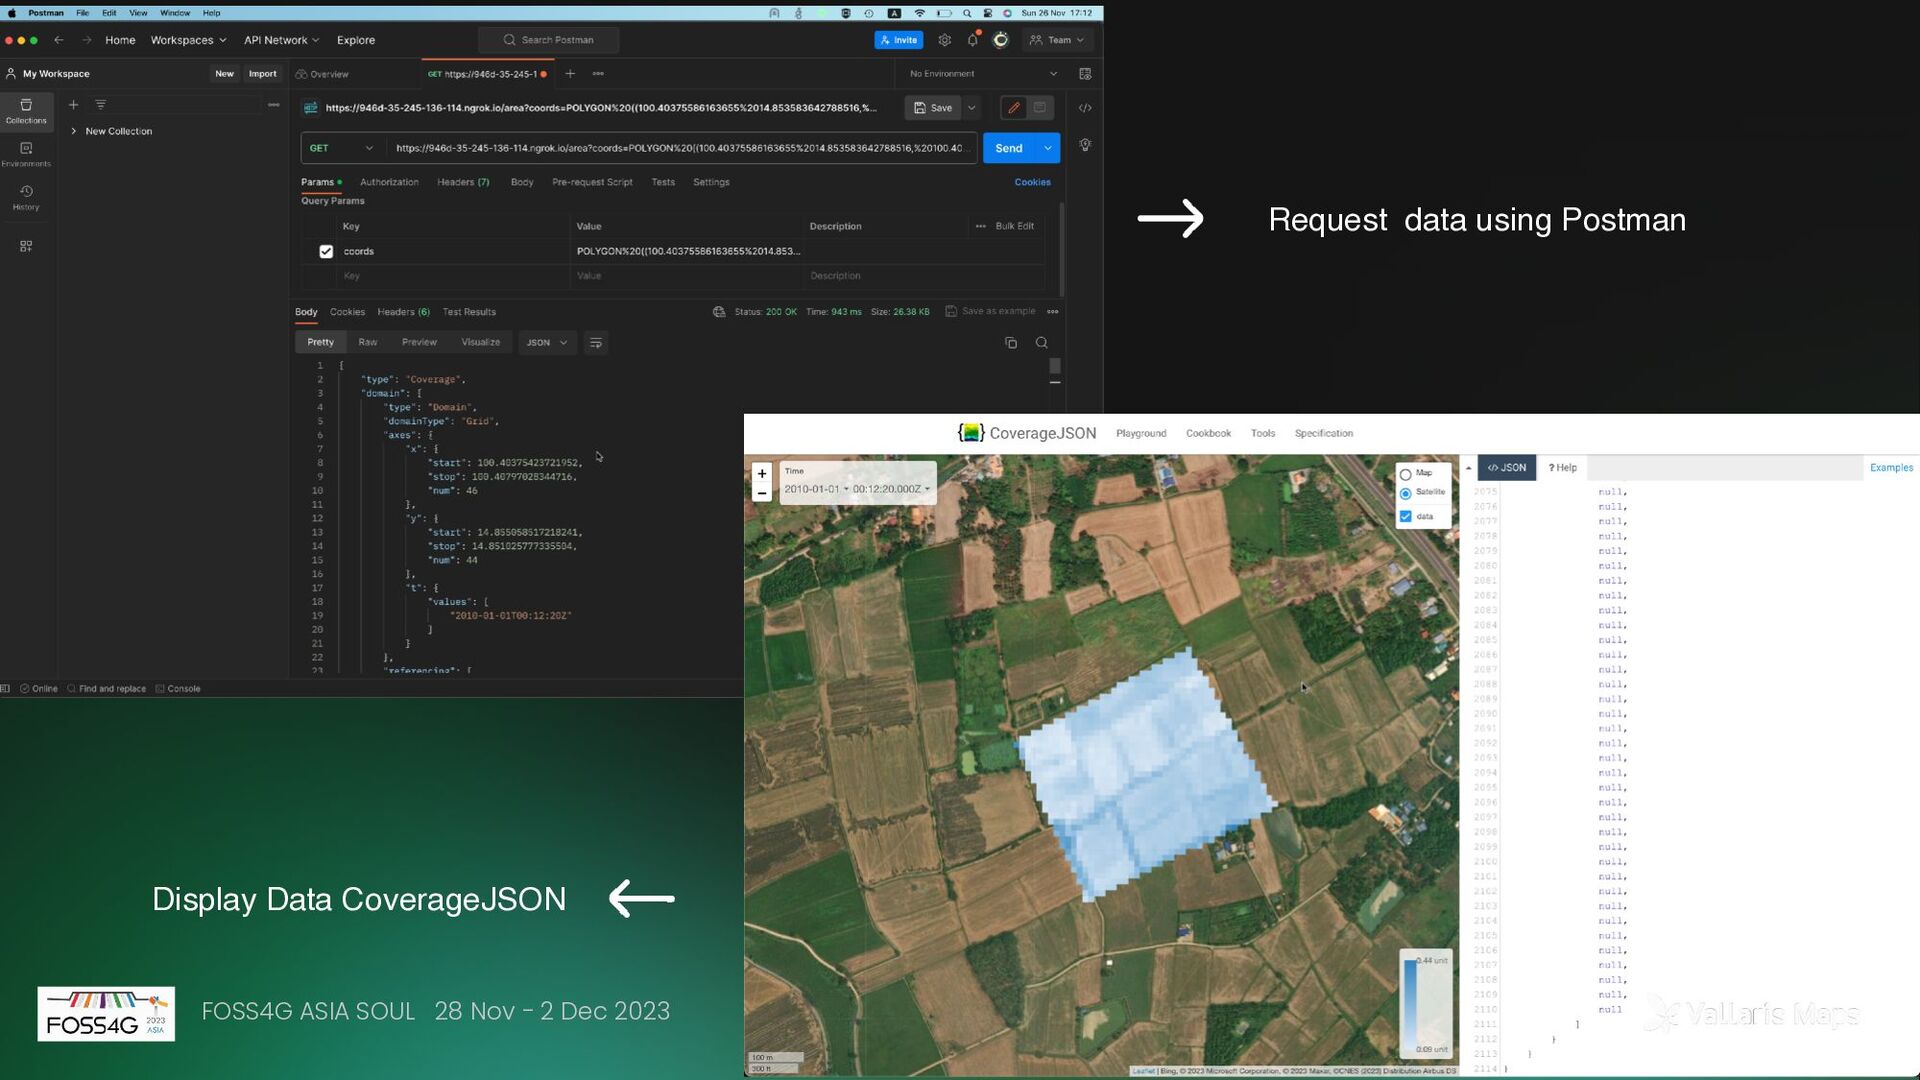
EDR (Environmental Data Retrieval) is a standard developed by the Open Geospatial Consortium (OGC). It modern way for access raster analysis ready data (ARD). Users have the capability to request data using services Application Programming Interface (API). EDR is patterns of structure CoverageJSON. CoverageJSON same like JSON format. Users can specific area or bounding box to retrieve raster data. See response : https://ogcapi.ogc.org/edr/ API CoverageJSON FOSS4G ASIA SOUL 28 Nov - 2 Dec 2023
a flexible mechanism for accessing analysis ready data (ARD) that has been transformed into CoverageJSON using HTTP requests. accessible via the endpoints API. FOSS4G ASIA SOUL 28 Nov - 2 Dec 2023
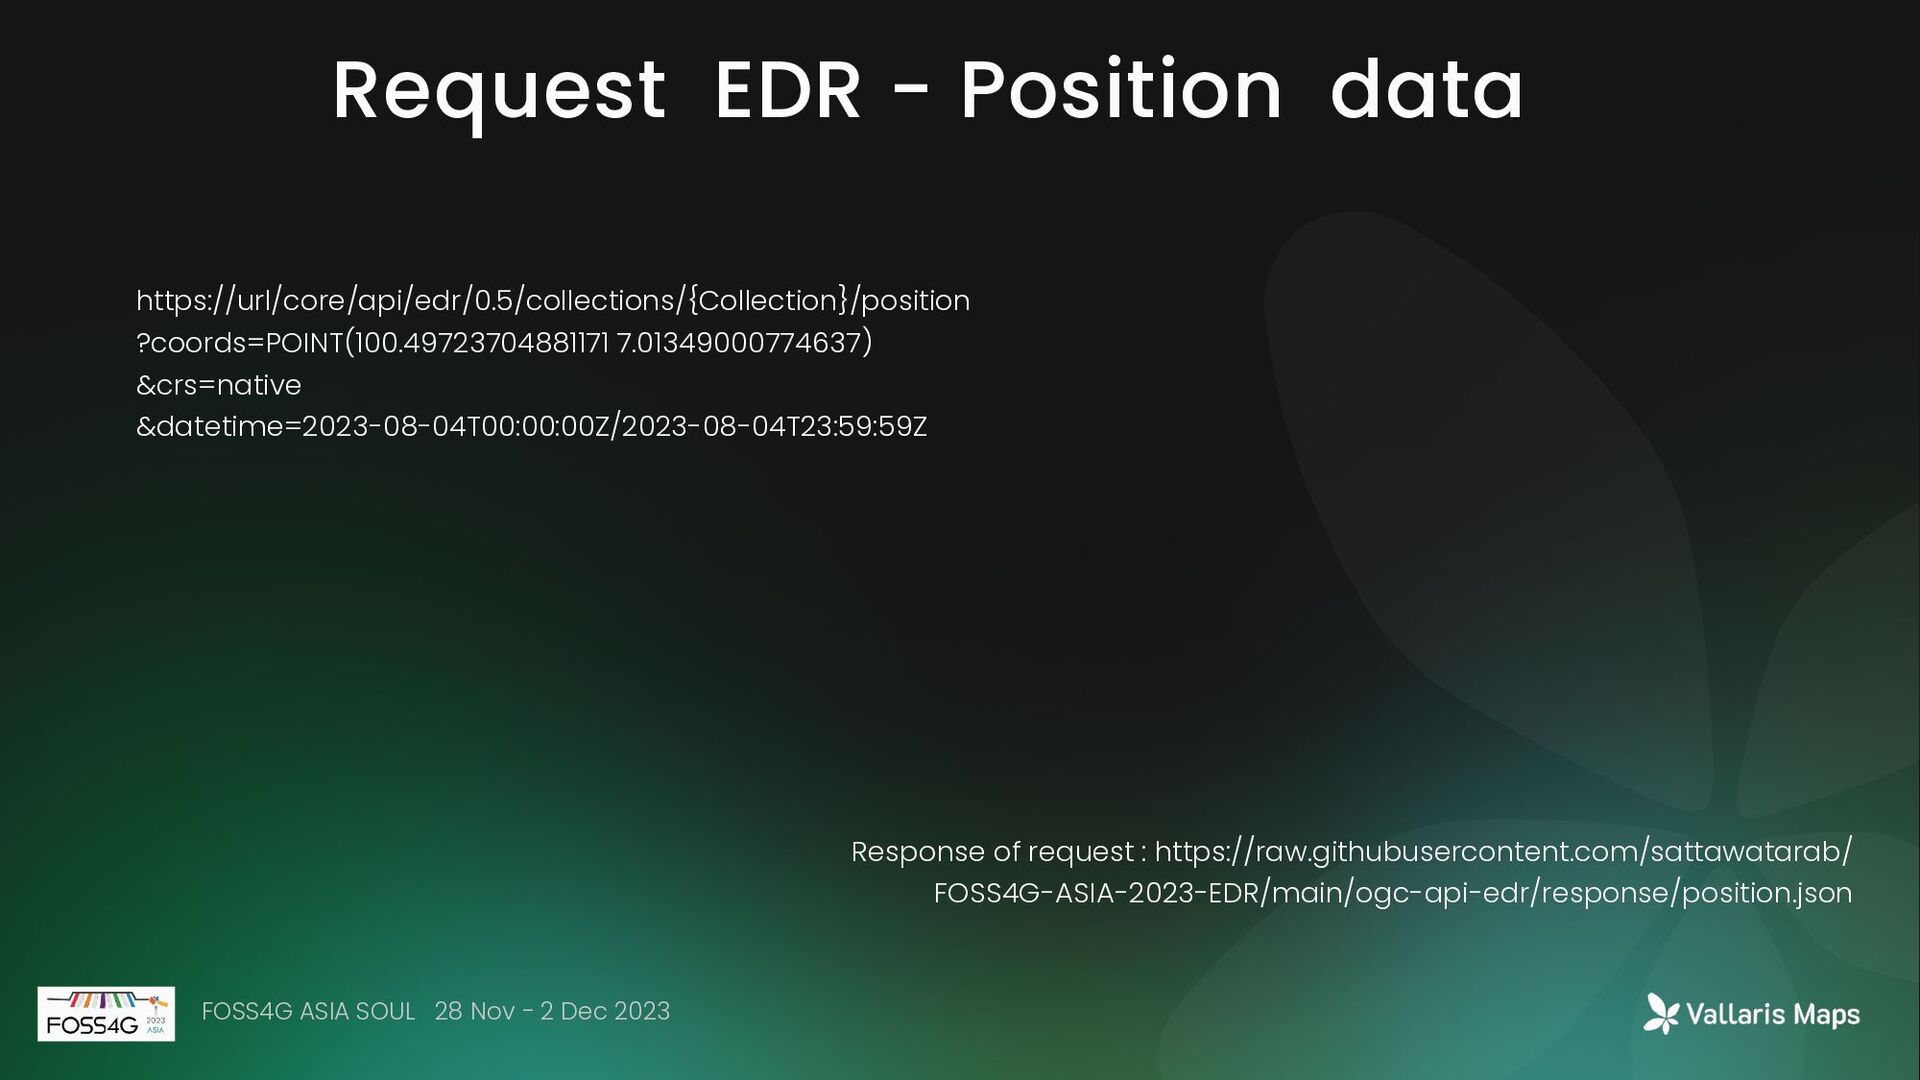
FOSS4G ASIA SOUL 28 Nov - 2 Dec 2023 Response of request : https://raw.githubusercontent.com/sattawatarab/ FOSS4G-ASIA-2023-EDR/main/ogc-api-edr/response/position.json
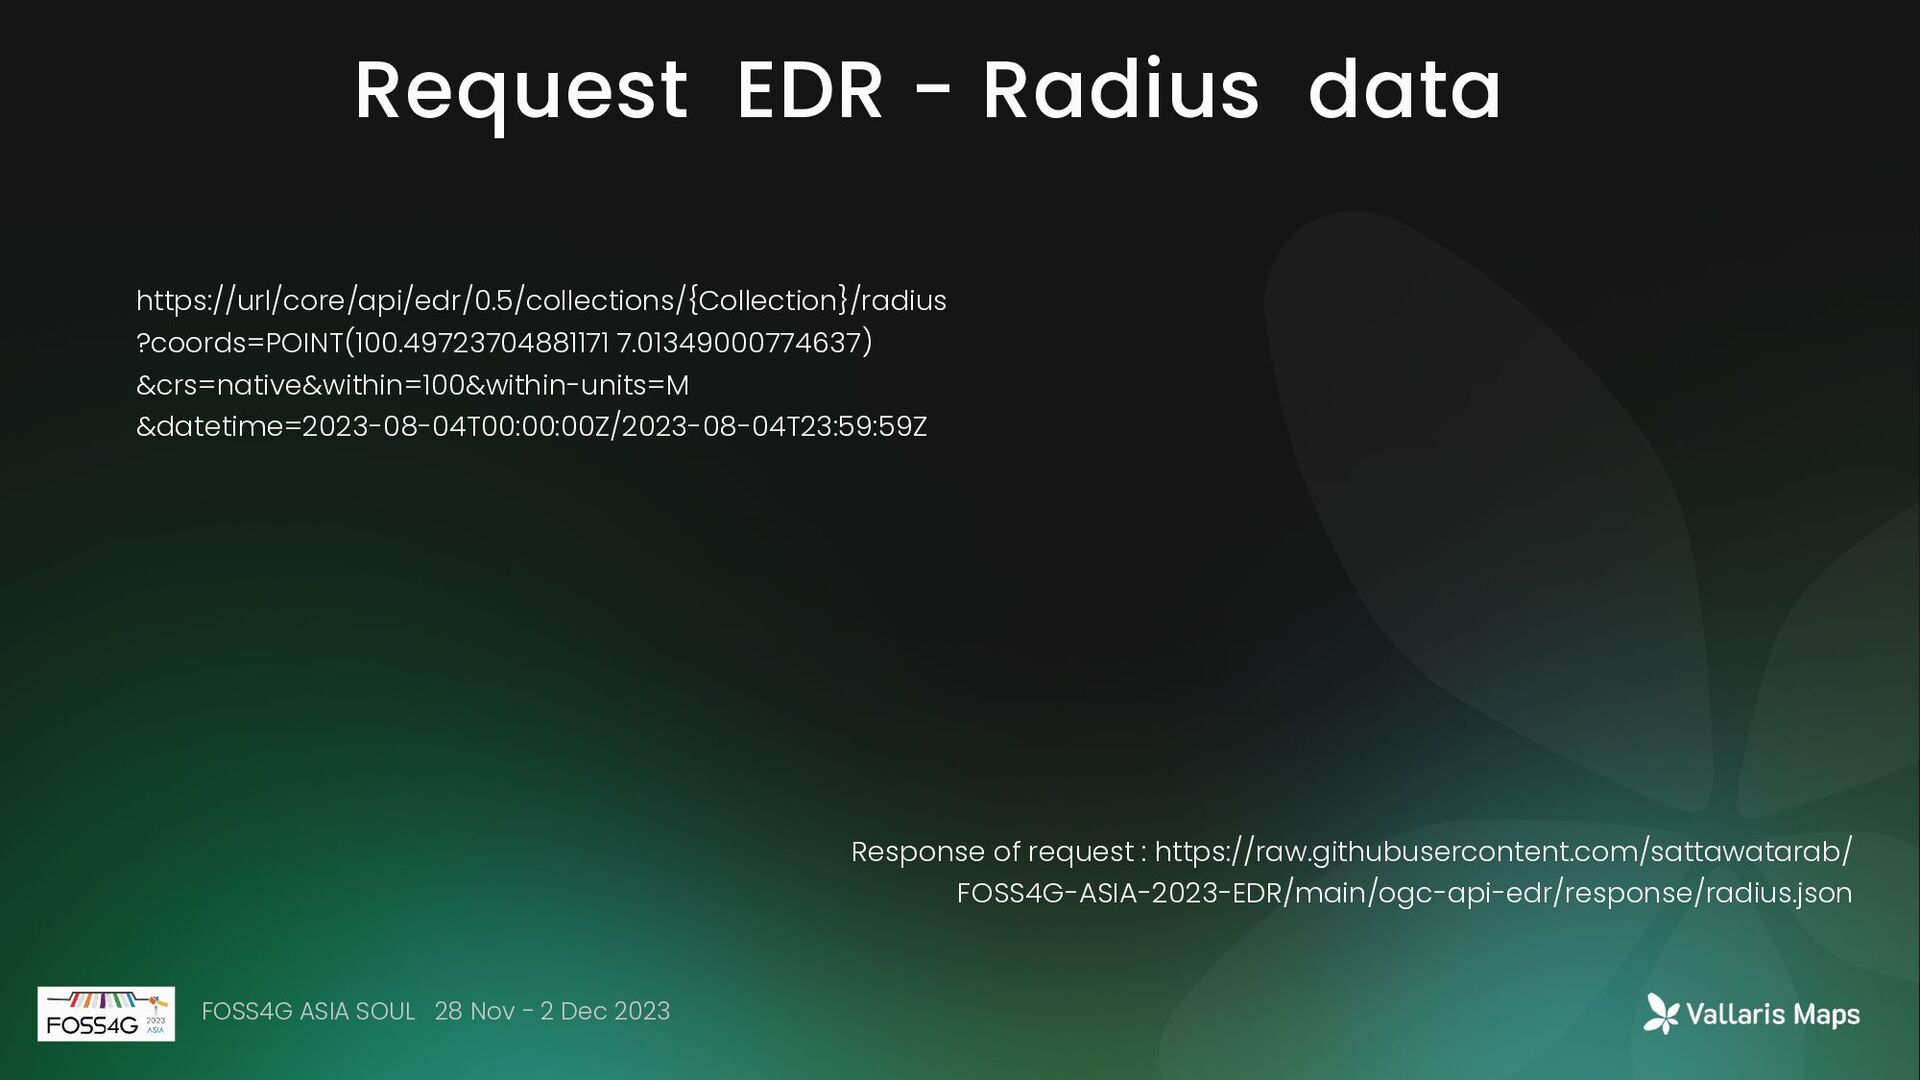
FOSS4G ASIA SOUL 28 Nov - 2 Dec 2023 Response of request : https://raw.githubusercontent.com/sattawatarab/ FOSS4G-ASIA-2023-EDR/main/ogc-api-edr/response/radius.json
FOSS4G ASIA SOUL 28 Nov - 2 Dec 2023 Response of request : https://raw.githubusercontent.com/sattawatarab/ FOSS4G-ASIA-2023-EDR/main/ogc-api-edr/response/radius.json
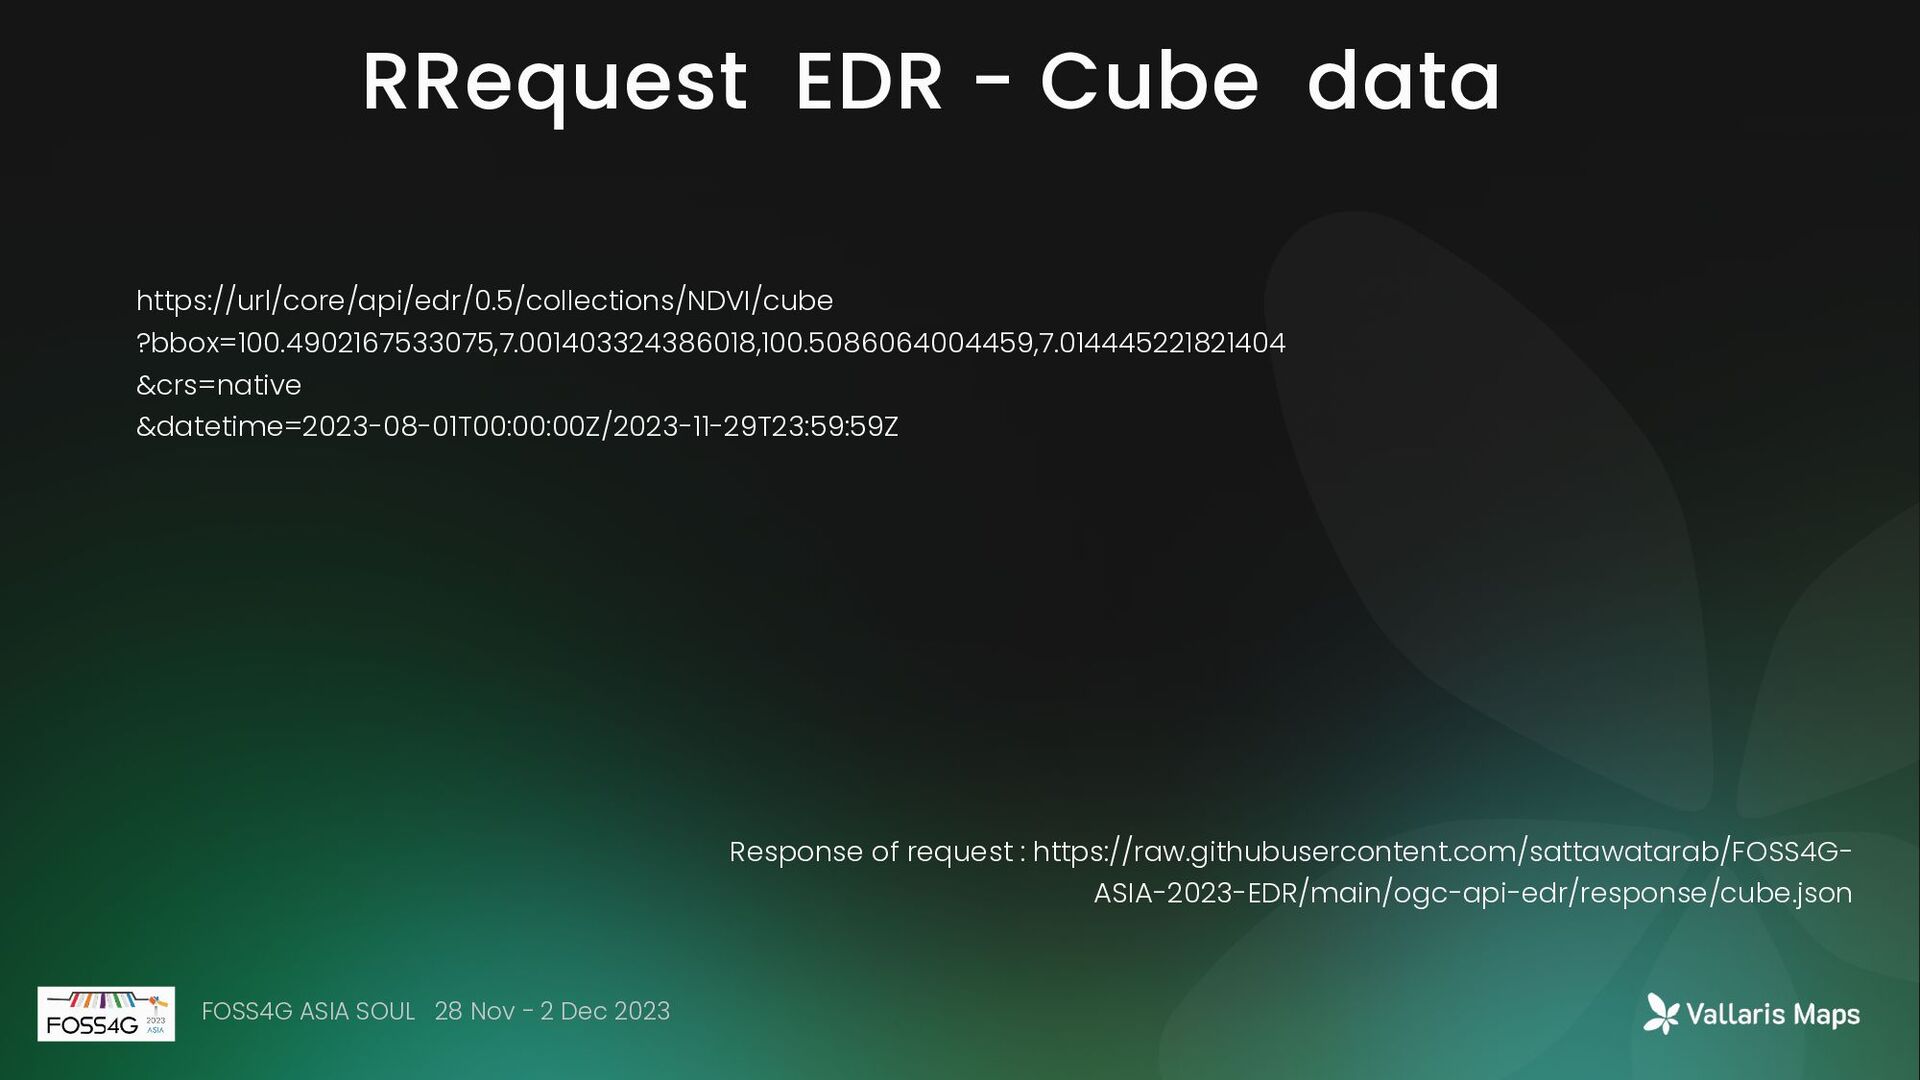
of request : https://raw.githubusercontent.com/sattawatarab/FOSS4G- ASIA-2023-EDR/main/ogc-api-edr/response/cube.json FOSS4G ASIA SOUL 28 Nov - 2 Dec 2023
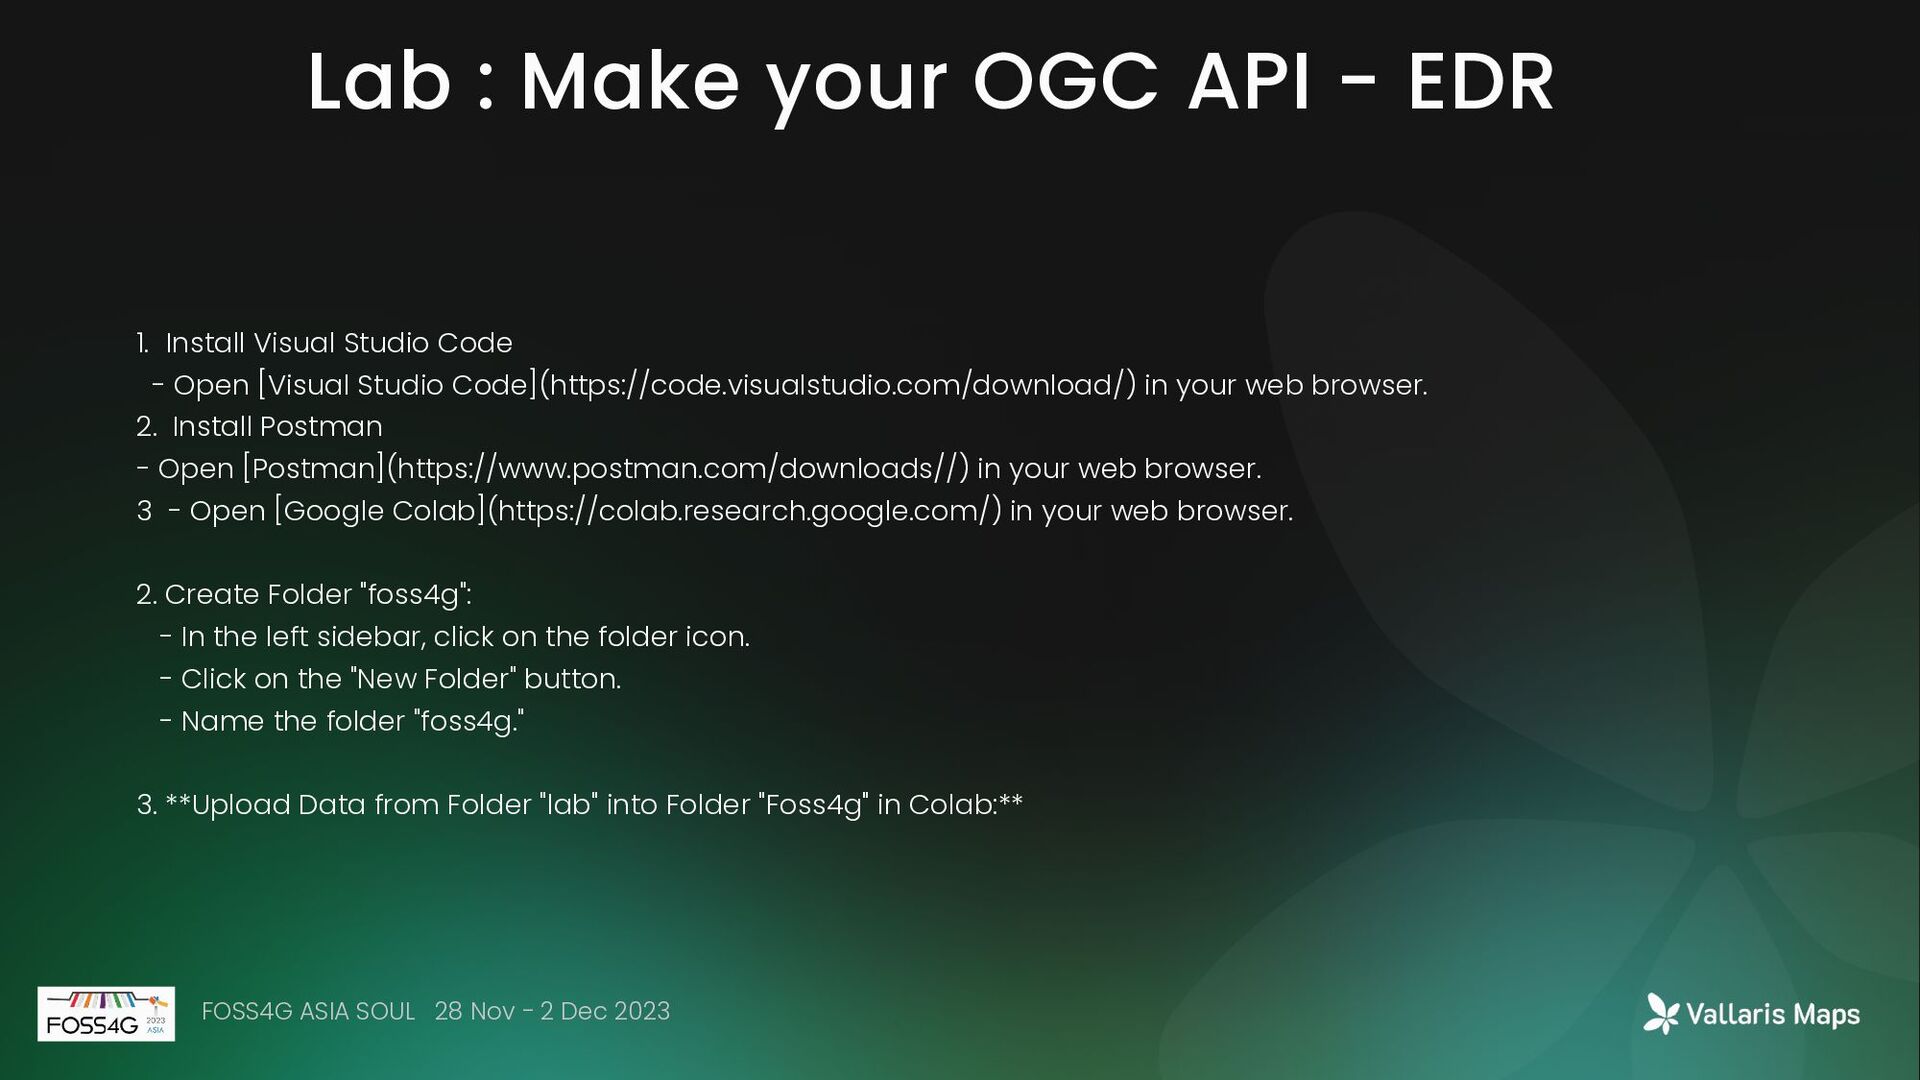
Visual Studio Code - Open [Visual Studio Code](https://code.visualstudio.com/download/) in your web browser. 2. Install Postman - Open [Postman](https://www.postman.com/downloads//) in your web browser. 3 - Open [Google Colab](https://colab.research.google.com/) in your web browser. 2. Create Folder "foss4g": - In the left sidebar, click on the folder icon. - Click on the "New Folder" button. - Name the folder "foss4g." 3. **Upload Data from Folder "lab" into Folder "Foss4g" in Colab:** FOSS4G ASIA SOUL 28 Nov - 2 Dec 2023
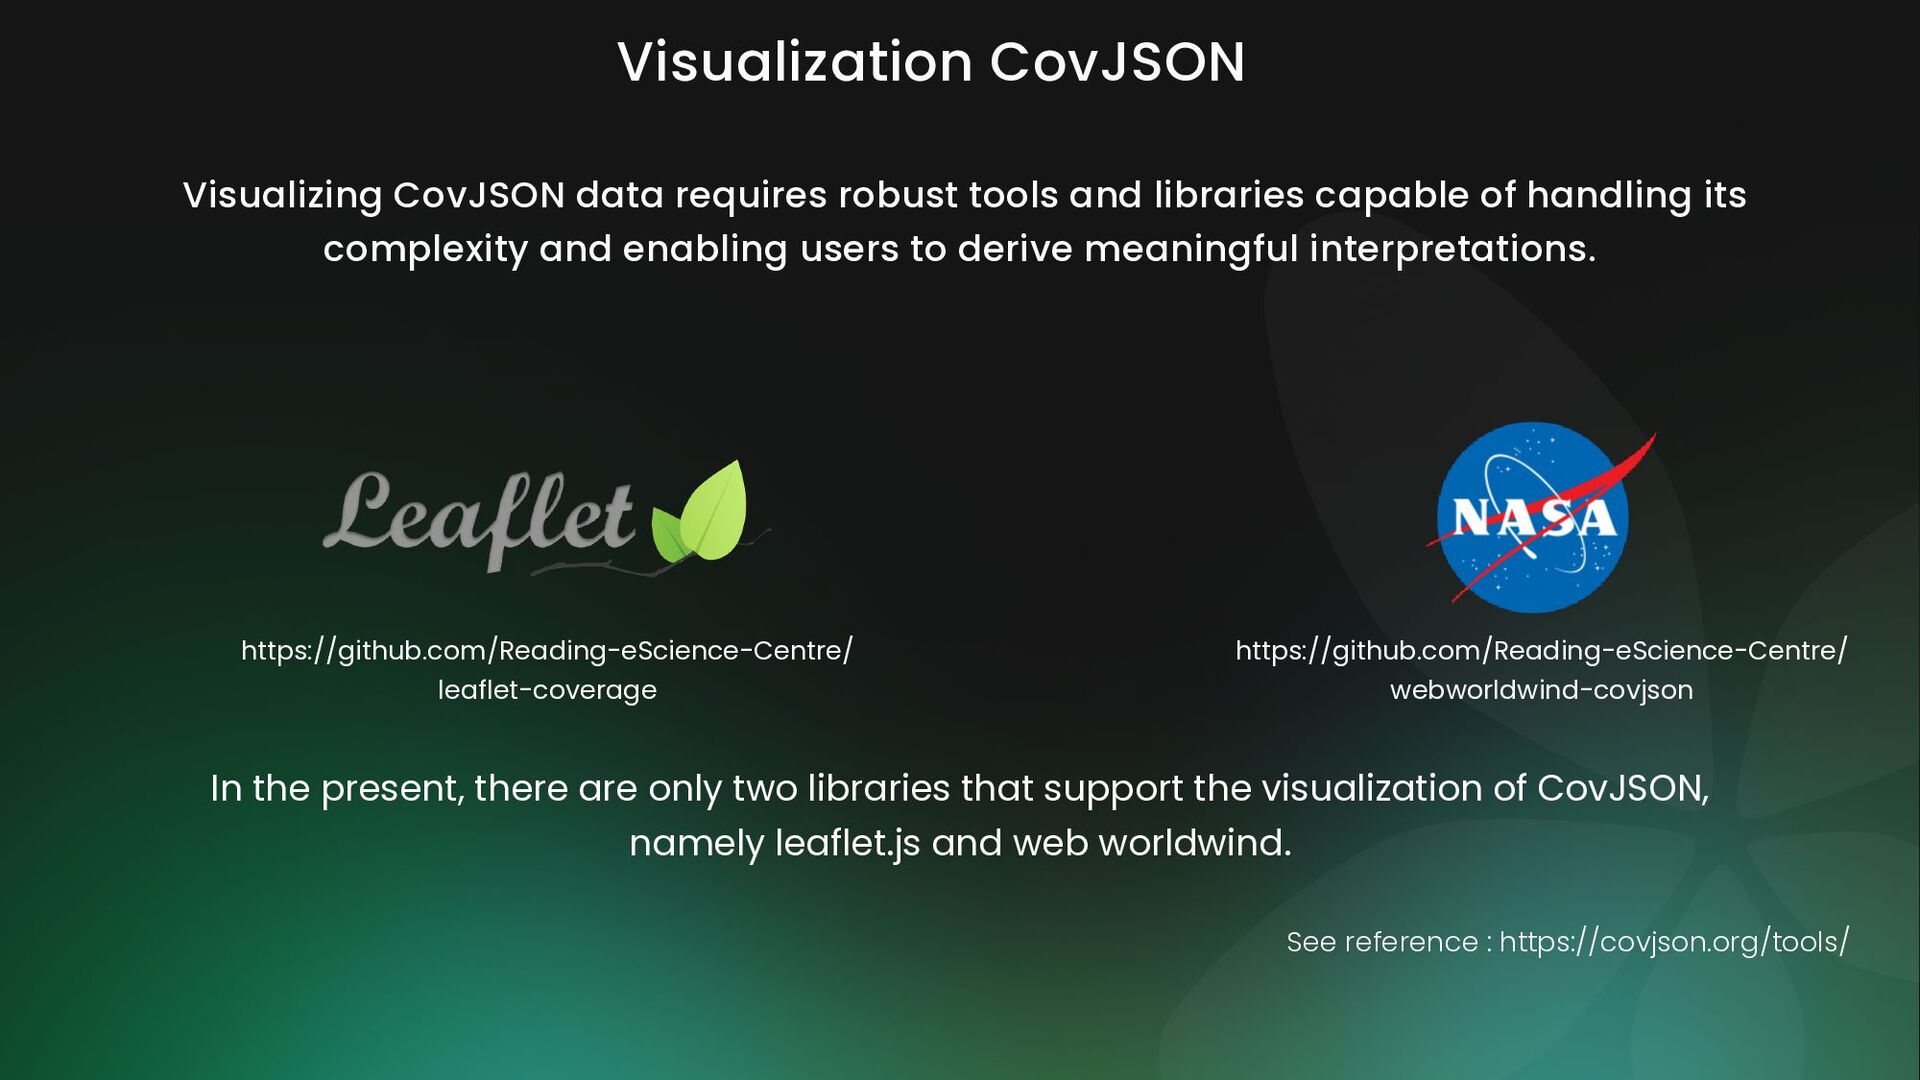
capable of handling its complexity and enabling users to derive meaningful interpretations. In the present, there are only two libraries that support the visualization of CovJSON, namely leaflet.js and web worldwind. See reference : https://covjson.org/tools/ https://github.com/Reading-eScience-Centre/ leaflet-coverage https://github.com/Reading-eScience-Centre/ webworldwind-covjson
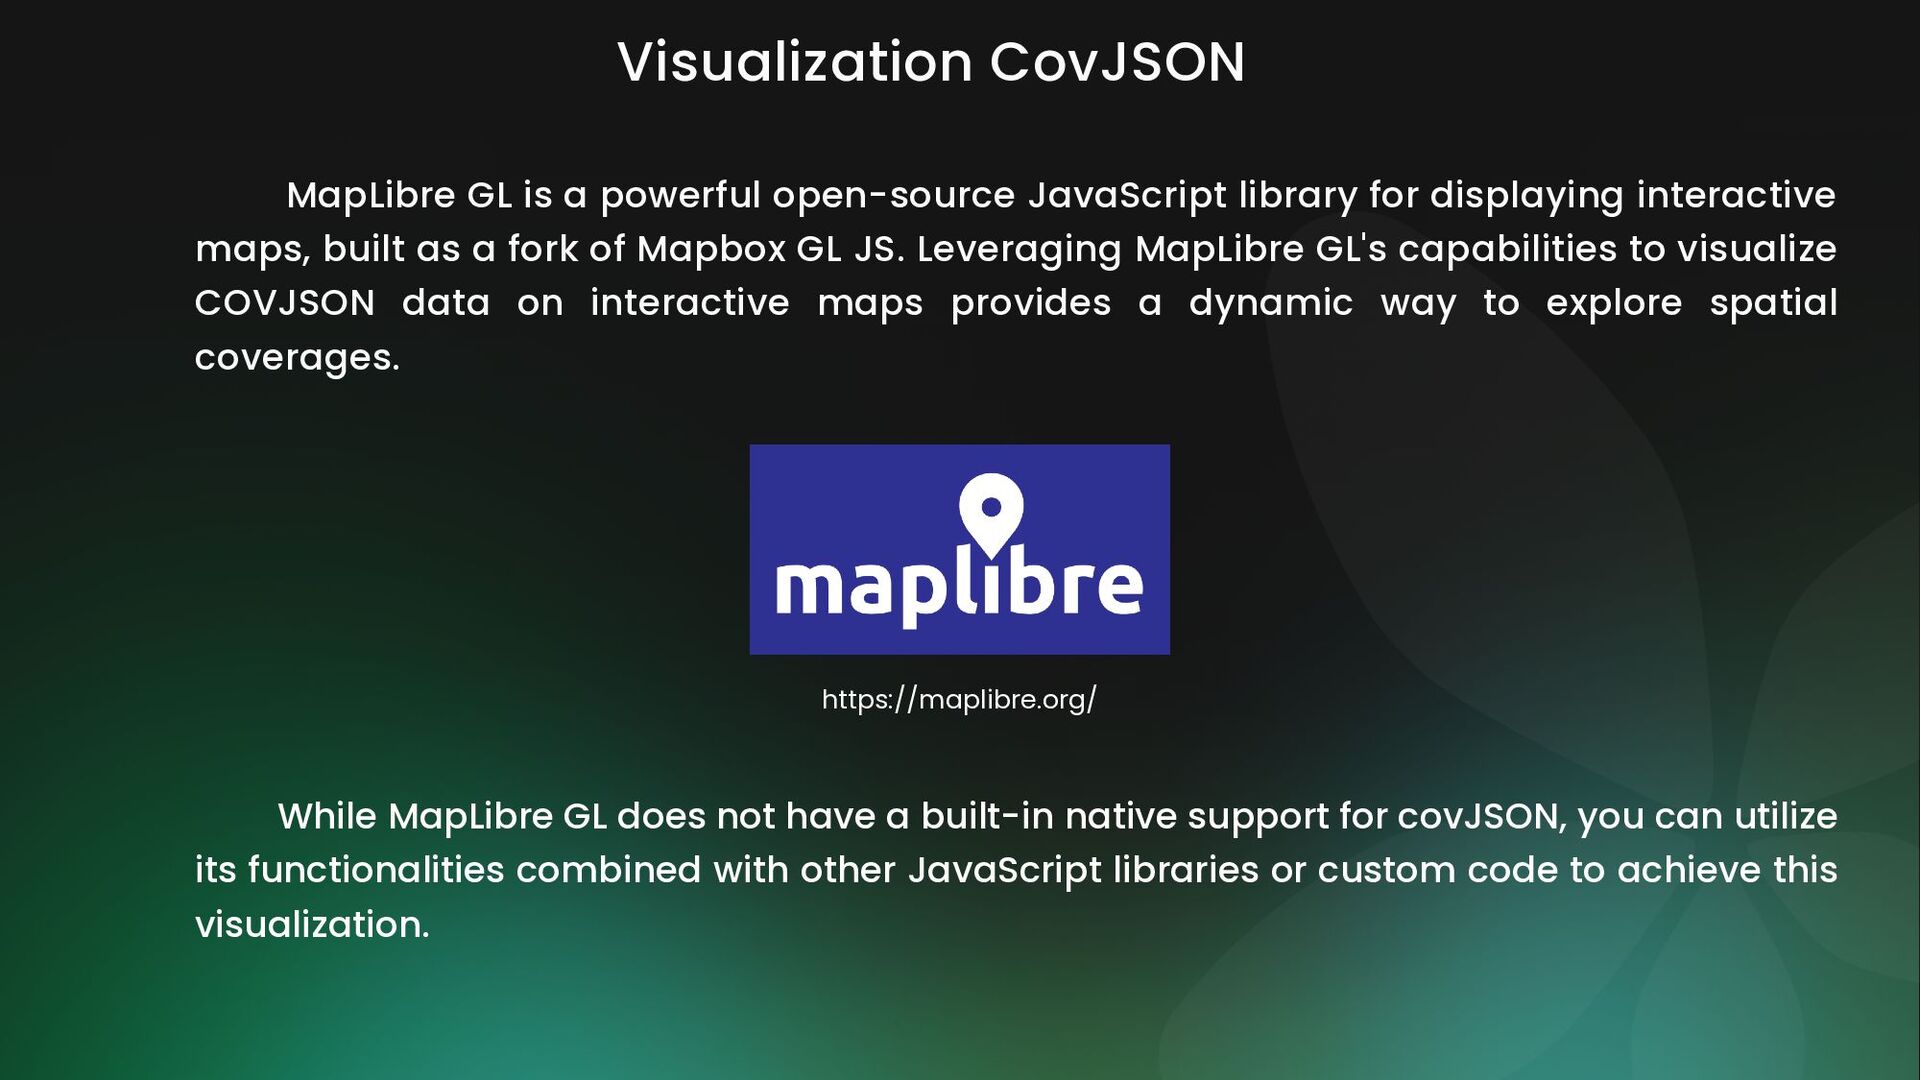
for displaying interactive maps, built as a fork of Mapbox GL JS. Leveraging MapLibre GL's capabilities to visualize COVJSON data on interactive maps provides a dynamic way to explore spatial coverages. While MapLibre GL does not have a built-in native support for covJSON, you can utilize its functionalities combined with other JavaScript libraries or custom code to achieve this visualization. https://maplibre.org/
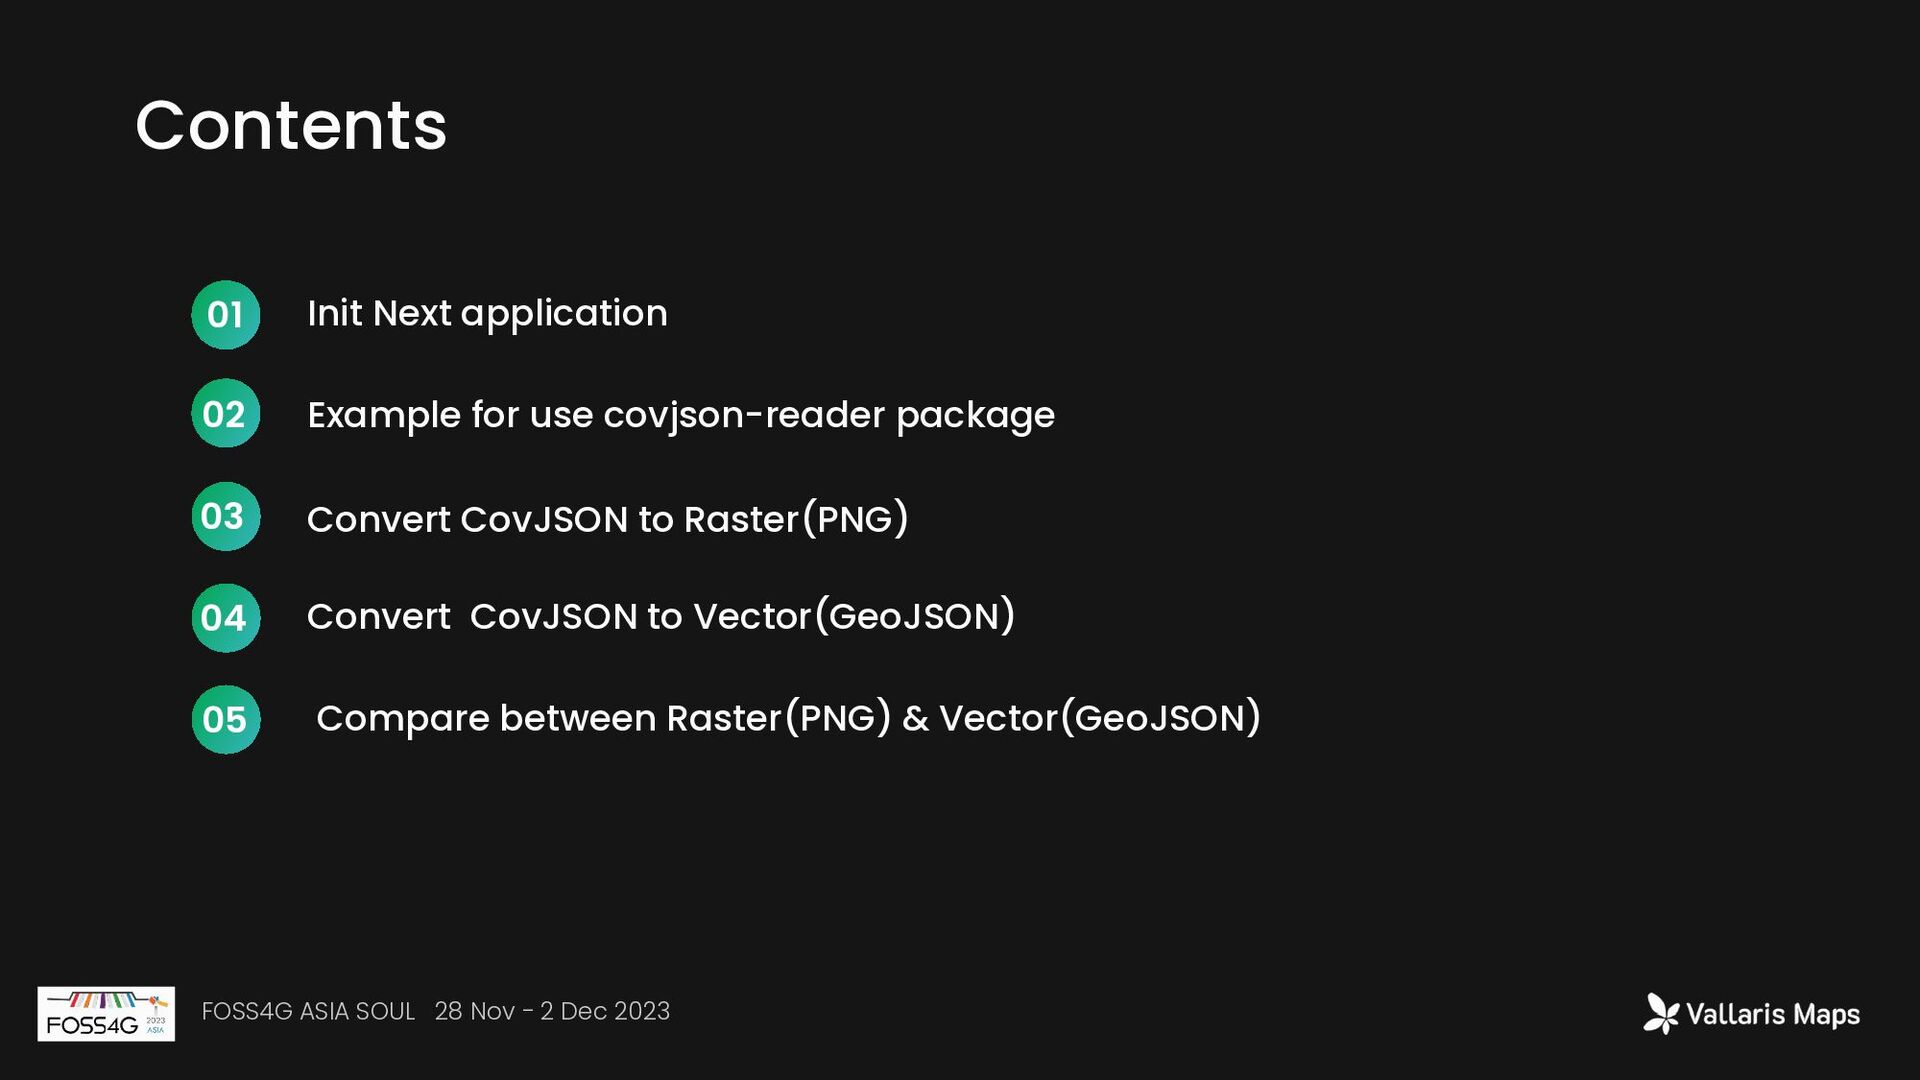
CovJSON to Raster(PNG) Convert CovJSON to Vector(GeoJSON) 01 02 03 04 FOSS4G ASIA SOUL 28 Nov - 2 Dec 2023 Compare between Raster(PNG) & Vector(GeoJSON) 05