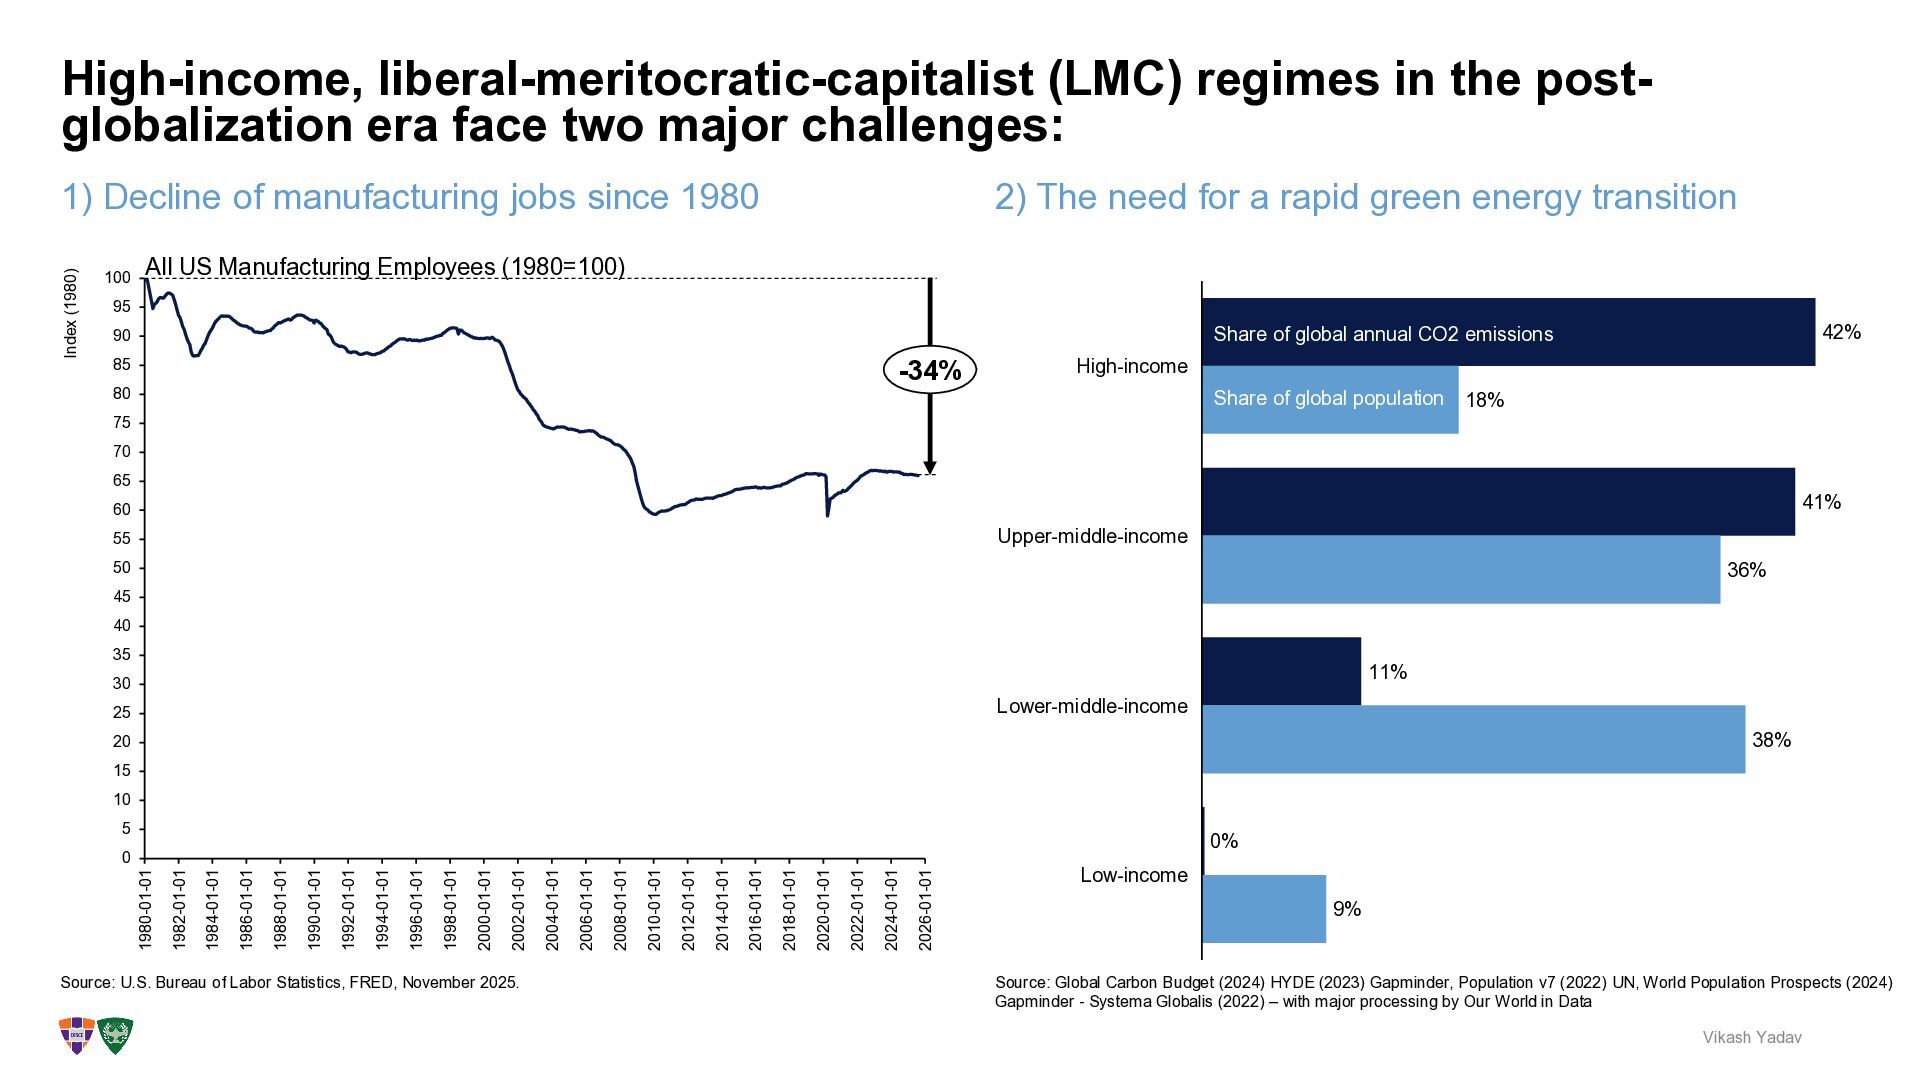
regimes in the post- globalization era face two major challenges: Vikash Yadav 2) The need for a rapid green energy transition 0 5 10 15 20 25 30 35 40 45 50 55 60 65 70 75 80 85 90 95 100 1980-01-01 1982-01-01 1984-01-01 1988-01-01 1990-01-01 1992-01-01 1994-01-01 1996-01-01 1998-01-01 2000-01-01 2002-01-01 2004-01-01 2006-01-01 2012-01-01 2018-01-01 2010-01-01 2020-01-01 2014-01-01 2022-01-01 2008-01-01 2024-01-01 2016-01-01 2026-01-01 1986-01-01 Index (1980) -34% All US Manufacturing Employees (1980=100) Source: U.S. Bureau of Labor Statistics, FRED, November 2025. 42% 41% 11% 0% 18% 36% 38% 9% High-income Upper-middle-income Lower-middle-income Low-income Source: Global Carbon Budget (2024) HYDE (2023) Gapminder, Population v7 (2022) UN, World Population Prospects (2024) Gapminder - Systema Globalis (2022) – with major processing by Our World in Data Share of global annual CO2 emissions Share of global population
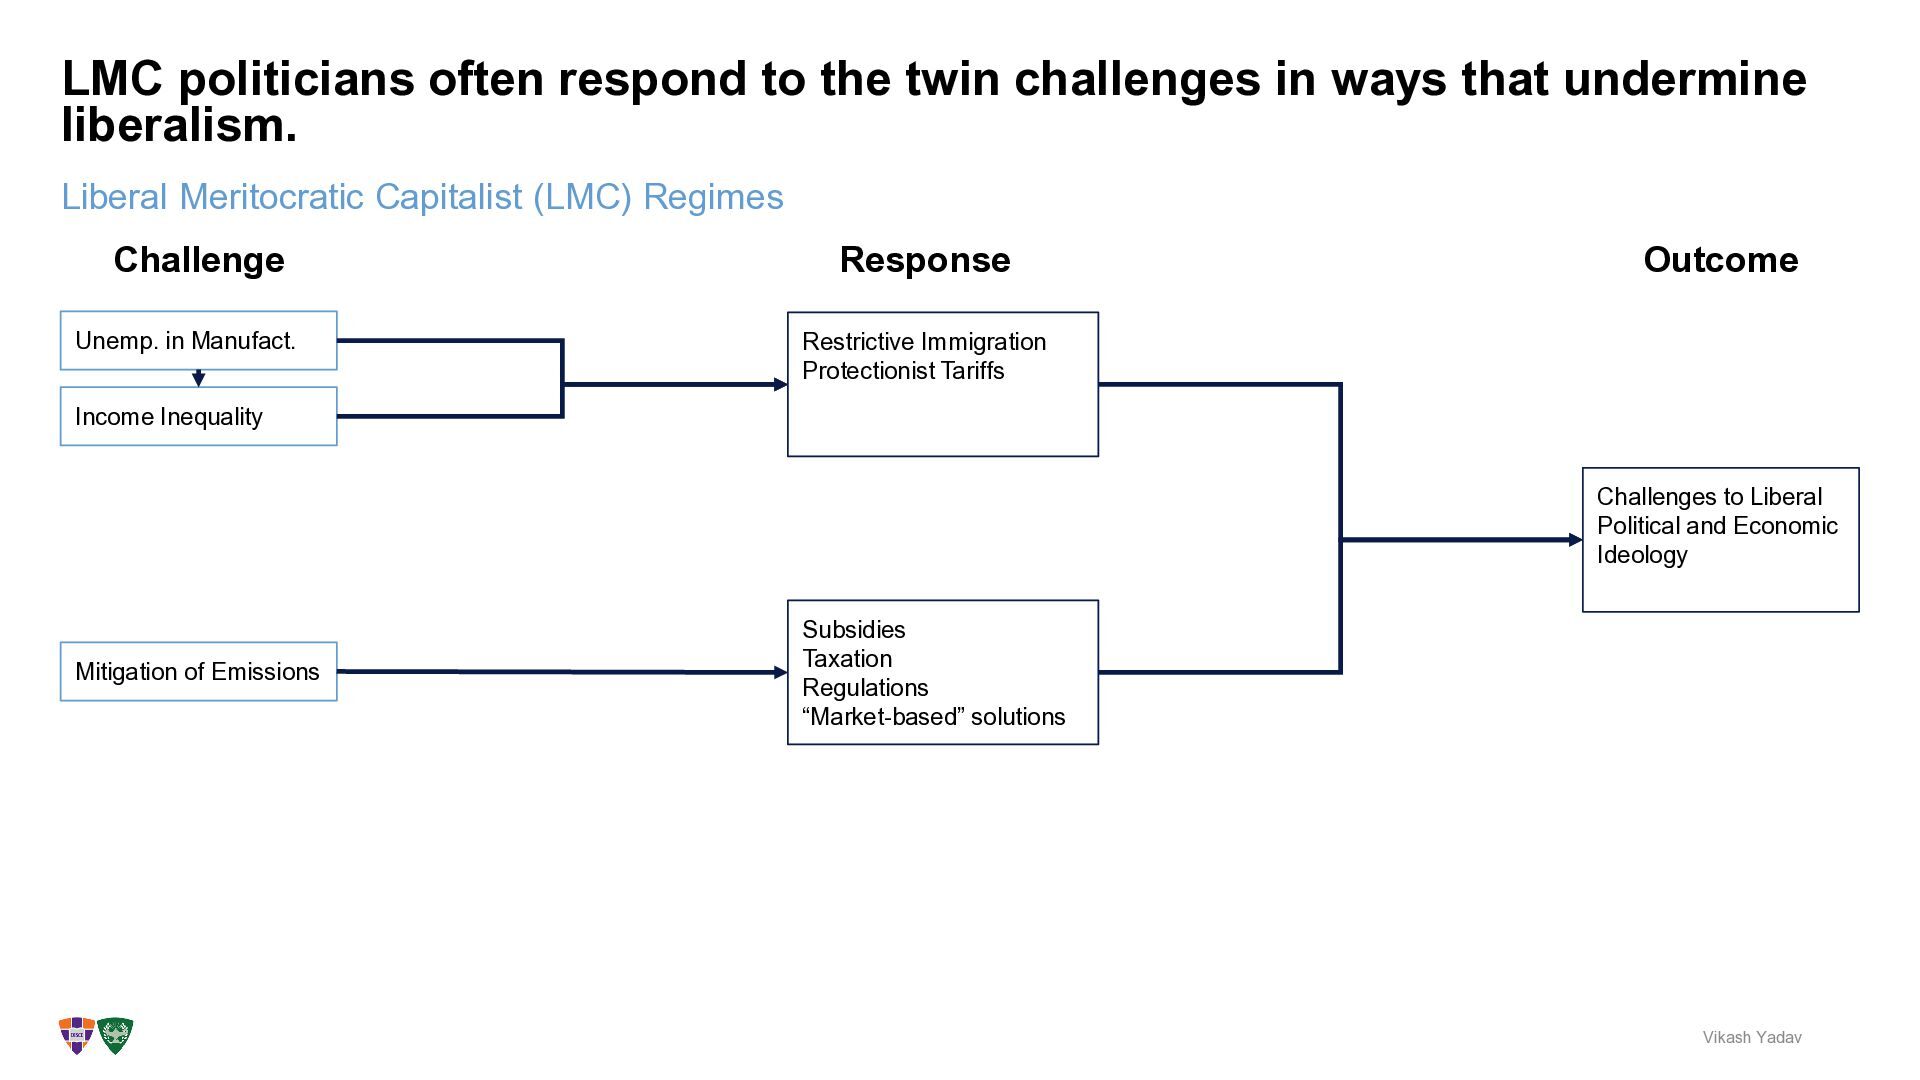
the twin challenges in ways that undermine liberalism. Vikash Yadav Challenge Unemp. in Manufact. Income Inequality Restrictive Immigration Protectionist Tariffs Challenges to Liberal Political and Economic Ideology Mitigation of Emissions Subsidies Taxation Regulations “Market-based” solutions Response Outcome
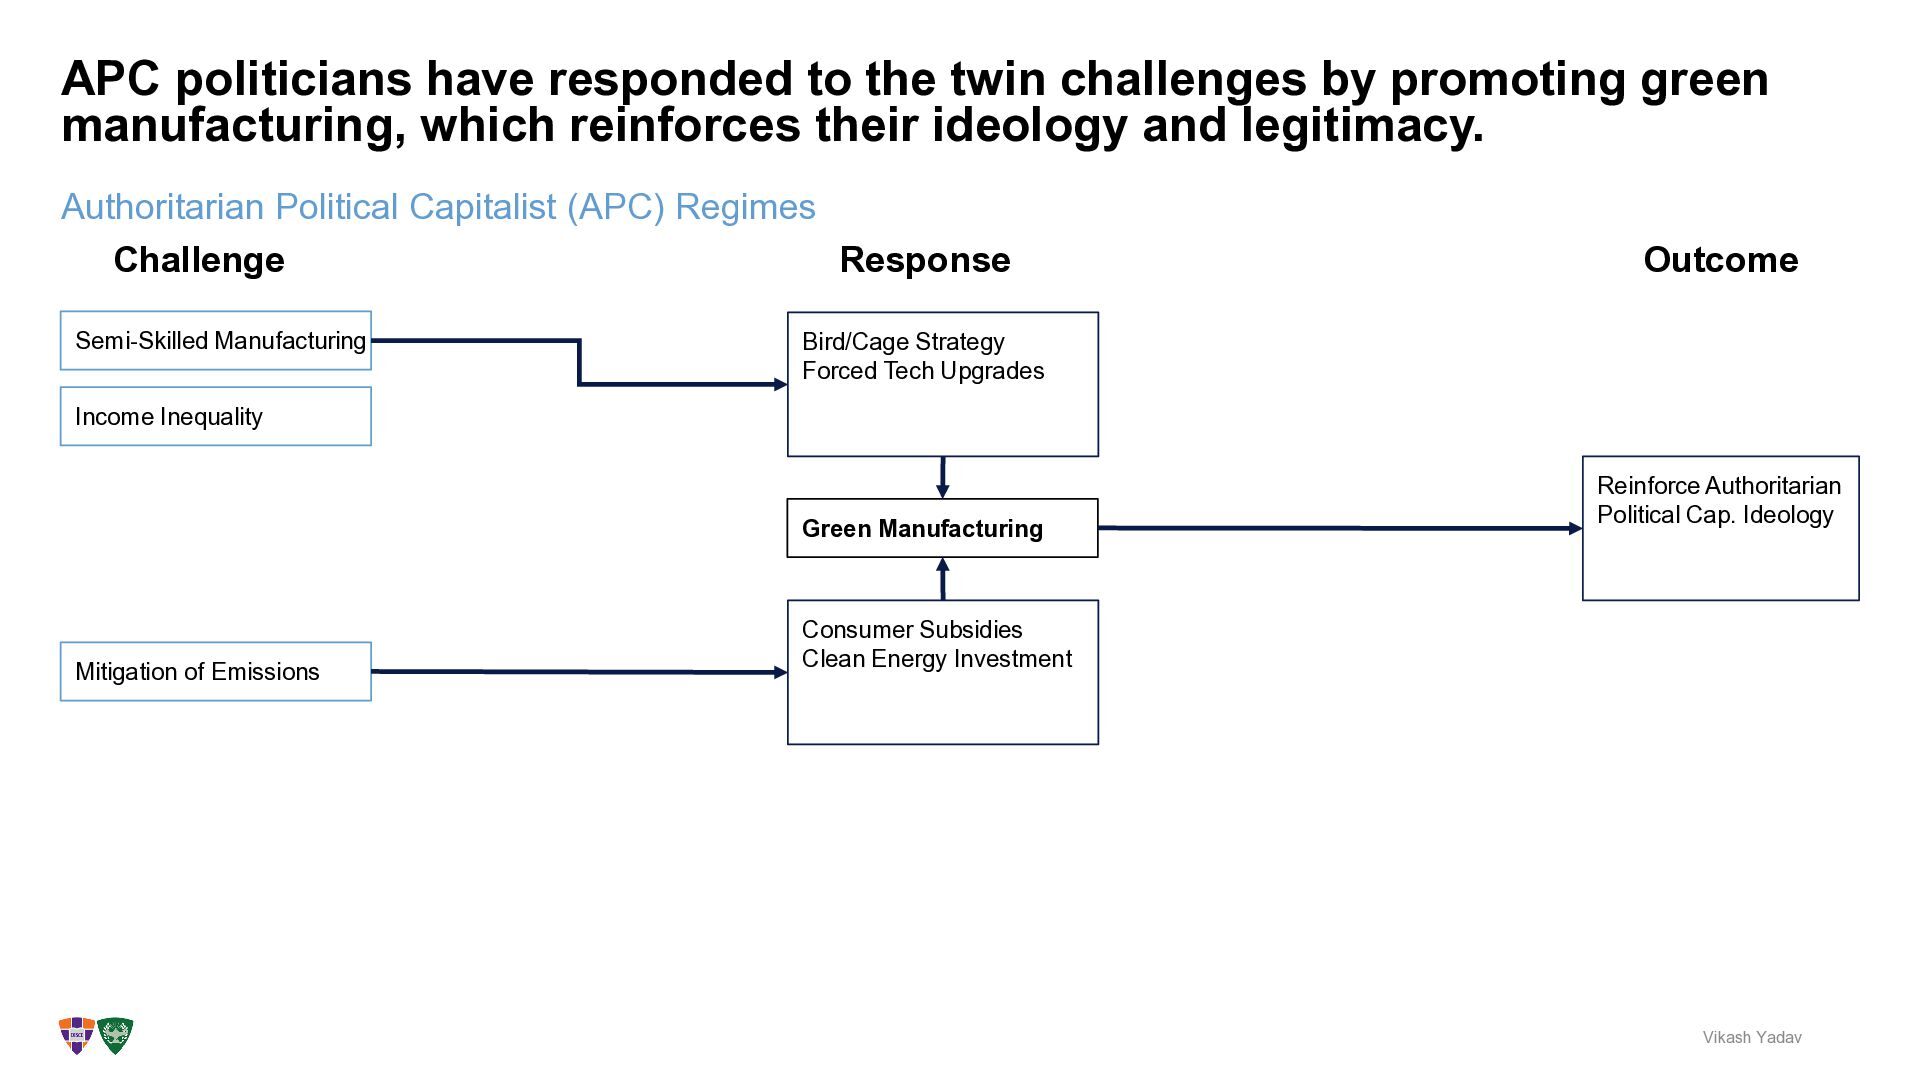
green manufacturing, which reinforces their ideology and legitimacy. Vikash Yadav Authoritarian Political Capitalist (APC) Regimes Challenge Semi-Skilled Manufacturing Green Manufacturing Bird/Cage Strategy Forced Tech Upgrades Reinforce Authoritarian Political Cap. Ideology Mitigation of Emissions Consumer Subsidies Clean Energy Investment Response Outcome Income Inequality
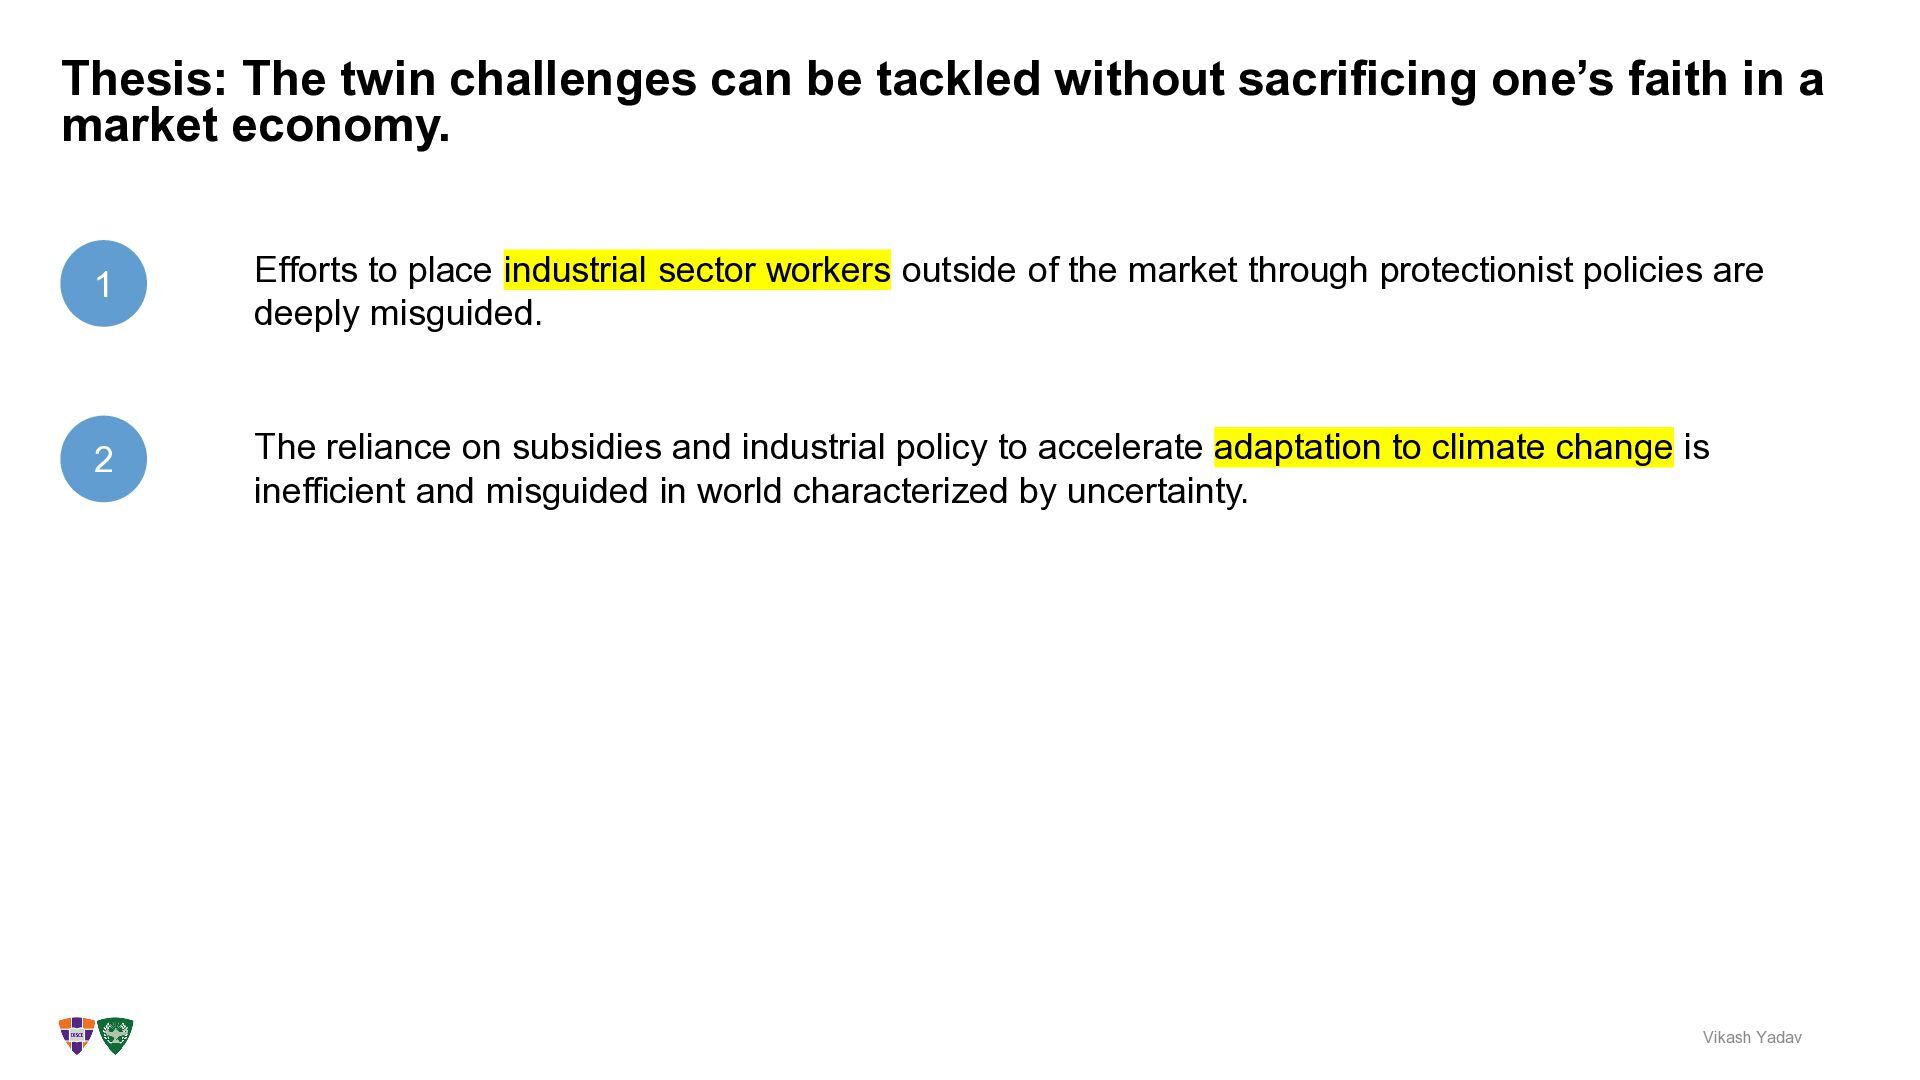
faith in a market economy. Vikash Yadav 1 2 Efforts to place industrial sector workers outside of the market through protectionist policies are deeply misguided. The reliance on subsidies and industrial policy to accelerate adaptation to climate change is inefficient and misguided in world characterized by uncertainty.
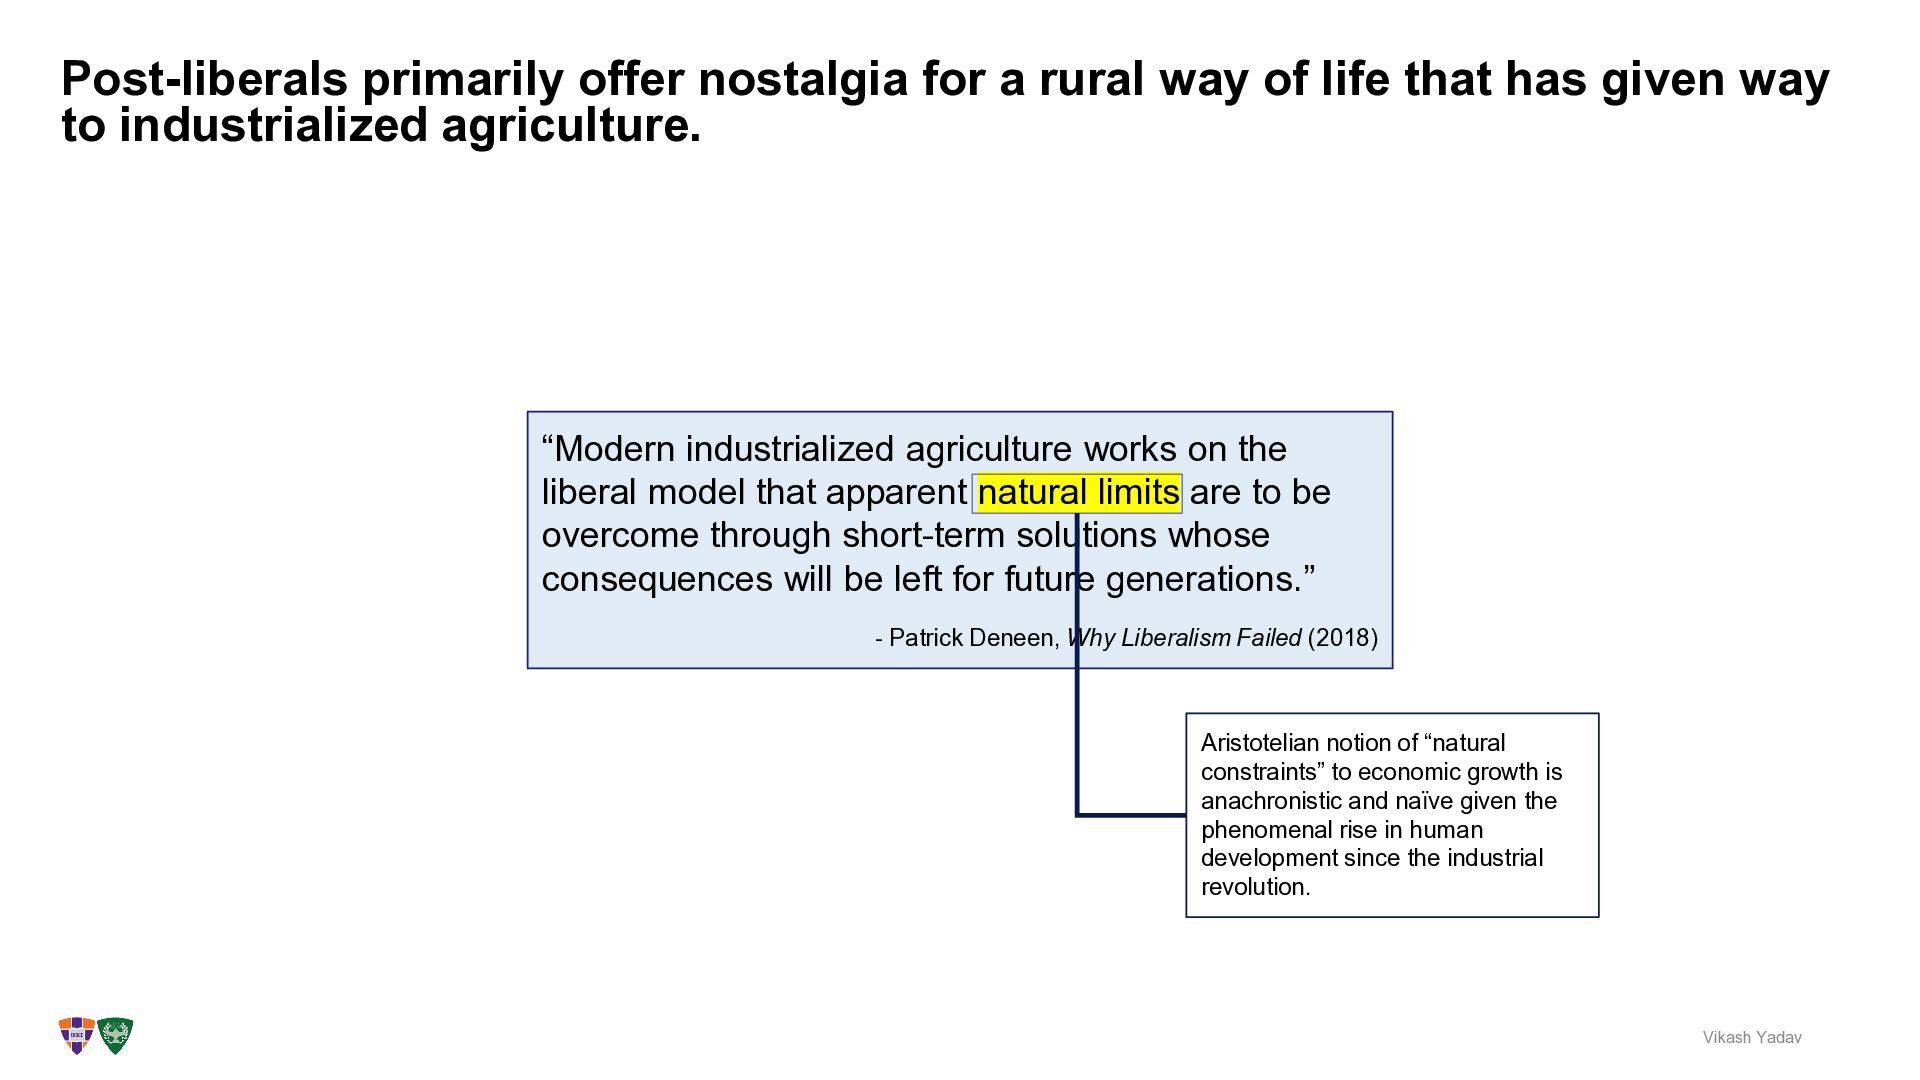
that has given way to industrialized agriculture. Vikash Yadav “Modern industrialized agriculture works on the liberal model that apparent natural limits are to be overcome through short-term solutions whose consequences will be left for future generations.” - Patrick Deneen, Why Liberalism Failed (2018) Aristotelian notion of “natural constraints” to economic growth is anachronistic and naïve given the phenomenal rise in human development since the industrial revolution.
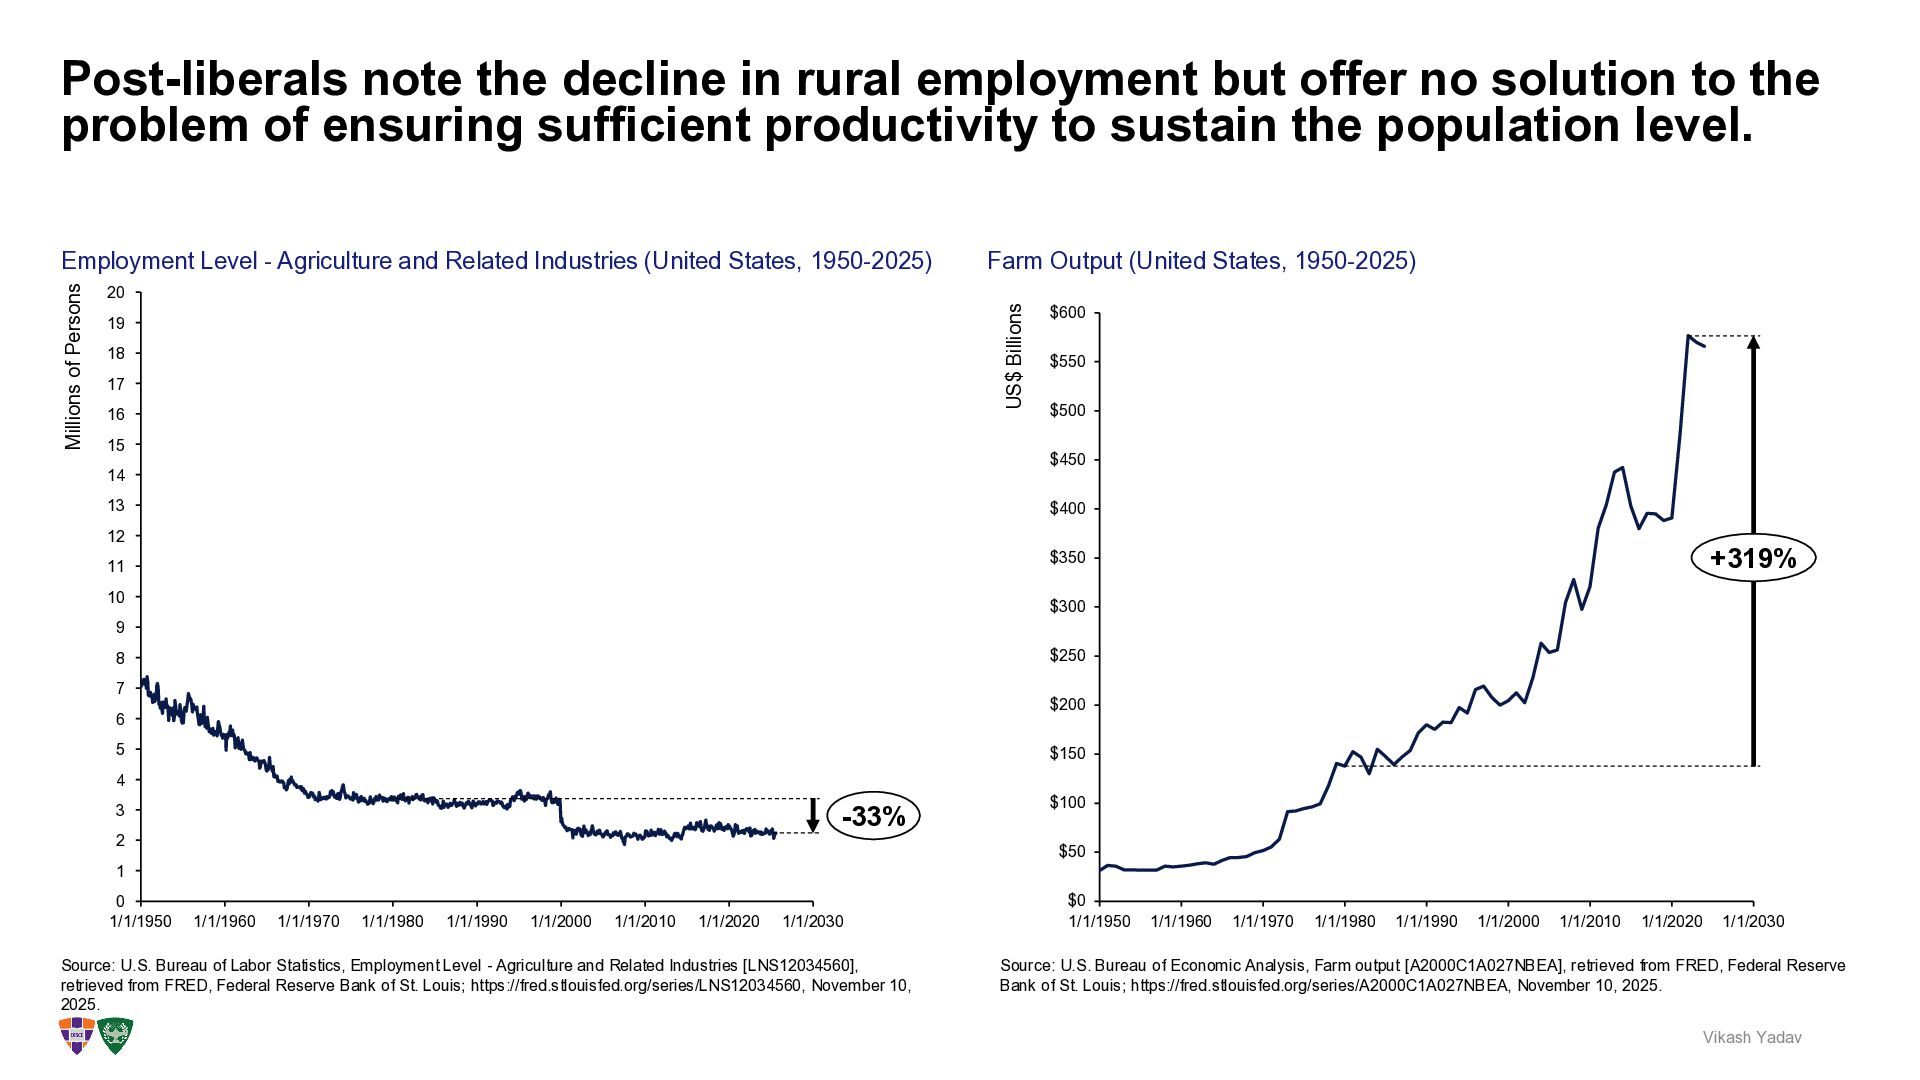
solution to the problem of ensuring sufficient productivity to sustain the population level. Vikash Yadav 1/1/1970 1/1/1950 1/1/1980 1/1/1990 1/1/2000 1/1/2010 1/1/2020 1/1/2030 0 1 2 3 4 5 6 7 8 9 10 11 12 13 14 1/1/1960 16 17 18 19 15 20 Millions of Persons -33% Employment Level - Agriculture and Related Industries (United States, 1950-2025) Source: U.S. Bureau of Labor Statistics, Employment Level - Agriculture and Related Industries [LNS12034560], retrieved from FRED, Federal Reserve Bank of St. Louis; https://fred.stlouisfed.org/series/LNS12034560, November 10, 2025. $0 $50 $100 $150 $200 $250 $300 $350 $400 $450 $500 $550 $600 1/1/2000 1/1/1960 1/1/1980 1/1/2020 1/1/1950 1/1/1970 1/1/1990 1/1/2010 1/1/2030 US$ Billions +319% Farm Output (United States, 1950-2025) Source: U.S. Bureau of Economic Analysis, Farm output [A2000C1A027NBEA], retrieved from FRED, Federal Reserve Bank of St. Louis; https://fred.stlouisfed.org/series/A2000C1A027NBEA, November 10, 2025.
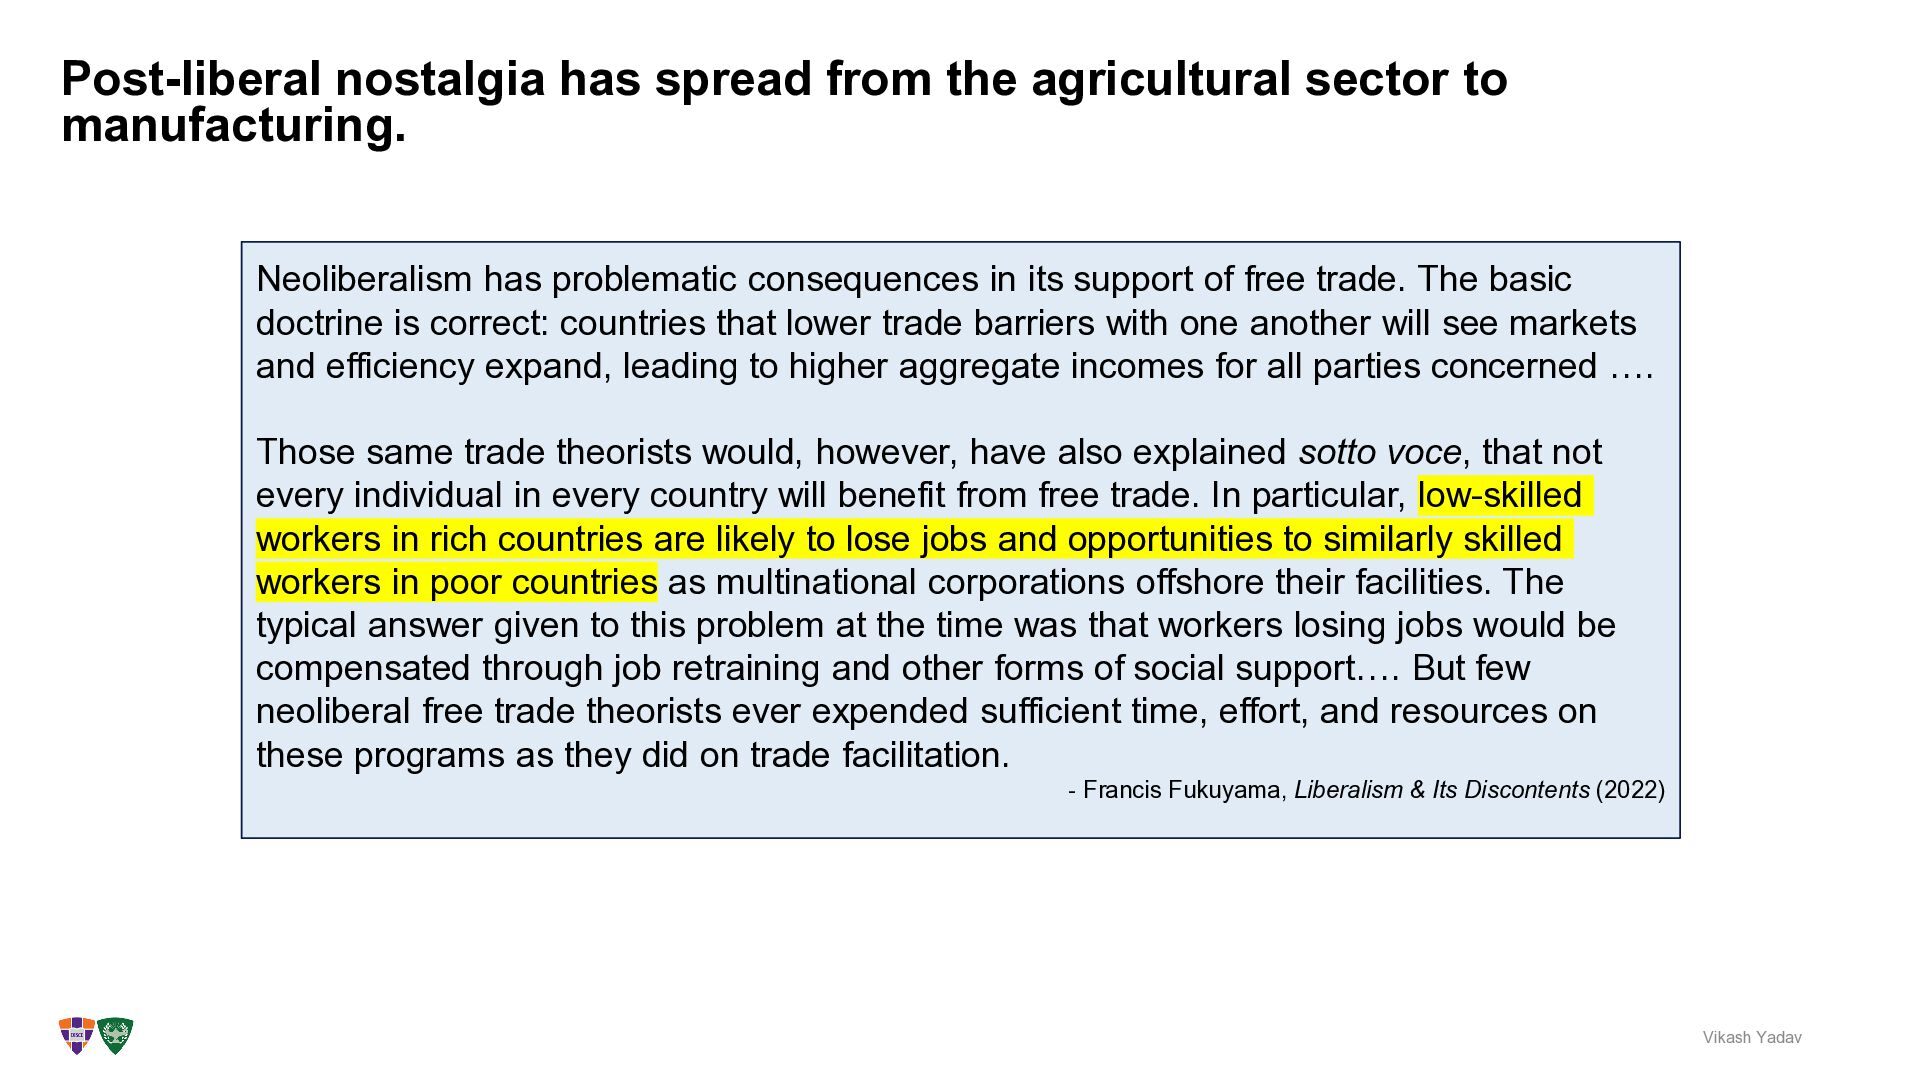
Vikash Yadav Neoliberalism has problematic consequences in its support of free trade. The basic doctrine is correct: countries that lower trade barriers with one another will see markets and efficiency expand, leading to higher aggregate incomes for all parties concerned …. Those same trade theorists would, however, have also explained sotto voce, that not every individual in every country will benefit from free trade. In particular, low-skilled workers in rich countries are likely to lose jobs and opportunities to similarly skilled workers in poor countries as multinational corporations offshore their facilities. The typical answer given to this problem at the time was that workers losing jobs would be compensated through job retraining and other forms of social support…. But few neoliberal free trade theorists ever expended sufficient time, effort, and resources on these programs as they did on trade facilitation. - Francis Fukuyama, Liberalism & Its Discontents (2022)
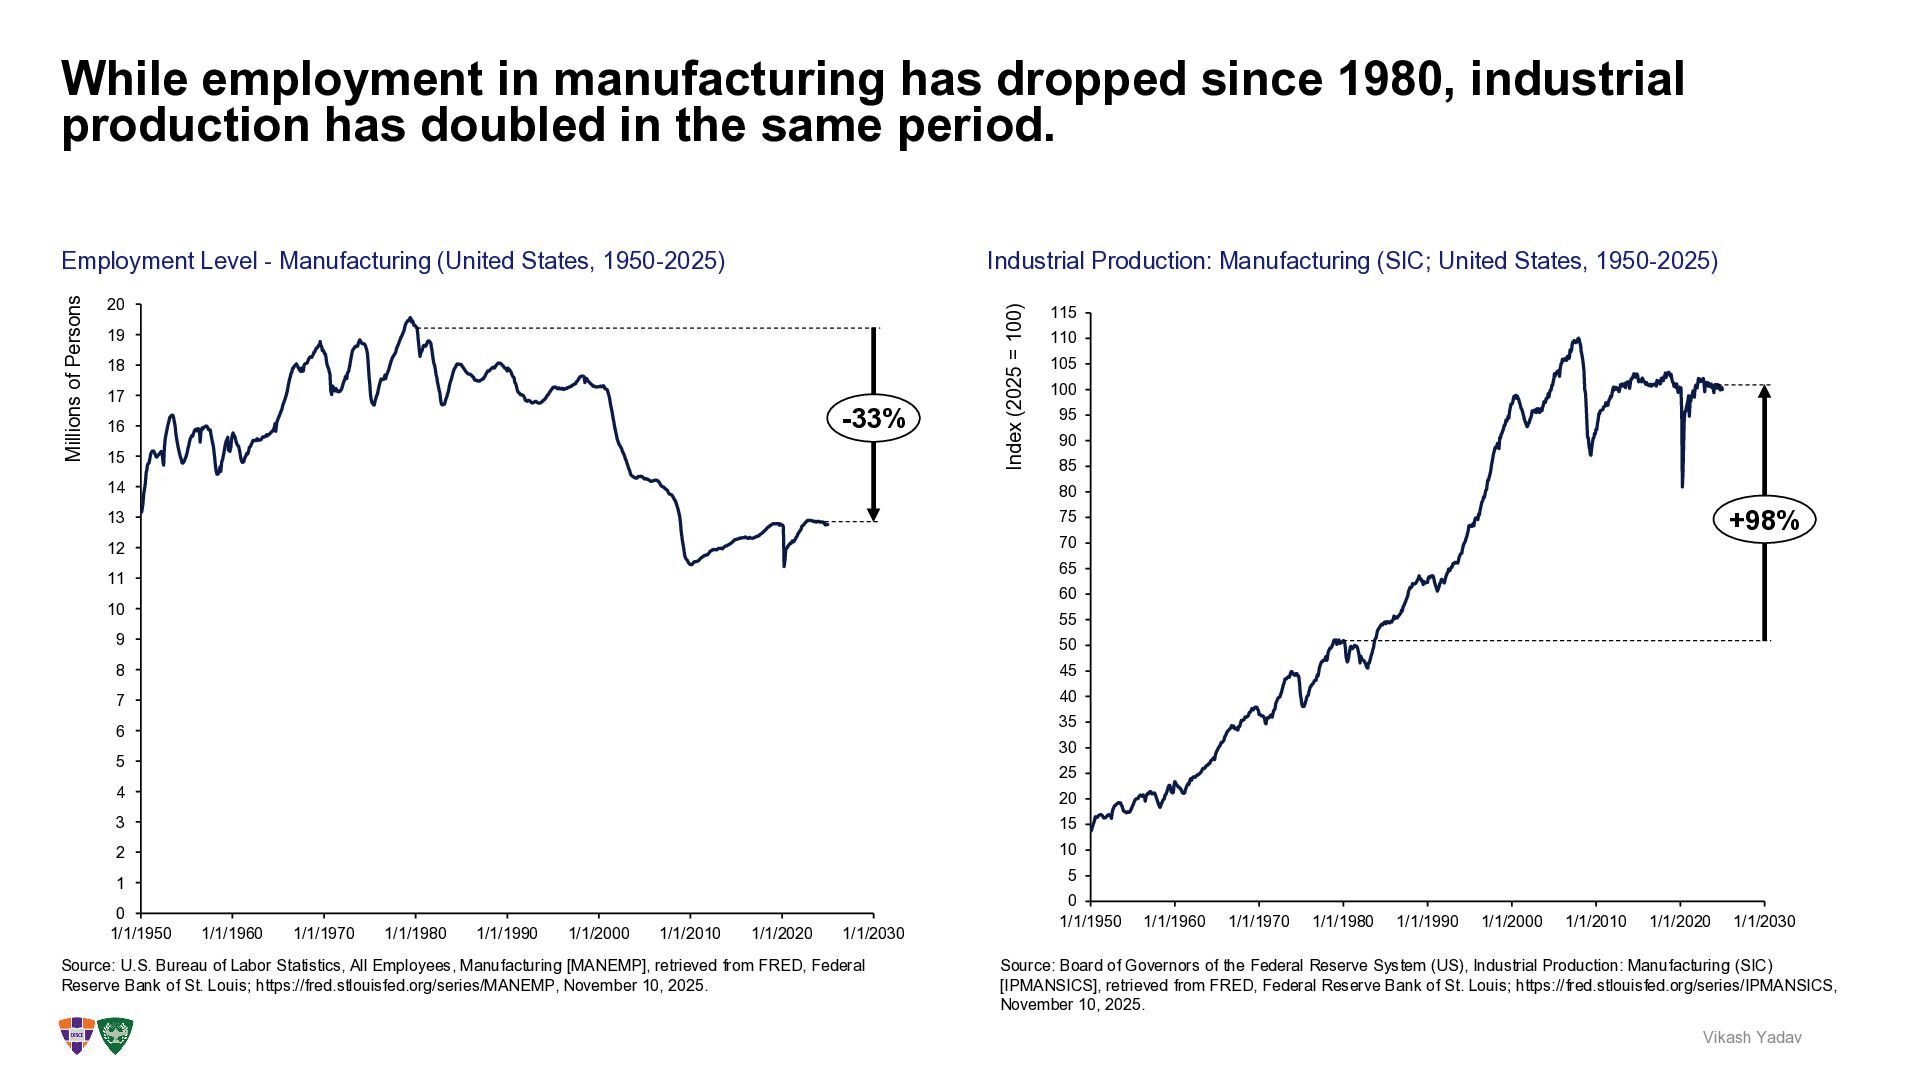
has doubled in the same period. Vikash Yadav 4 5 6 7 8 9 10 11 13 14 15 16 1/1/2020 18 19 20 17 0 1/1/1960 1/1/1950 1/1/1970 1/1/1990 1/1/2010 1/1/1980 1/1/2000 1 2 3 12 1/1/2030 Millions of Persons -33% Employment Level - Manufacturing (United States, 1950-2025) Source: U.S. Bureau of Labor Statistics, All Employees, Manufacturing [MANEMP], retrieved from FRED, Federal Reserve Bank of St. Louis; https://fred.stlouisfed.org/series/MANEMP, November 10, 2025. 0 5 10 15 20 25 30 35 40 45 50 55 60 65 70 75 80 85 90 95 100 105 110 115 1/1/2000 1/1/1960 1/1/1980 1/1/2020 1/1/1950 1/1/1970 1/1/1990 1/1/2010 1/1/2030 Index (2025 = 100) +98% Industrial Production: Manufacturing (SIC; United States, 1950-2025) Source: Board of Governors of the Federal Reserve System (US), Industrial Production: Manufacturing (SIC) [IPMANSICS], retrieved from FRED, Federal Reserve Bank of St. Louis; https://fred.stlouisfed.org/series/IPMANSICS, November 10, 2025.
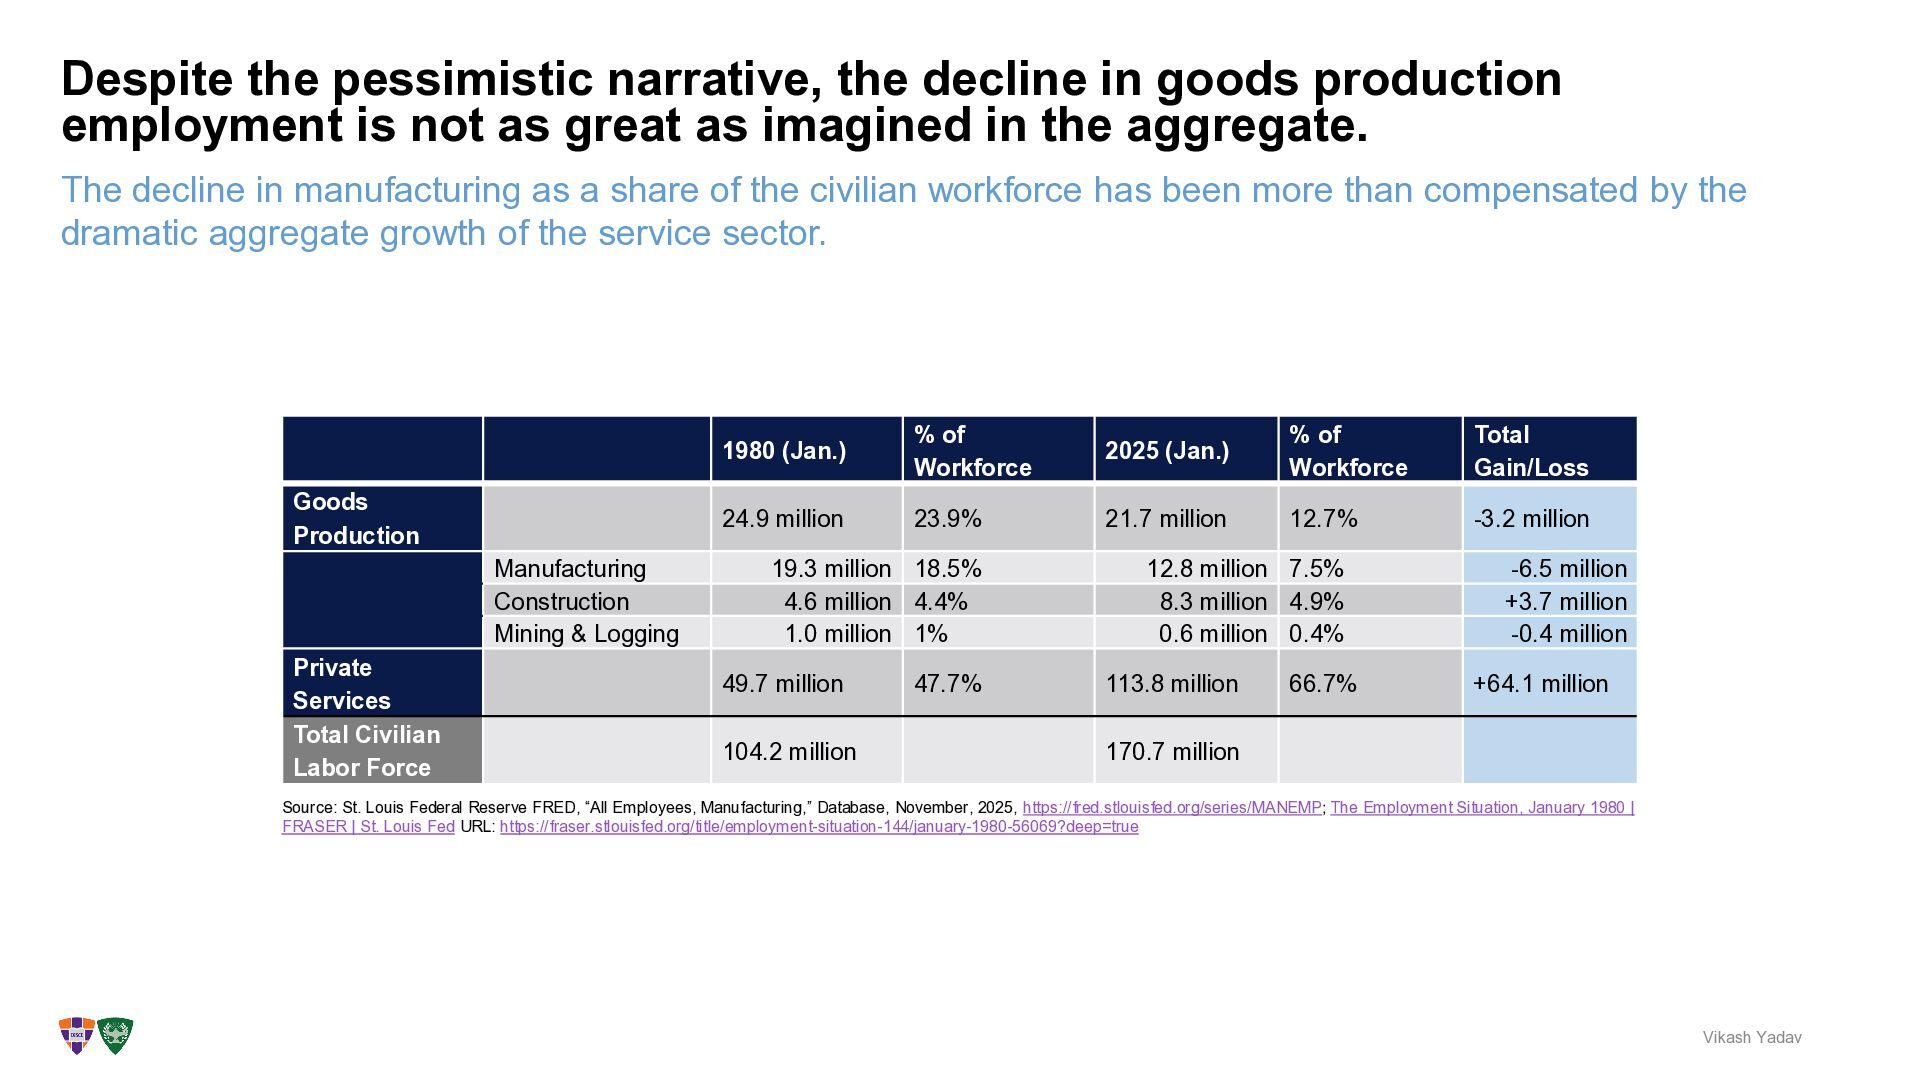
workforce has been more than compensated by the dramatic aggregate growth of the service sector. Despite the pessimistic narrative, the decline in goods production employment is not as great as imagined in the aggregate. Vikash Yadav 1980 (Jan.) % of Workforce 2025 (Jan.) % of Workforce Total Gain/Loss Goods Production 24.9 million 23.9% 21.7 million 12.7% -3.2 million Manufacturing 19.3 million 18.5% 12.8 million 7.5% -6.5 million Construction 4.6 million 4.4% 8.3 million 4.9% +3.7 million Mining & Logging 1.0 million 1% 0.6 million 0.4% -0.4 million Private Services 49.7 million 47.7% 113.8 million 66.7% +64.1 million Total Civilian Labor Force 104.2 million 170.7 million Source: St. Louis Federal Reserve FRED, “All Employees, Manufacturing,” Database, November, 2025, https://fred.stlouisfed.org/series/MANEMP; The Employment Situation, January 1980 | FRASER | St. Louis Fed URL: https://fraser.stlouisfed.org/title/employment-situation-144/january-1980-56069?deep=true
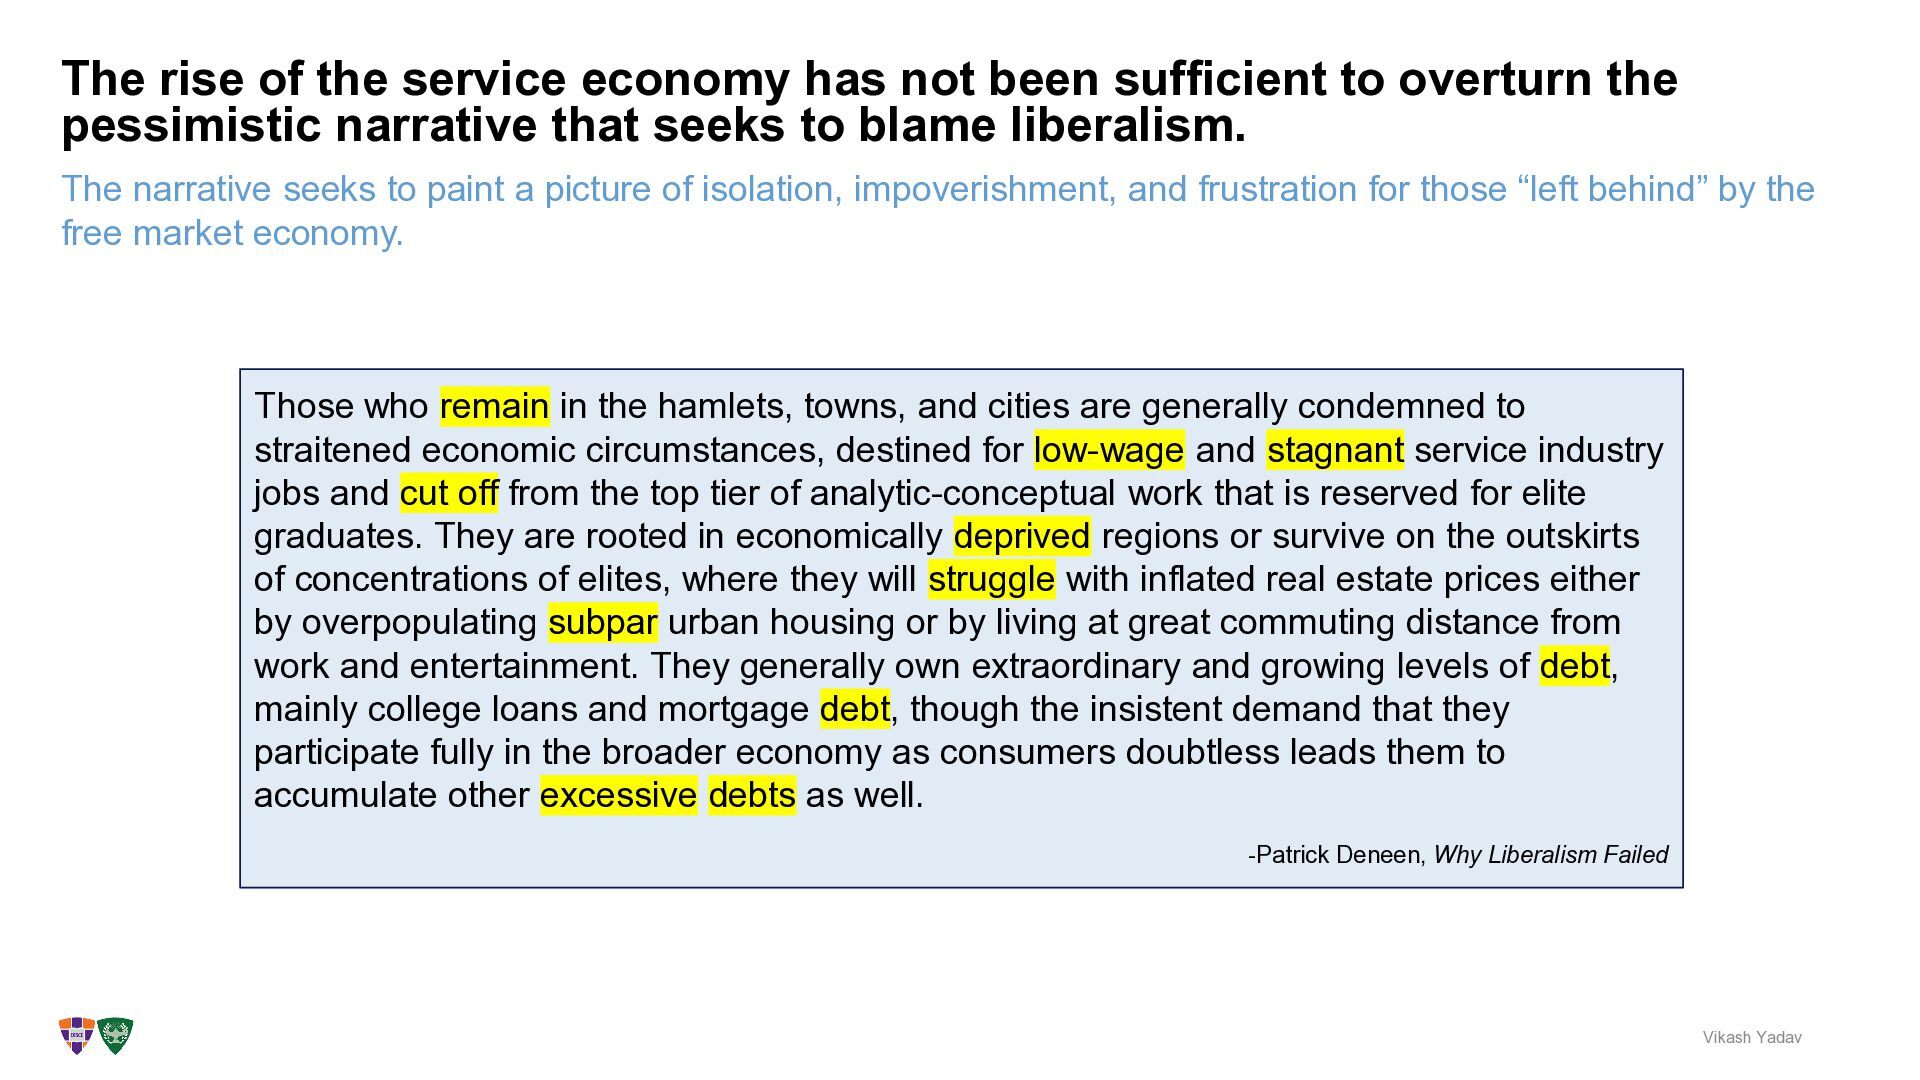
and frustration for those “left behind” by the free market economy. The rise of the service economy has not been sufficient to overturn the pessimistic narrative that seeks to blame liberalism. Vikash Yadav Those who remain in the hamlets, towns, and cities are generally condemned to straitened economic circumstances, destined for low-wage and stagnant service industry jobs and cut off from the top tier of analytic-conceptual work that is reserved for elite graduates. They are rooted in economically deprived regions or survive on the outskirts of concentrations of elites, where they will struggle with inflated real estate prices either by overpopulating subpar urban housing or by living at great commuting distance from work and entertainment. They generally own extraordinary and growing levels of debt, mainly college loans and mortgage debt, though the insistent demand that they participate fully in the broader economy as consumers doubtless leads them to accumulate other excessive debts as well. -Patrick Deneen, Why Liberalism Failed
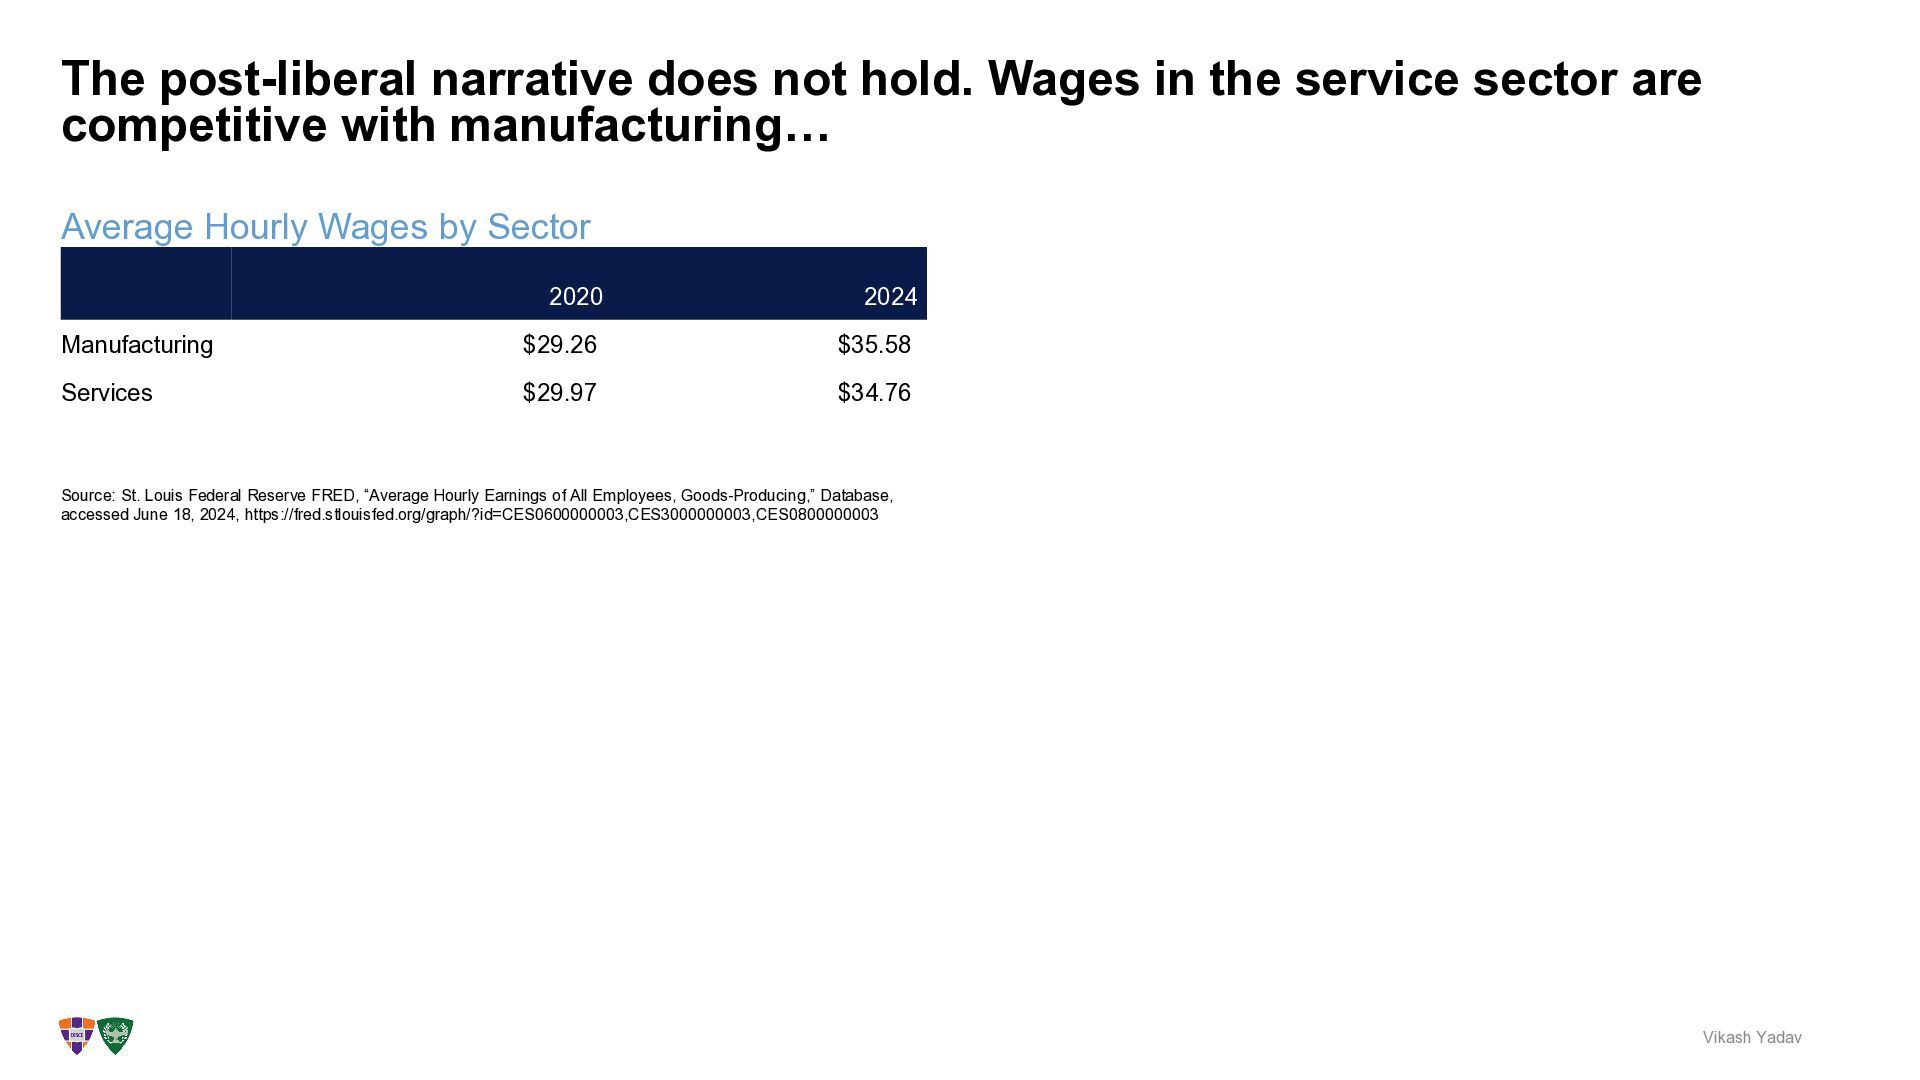
hold. Wages in the service sector are competitive with manufacturing… Vikash Yadav 2024 Manufacturing Services 2020 $29.97 $29.26 $34.76 $35.58 Source: St. Louis Federal Reserve FRED, “Average Hourly Earnings of All Employees, Goods-Producing,” Database, accessed June 18, 2024, https://fred.stlouisfed.org/graph/?id=CES0600000003,CES3000000003,CES0800000003
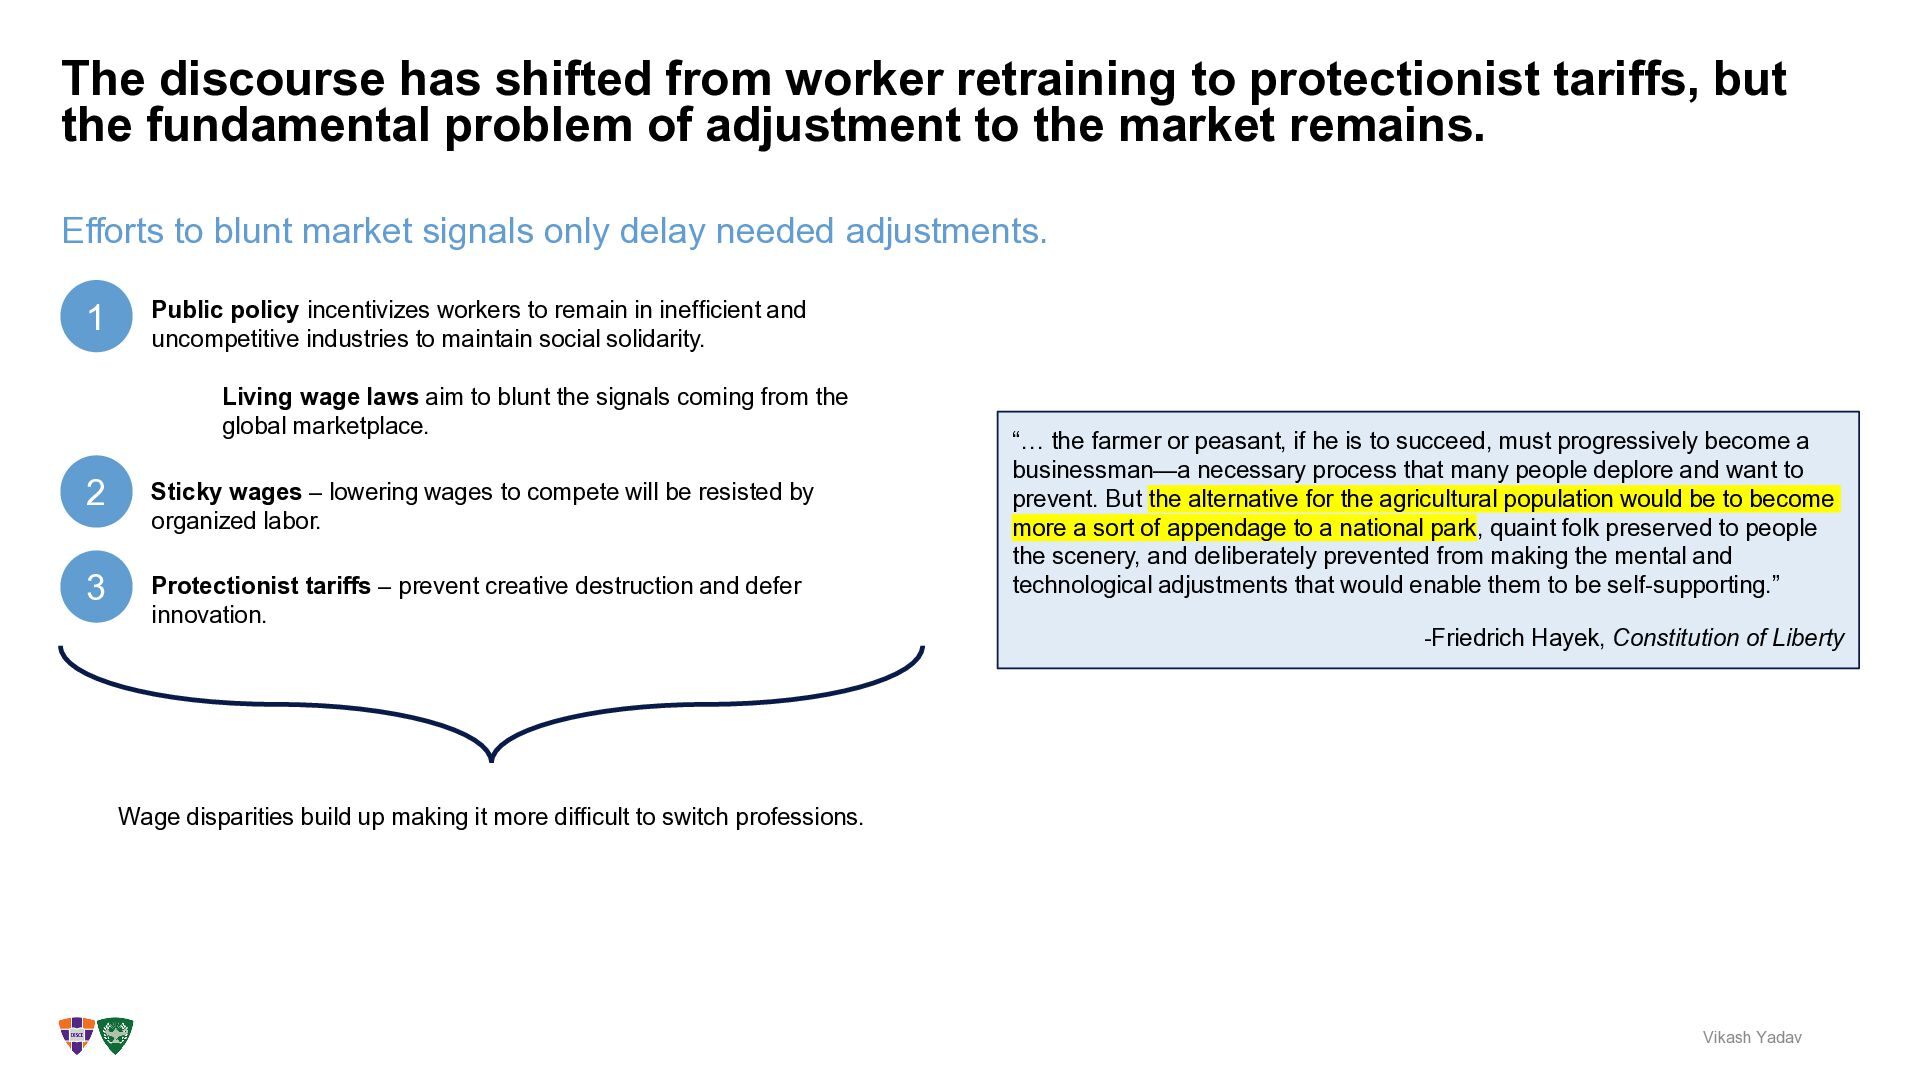
discourse has shifted from worker retraining to protectionist tariffs, but the fundamental problem of adjustment to the market remains. Vikash Yadav Sticky wages – lowering wages to compete will be resisted by organized labor. Living wage laws aim to blunt the signals coming from the global marketplace. Public policy incentivizes workers to remain in inefficient and uncompetitive industries to maintain social solidarity. “… the farmer or peasant, if he is to succeed, must progressively become a businessman—a necessary process that many people deplore and want to prevent. But the alternative for the agricultural population would be to become more a sort of appendage to a national park, quaint folk preserved to people the scenery, and deliberately prevented from making the mental and technological adjustments that would enable them to be self-supporting.” -Friedrich Hayek, Constitution of Liberty 1 2 3 Protectionist tariffs – prevent creative destruction and defer innovation. Wage disparities build up making it more difficult to switch professions.
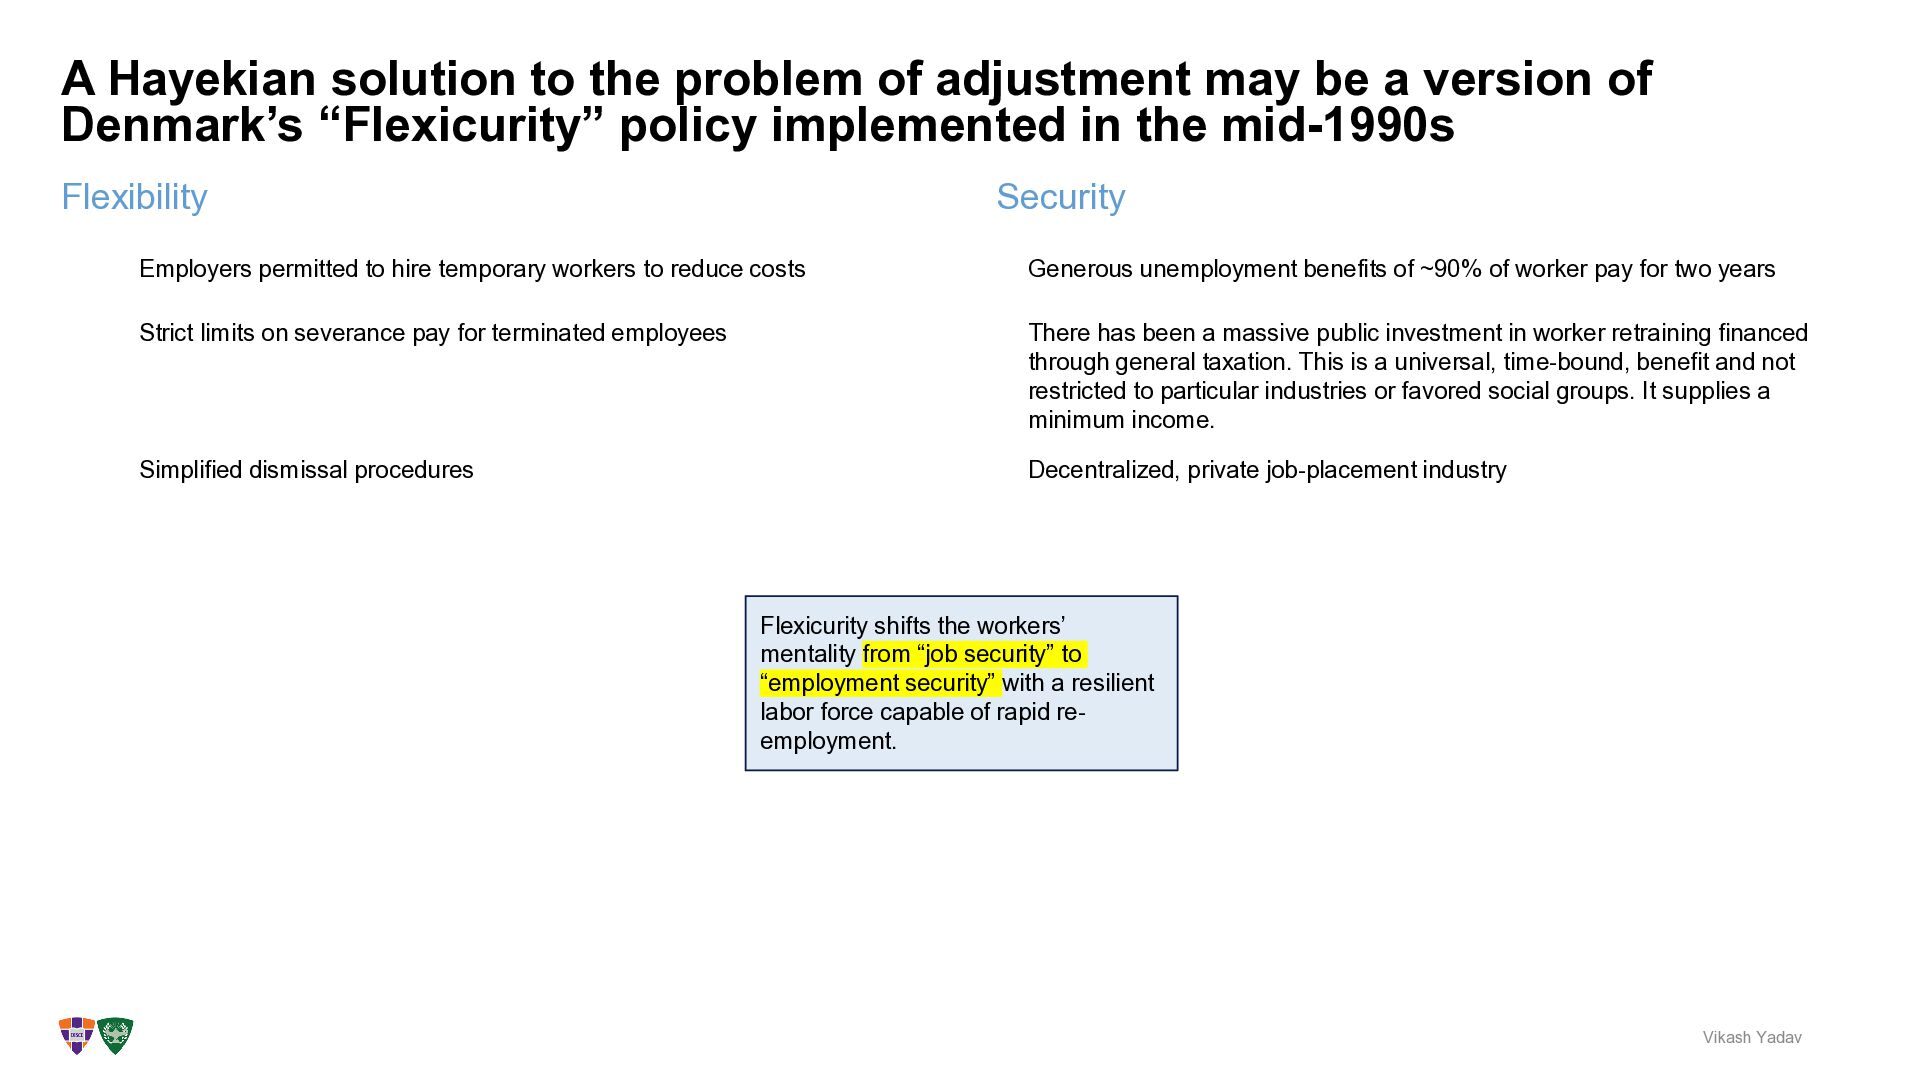
be a version of Denmark’s “Flexicurity” policy implemented in the mid-1990s Vikash Yadav Security Employers permitted to hire temporary workers to reduce costs Strict limits on severance pay for terminated employees Simplified dismissal procedures Generous unemployment benefits of ~90% of worker pay for two years There has been a massive public investment in worker retraining financed through general taxation. This is a universal, time-bound, benefit and not restricted to particular industries or favored social groups. It supplies a minimum income. Decentralized, private job-placement industry Flexicurity shifts the workers’ mentality from “job security” to “employment security” with a resilient labor force capable of rapid re- employment.
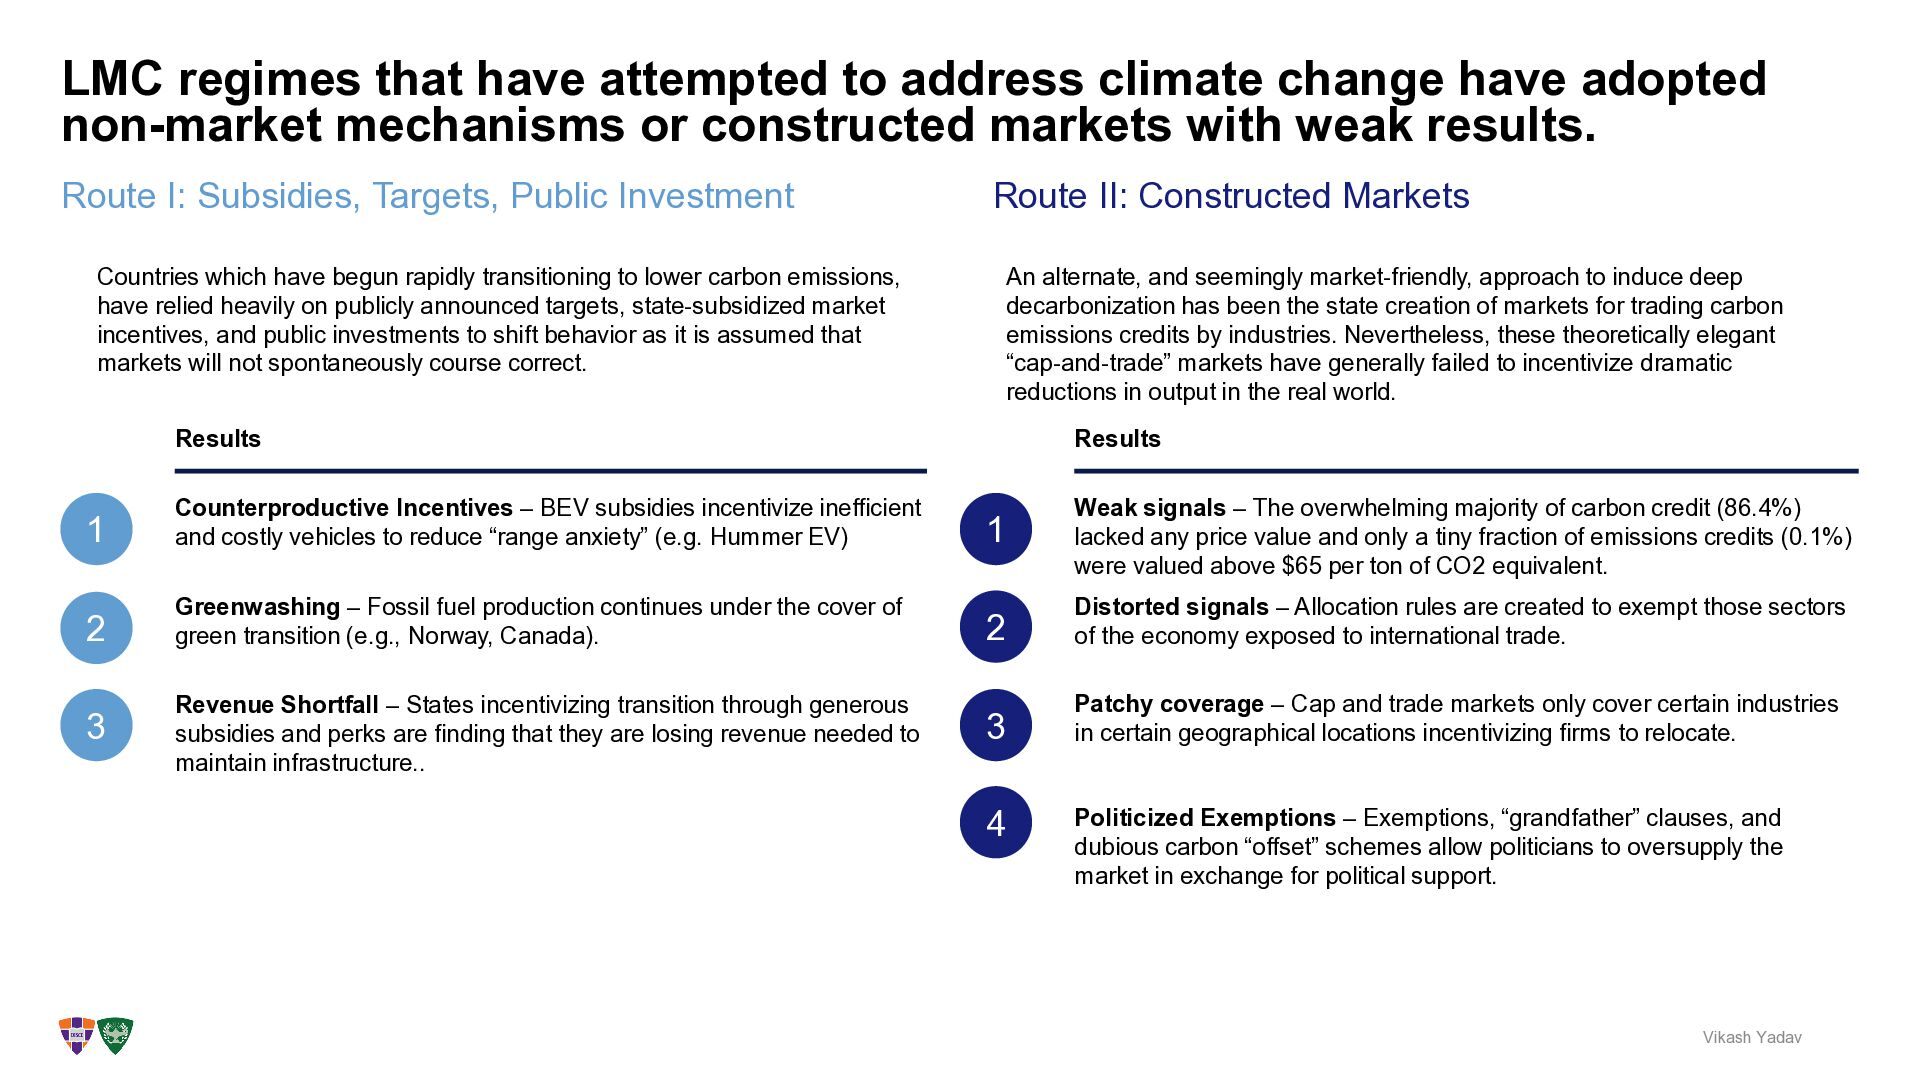
address climate change have adopted non-market mechanisms or constructed markets with weak results. Vikash Yadav Route I: Subsidies, Targets, Public Investment Countries which have begun rapidly transitioning to lower carbon emissions, have relied heavily on publicly announced targets, state-subsidized market incentives, and public investments to shift behavior as it is assumed that markets will not spontaneously course correct. Results Counterproductive Incentives – BEV subsidies incentivize inefficient and costly vehicles to reduce “range anxiety” (e.g. Hummer EV) Greenwashing – Fossil fuel production continues under the cover of green transition (e.g., Norway, Canada). Revenue Shortfall – States incentivizing transition through generous subsidies and perks are finding that they are losing revenue needed to maintain infrastructure.. 1 2 3 An alternate, and seemingly market-friendly, approach to induce deep decarbonization has been the state creation of markets for trading carbon emissions credits by industries. Nevertheless, these theoretically elegant “cap-and-trade” markets have generally failed to incentivize dramatic reductions in output in the real world. Results Weak signals – The overwhelming majority of carbon credit (86.4%) lacked any price value and only a tiny fraction of emissions credits (0.1%) were valued above $65 per ton of CO2 equivalent. 1 Distorted signals – Allocation rules are created to exempt those sectors of the economy exposed to international trade. 2 Patchy coverage – Cap and trade markets only cover certain industries in certain geographical locations incentivizing firms to relocate. 3 Politicized Exemptions – Exemptions, “grandfather” clauses, and dubious carbon “offset” schemes allow politicians to oversupply the market in exchange for political support. 4
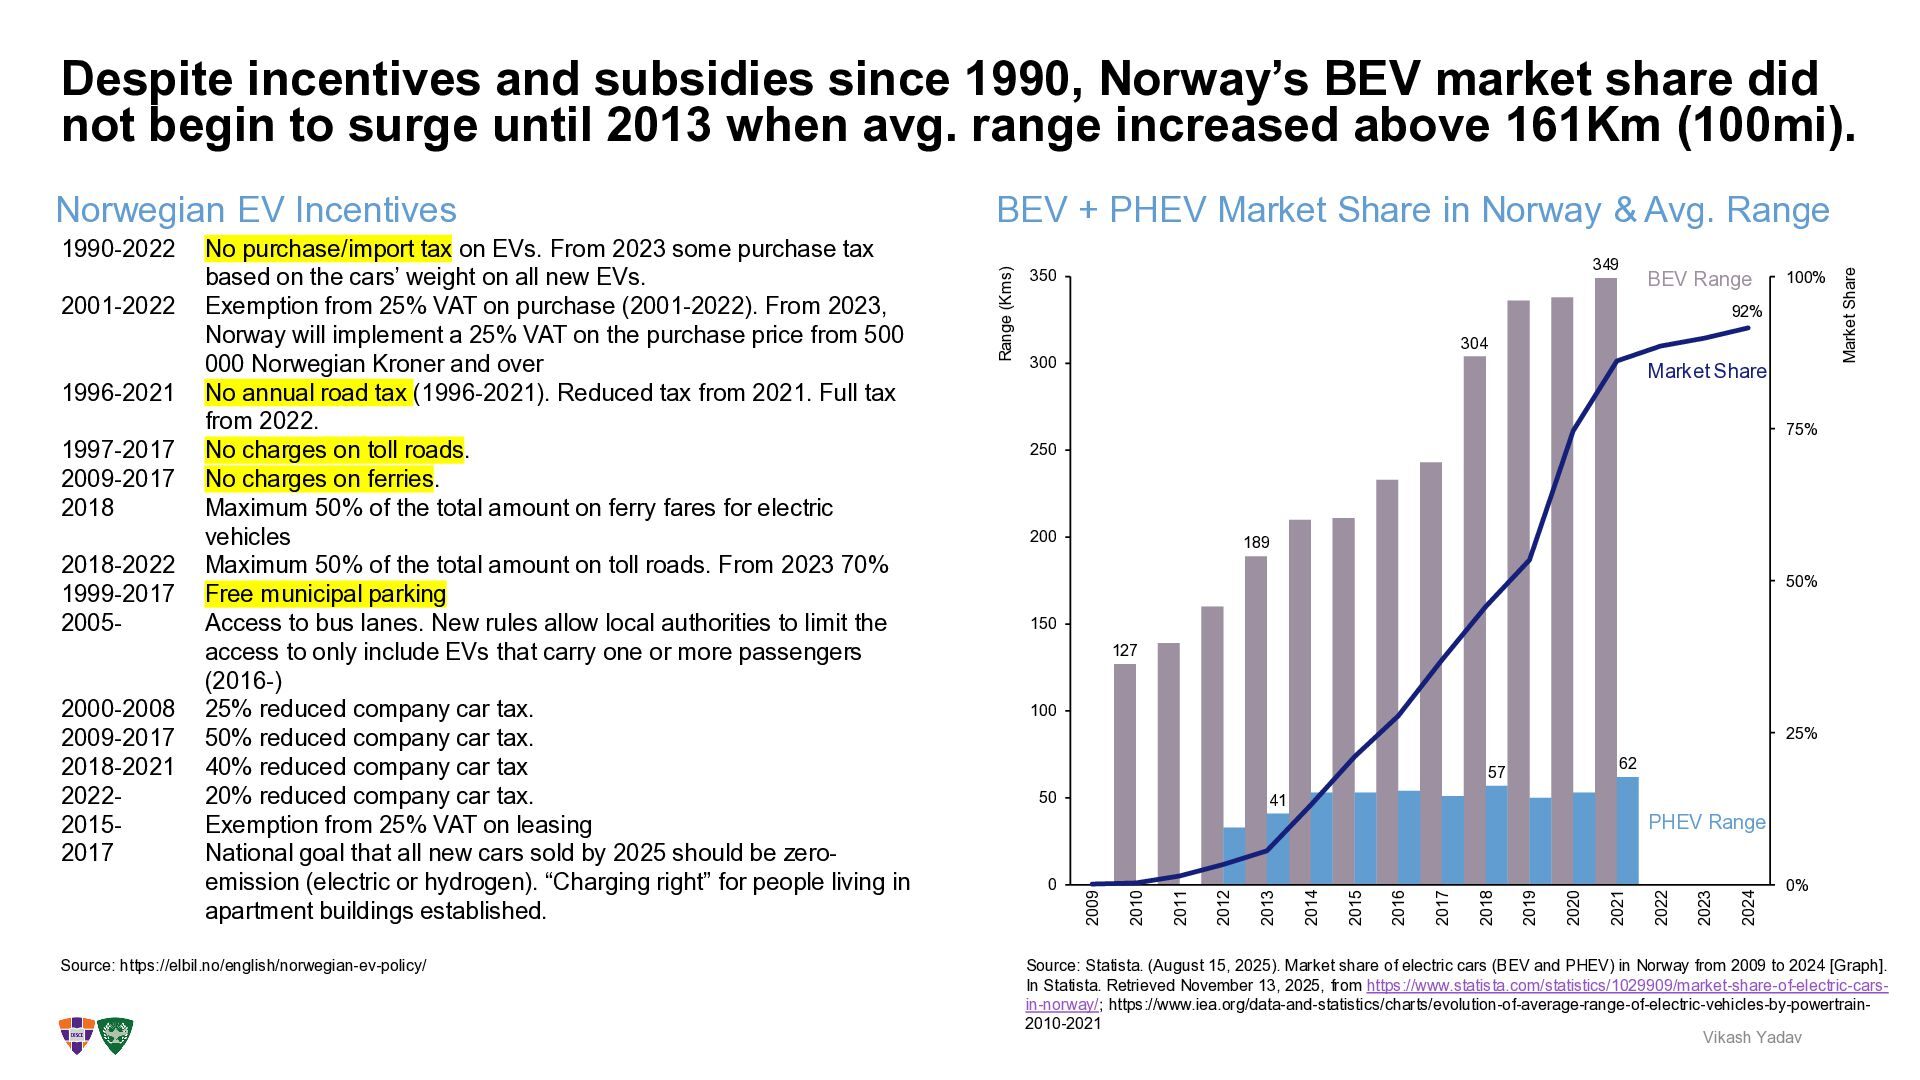
Despite incentives and subsidies since 1990, Norway’s BEV market share did not begin to surge until 2013 when avg. range increased above 161Km (100mi). Vikash Yadav Source: https://elbil.no/english/norwegian-ev-policy/ Norwegian EV Incentives 1990-2022 No purchase/import tax on EVs. From 2023 some purchase tax based on the cars’ weight on all new EVs. 2001-2022 Exemption from 25% VAT on purchase (2001-2022). From 2023, Norway will implement a 25% VAT on the purchase price from 500 000 Norwegian Kroner and over 1996-2021 No annual road tax (1996-2021). Reduced tax from 2021. Full tax from 2022. 1997-2017 No charges on toll roads. 2009-2017 No charges on ferries. 2018 Maximum 50% of the total amount on ferry fares for electric vehicles 2018-2022 Maximum 50% of the total amount on toll roads. From 2023 70% 1999-2017 Free municipal parking 2005- Access to bus lanes. New rules allow local authorities to limit the access to only include EVs that carry one or more passengers (2016-) 2000-2008 25% reduced company car tax. 2009-2017 50% reduced company car tax. 2018-2021 40% reduced company car tax 2022- 20% reduced company car tax. 2015- Exemption from 25% VAT on leasing 2017 National goal that all new cars sold by 2025 should be zero- emission (electric or hydrogen). “Charging right” for people living in apartment buildings established. Source: Statista. (August 15, 2025). Market share of electric cars (BEV and PHEV) in Norway from 2009 to 2024 [Graph]. In Statista. Retrieved November 13, 2025, from https://www.statista.com/statistics/1029909/market-share-of-electric-cars- in-norway/; https://www.iea.org/data-and-statistics/charts/evolution-of-average-range-of-electric-vehicles-by-powertrain- 2010-2021 127 189 304 349 41 57 62 0 50 100 150 200 250 300 350 0% 25% 50% 75% 100% Range (Kms) Market Share 2009 2010 2011 2012 2013 2014 2015 2016 2017 2018 2019 2020 2021 2022 2023 2024 92% PHEV Range Market Share BEV Range
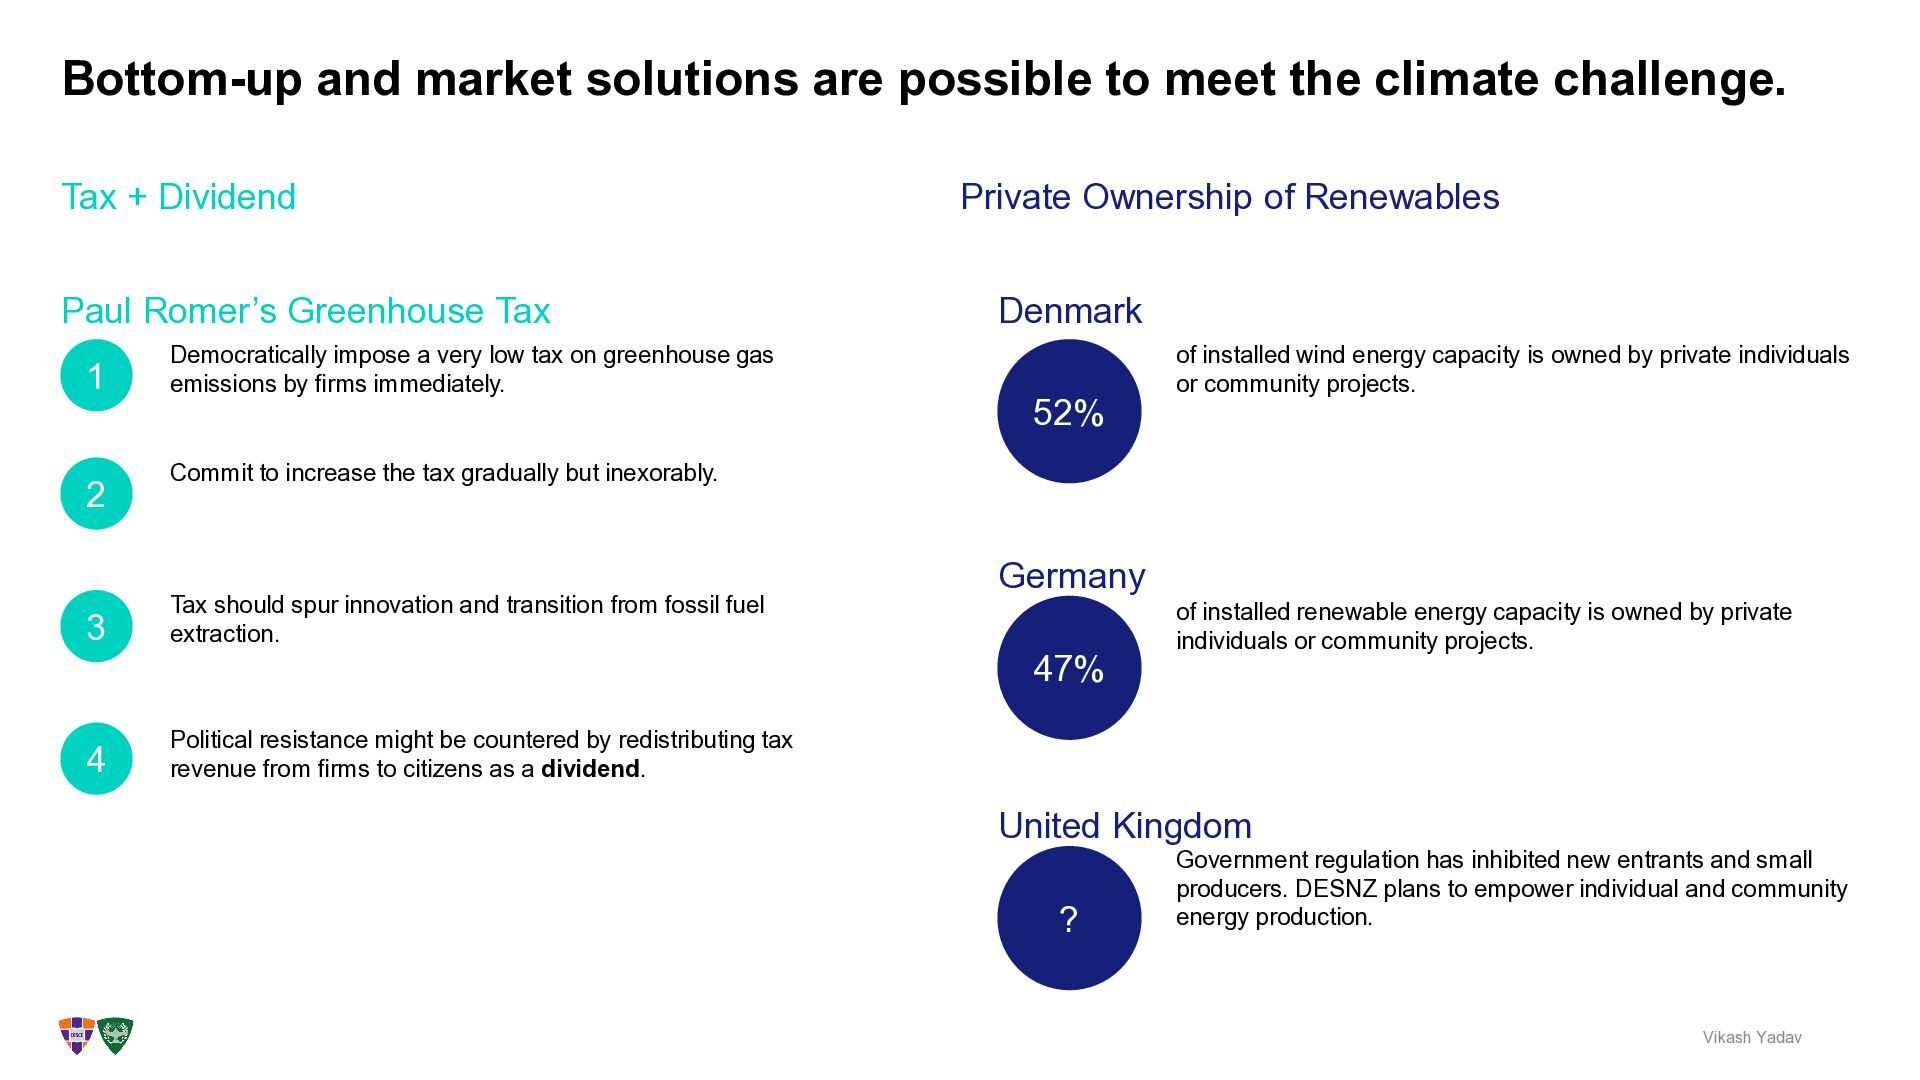
meet the climate challenge. Vikash Yadav of installed wind energy capacity is owned by private individuals or community projects. 52% Germany of installed renewable energy capacity is owned by private individuals or community projects. 47% Private Ownership of Renewables Denmark Democratically impose a very low tax on greenhouse gas emissions by firms immediately. Paul Romer’s Greenhouse Tax 1 Commit to increase the tax gradually but inexorably. 2 Political resistance might be countered by redistributing tax revenue from firms to citizens as a dividend. 4 3 Tax should spur innovation and transition from fossil fuel extraction. United Kingdom ? Government regulation has inhibited new entrants and small producers. DESNZ plans to empower individual and community energy production.