Upgrade to Pro
— share decks privately, control downloads, hide ads and more …
Speaker Deck
Features
Speaker Deck
PRO
Sign in
Sign up for free
Search
Search
opentelemetry-goとGCPでパフォーマンス解析
Search
Sponsored
·
SiteGround - Reliable hosting with speed, security, and support you can count on.
→
Yohei Iino
July 26, 2022
Technology
140
0
Share
opentelemetry-goとGCPでパフォーマンス解析
opentelemetry-goとGCPでパフォーマンス解析
Yohei Iino
July 26, 2022
More Decks by Yohei Iino
See All by Yohei Iino
1年半放置したExpo製アプリを最新化してみた
wheatandcat
0
100
作成中のFlutterアプリの中間発表
wheatandcat
0
82
最近読んだ技術書を簡単紹介
wheatandcat
0
110
ユニバーサルリンク/アプリリンクを使ってQRコードでゲストログインできるようにする
wheatandcat
0
370
Firebase App Checkを実装したので紹介
wheatandcat
0
290
PlanetScaleの無料プランがなくなるので、NeonとTiDBを試してみた
wheatandcat
0
400
Flutter HooksとRiverpodの解説
wheatandcat
0
570
T3 Stack(応用編: Next Auth & SSRの実装紹介)
wheatandcat
1
400
App Routerの紹介
wheatandcat
0
150
Other Decks in Technology
See All in Technology
2026.06.13_AI時代に事業会社が「SIer出身エンジニア」を求める理由 / Why Businesses Seek Engineers with a System Integrator Background in the AI Era
jumtech
0
470
ChatworkとBPaaS 異なる特性で学んだAI機能開発の ベストプラクティス
kubell_hr
2
2.7k
サイバーセキュリティ概論 / Introduction to Cybersecurity
ks91
PRO
0
150
Oracle AI Database@Google Cloud:サービス概要のご紹介
oracle4engineer
PRO
6
1.5k
AI フレンドリーなエラー監視を TypeScript で実現する
shinyaigeek
2
250
【Gen-AX】20260530開催_JJUG CCC 2026 Spring
genax
0
420
個人最適 から 全体最適 へ AI情報共有会・AIギルド・AI-DLC で進める カンリーの組織展開
rfdnxbro
0
1.5k
AI Testing Talks: Challenges of Applying AI in Software Testing: From Hype to Practical Use
exactpro
PRO
1
130
正解のないAIプロダクトをどう導くか?dodaが挑む、ユーザーの『本音』を構造化する評価設計と検証のリアル
techtekt
PRO
0
180
Oracle AI Database@Azure:サービス概要のご紹介
oracle4engineer
PRO
6
1.9k
「気づいたら仕事が終わっている」バクラクAIエージェント本番運用の裏側 / layerx-bakuraku-aie2026
yuya4
18
10k
AI Adaptable なテストを整える工夫 / Ways to Make Your Tests AI-Adaptable
bitkey
PRO
3
210
Featured
See All Featured
ReactJS: Keep Simple. Everything can be a component!
pedronauck
666
130k
End of SEO as We Know It (SMX Advanced Version)
ipullrank
3
4.2k
Self-Hosted WebAssembly Runtime for Runtime-Neutral Checkpoint/Restore in Edge–Cloud Continuum
chikuwait
0
560
svc-hook: hooking system calls on ARM64 by binary rewriting
retrage
2
290
VelocityConf: Rendering Performance Case Studies
addyosmani
333
25k
KATA
mclloyd
PRO
35
15k
Accessibility Awareness
sabderemane
1
130
Why You Should Never Use an ORM
jnunemaker
PRO
61
9.9k
Navigating the Design Leadership Dip - Product Design Week Design Leaders+ Conference 2024
apolaine
1
340
How to train your dragon (web standard)
notwaldorf
97
6.7k
Everyday Curiosity
cassininazir
0
220
Impact Scores and Hybrid Strategies: The future of link building
tamaranovitovic
0
300
Transcript
opentelemetry-go とGCP でパフォーマンス解析 Press Space for next page
自己紹介 📝 飯野陽平(wheatandcat ) 🏢 フリーランスエンジニア(シェアフル株式会社CTO ) 💻 Blog: https://www.wheatandcat.me/
🛠 今までに作ったもの memoir ペペロミア Atomic Design Check List
OpenTelemetry とは OpenTelemetry は、オープンソースのオブザーバビリティフレームワーク 運用しているアプリのパフォーマンスや健全性が正常な状態か判断するために使用する情報をテレメトリーデータ と呼ばれている テレメトリーデータは主に3 つのカテゴリに分類される ログ メトリクス
トレース OpenTelemetry は、それらのテレメトリデータを収集するためのベンダーに依存しないAPI 、ソフトウェア開発キッ ト(SDK) 、その他のツールを提供している Learn More 1 Learn More 2
opentelemetry-go リポジトリ: opentelemetry-go OpenTelemetry は、OpenCensus (+ Stackdriver )、OpenTracing のプロジェクトの正式な後継版 検索時に以下のリポジトリで実装されたものもヒットするが、これから実装するならopentelemetry-go
が推奨なの で注意 opencensus-go opentracing-go
対応のパッケージのサンプル OpenTelemetry のGitHub に言語ごとにリポジトリが作成されている https://github.com/open-telemetry?q=go&type=all&language=&sort= Go 言語なら以下を確認 opentelemetry-go-contrib Go のフレームワークなら以下を確認
https://github.com/open-telemetry/opentelemetry-go-contrib/tree/main/instrumentation/github.com
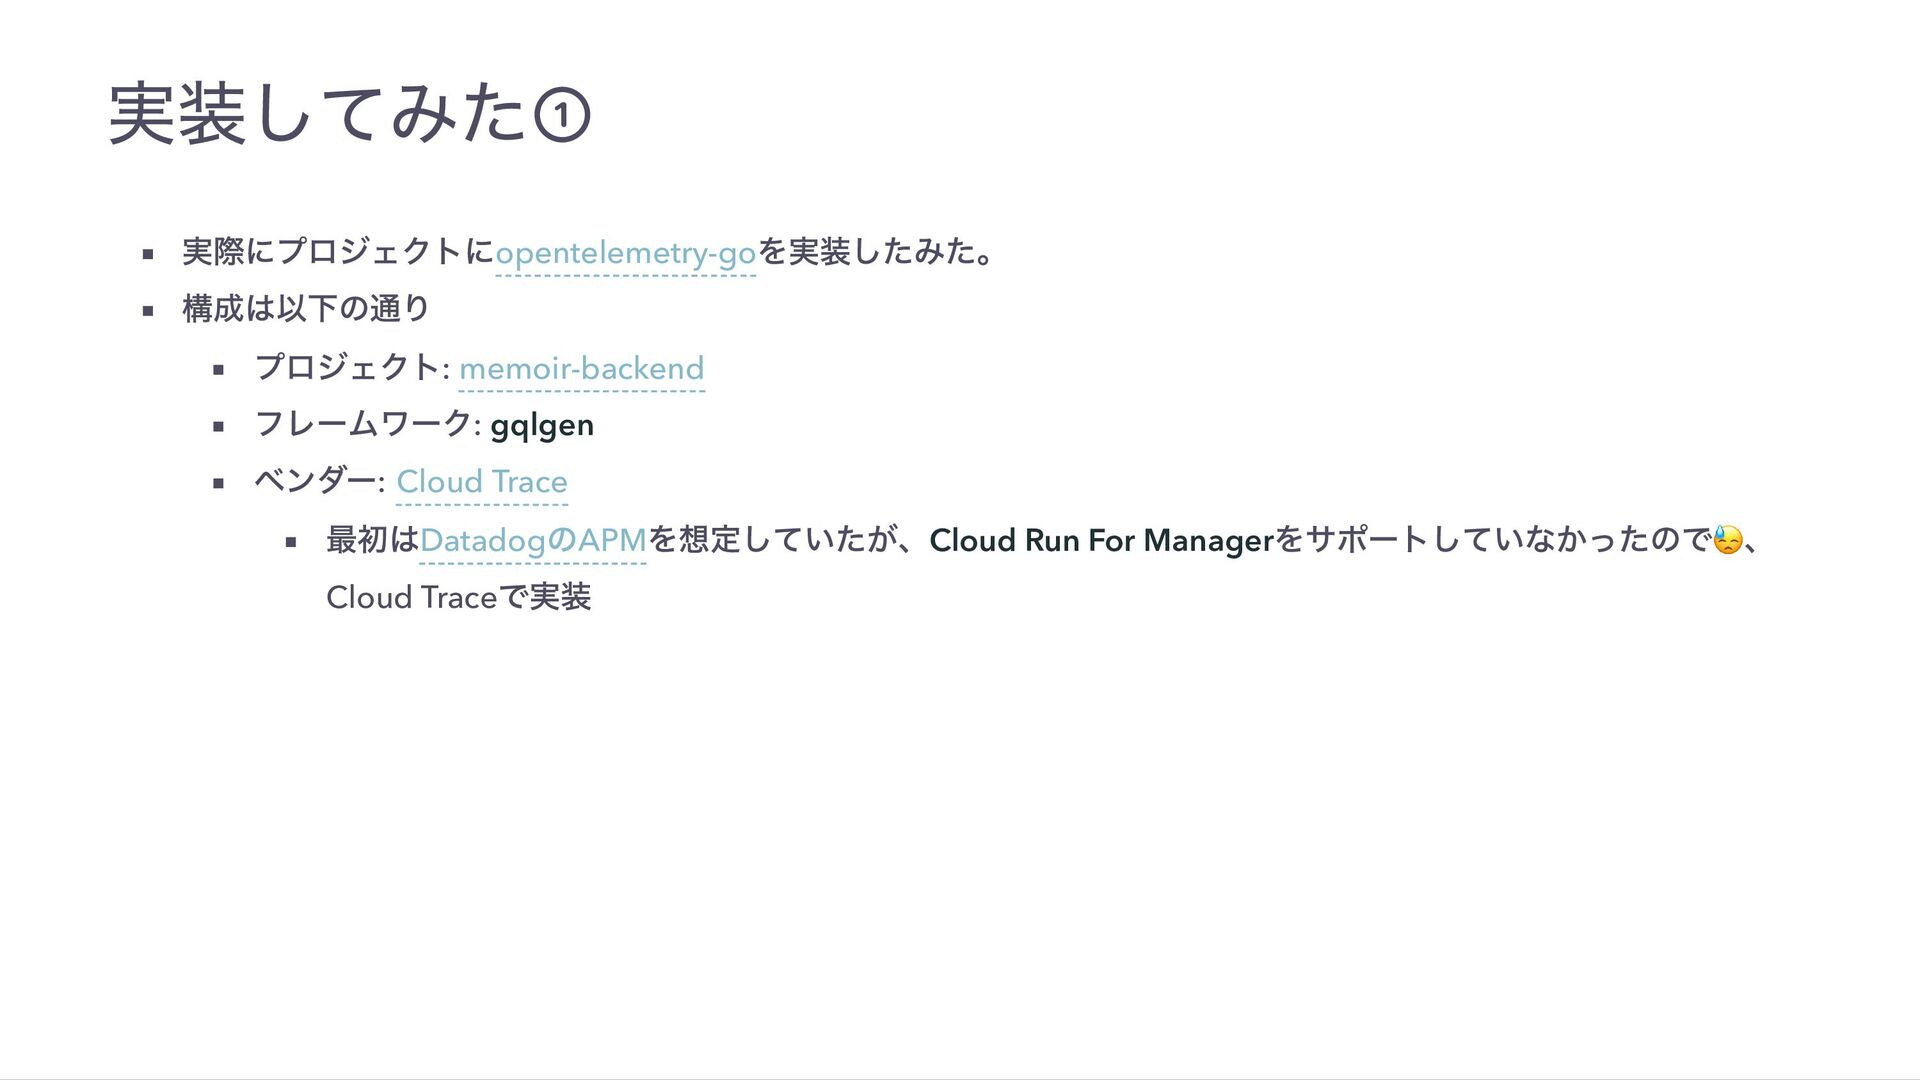
実装してみた① 実際にプロジェクトにopentelemetry-go を実装したみた。 構成は以下の通り プロジェクト: memoir-backend フレームワーク: gqlgen ベンダー: Cloud
Trace 最初はDatadog のAPM を想定していたが、Cloud Run For Manager をサポートしていなかったので😓、 Cloud Trace で実装
実装してみた② PR https://github.com/wheatandcat/memoir-backend/pull/128 以下を解説 gqlgen のトレースのハンドリングの解説 Cloud Trace の出力のデモ
Cloud Trace を実装してみての感想と課題 トレース情報が可視化されて、各 API の処理速度を直感的にわかるようになった 今回のプロジェクトはAPI の数も少ないのでトレース情報のみでも十分に解析可能だが、以下のようなケースでは別 のアプローチを考える必要がある トレース情報が大雑把すぎる。具体的に遅い処理を検知したい
API や処理数が膨大で漠然と全体的に遅い ユーザーによって処理が遅い 上記のケースではCloud Profiler が有効なので紹介
Cloud Profiler とは Cloud Profiler は、本番環境のアプリケーションからCPU 使用率やメモリ割り当てなどの情報を継続的に収集できる サービス トレースのような大雑把な情報は出力できないが、ピンポイントにボトルネックになっている処理の検知が行える 料金は無料なので、取り敢えず実装しておいても損は無さそう
Learn More
実装してみた 以下を参考に実装 https://cloud.google.com/profiler/docs/profiling-go?hl=ja 以下を解説 Cloud Profiler のデモ memoir-backend は処理がシンプル過ぎて、解説向きの情報が無いので以下で解説 以下を参考に実際の利用方法の解説
チュートリアル: Go アプリの最適化
おまけ 今回、実装までは行わなかったが、今回紹介したCloud Trace とCloud Profiler などの情報をまとめて、Cloud Monitoring でアラートもできそう https://cloud.google.com/architecture/integrating-monitoring-logging-trace-observability-and-alerting? hl=ja
Cloud Monitoring の説明は以下を参照 https://cloud.google.com/monitoring/monitor-compute-engine-virtual-machine
まとめ OpenTelemetry は現状デファクトなので、理解しておいたほうが良さそう パフォーマンス解析のアプローチについて理解できた 早くDatadog のAPM がCloud Run For Manager
をサポートして欲しい GKE 構成にすれば使えるけど、個人プロジェクトで、そこまで管理コストをかけたくない 😓
ご清聴ありがとうございました