Upgrade to Pro — share decks privately, control downloads, hide ads and more …

Computational Biology of PIP3 signalling

Vladimir Kiselev
September 23, 2013

Computational Biology of PIP3 signalling

Presentation given at the department seminar in the Babraham Institute, Cambridge, UK

http://github.com/wikiselev/department-seminar

Vladimir Kiselev

September 23, 2013
Tweet

More Decks by Vladimir Kiselev

Other Decks in Science

Transcript

  1. Background System Biology Modeling Gene Expression Analysis Acknowledgments Computational Biology

    of PIP3 signalling Vladimir Kiselev LeNovere Group — Babraham Institute Signaling ISP Seminar, September 2013 Vladimir Kiselev Computational Biology of PIP3 signalling
  2. Background System Biology Modeling Gene Expression Analysis Acknowledgments 1 Background

    PI3K signaling pathway Phosphoinositides Systems Biology 2 System Biology Modeling Overview Our Model Predictions 3 Gene Expression Analysis RNA-seq Our Data Preliminary Analysis Time-Course Analysis 4 Acknowledgments Vladimir Kiselev Computational Biology of PIP3 signalling
  3. Background System Biology Modeling Gene Expression Analysis Acknowledgments PI3K signaling

    pathway Phosphoinositides Systems Biology 1 Background PI3K signaling pathway Phosphoinositides Systems Biology 2 System Biology Modeling Overview Our Model Predictions 3 Gene Expression Analysis RNA-seq Our Data Preliminary Analysis Time-Course Analysis 4 Acknowledgments Vladimir Kiselev Computational Biology of PIP3 signalling
  4. Background System Biology Modeling Gene Expression Analysis Acknowledgments PI3K signaling

    pathway Phosphoinositides Systems Biology General View Vladimir Kiselev Computational Biology of PIP3 signalling
  5. Background System Biology Modeling Gene Expression Analysis Acknowledgments PI3K signaling

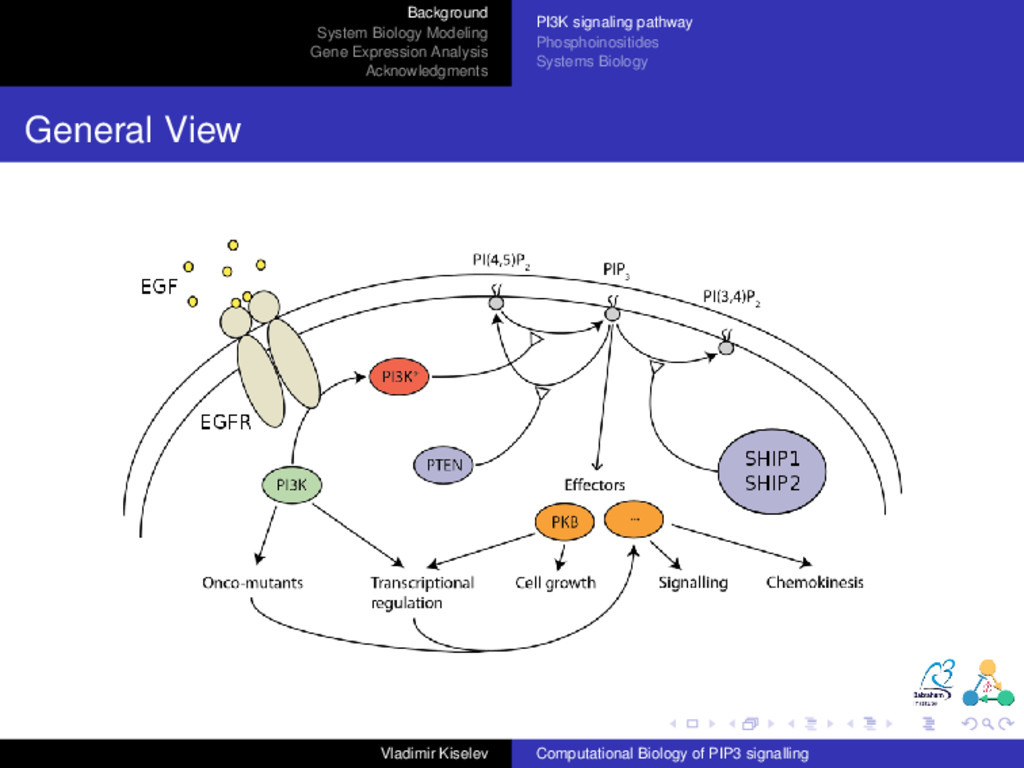
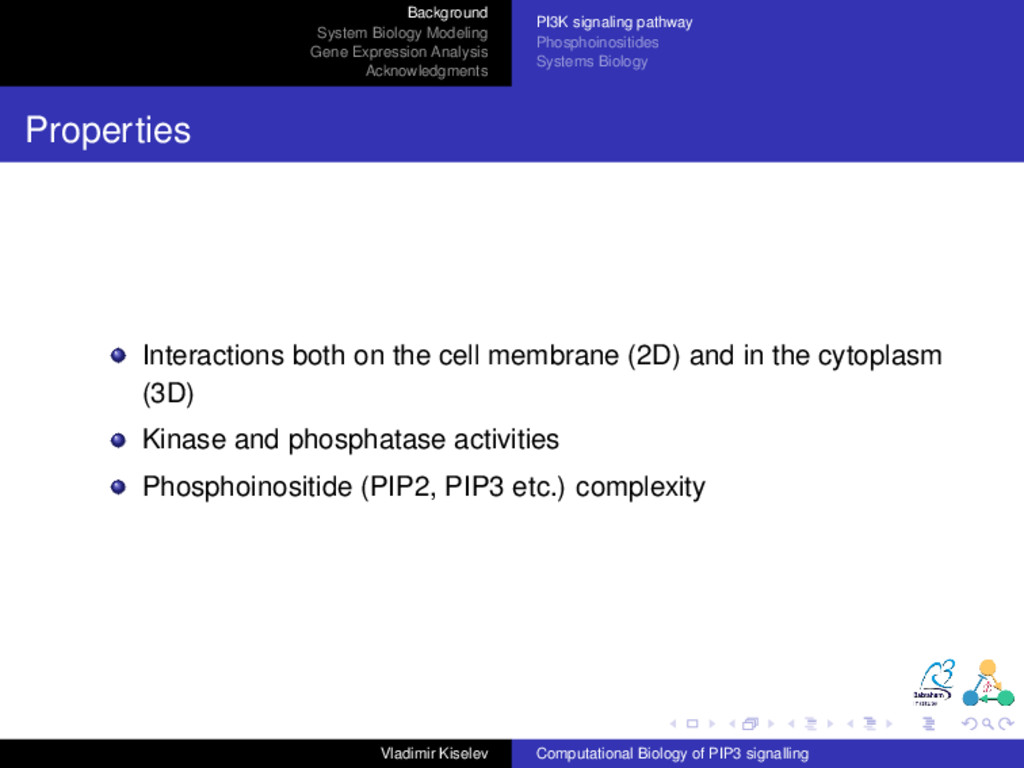
    pathway Phosphoinositides Systems Biology Properties Interactions both on the cell membrane (2D) and in the cytoplasm (3D) Kinase and phosphatase activities Phosphoinositide (PIP2, PIP3 etc.) complexity Vladimir Kiselev Computational Biology of PIP3 signalling
  6. Background System Biology Modeling Gene Expression Analysis Acknowledgments PI3K signaling

    pathway Phosphoinositides Systems Biology 1 Background PI3K signaling pathway Phosphoinositides Systems Biology 2 System Biology Modeling Overview Our Model Predictions 3 Gene Expression Analysis RNA-seq Our Data Preliminary Analysis Time-Course Analysis 4 Acknowledgments Vladimir Kiselev Computational Biology of PIP3 signalling
  7. Background System Biology Modeling Gene Expression Analysis Acknowledgments PI3K signaling

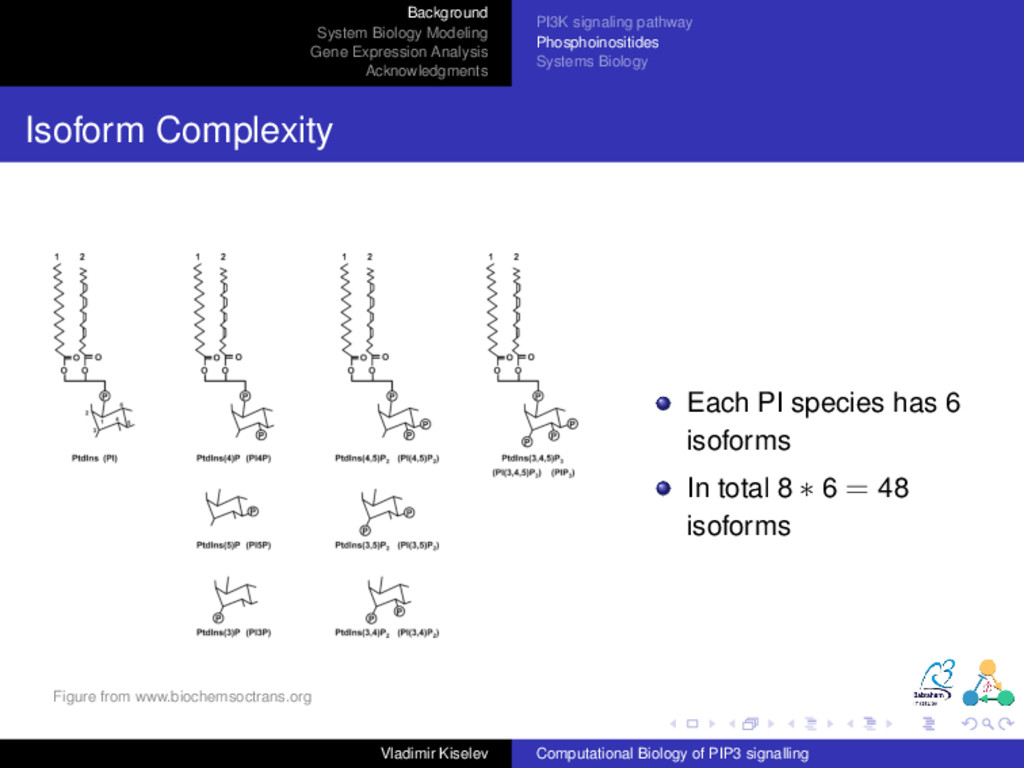
    pathway Phosphoinositides Systems Biology Isoform Complexity Figure from www.biochemsoctrans.org Each PI species has 6 isoforms In total 8 ∗ 6 = 48 isoforms Vladimir Kiselev Computational Biology of PIP3 signalling
  8. Background System Biology Modeling Gene Expression Analysis Acknowledgments PI3K signaling

    pathway Phosphoinositides Systems Biology Conversion Complexity                               Vladimir Kiselev Computational Biology of PIP3 signalling
  9. Background System Biology Modeling Gene Expression Analysis Acknowledgments PI3K signaling

    pathway Phosphoinositides Systems Biology 1 Background PI3K signaling pathway Phosphoinositides Systems Biology 2 System Biology Modeling Overview Our Model Predictions 3 Gene Expression Analysis RNA-seq Our Data Preliminary Analysis Time-Course Analysis 4 Acknowledgments Vladimir Kiselev Computational Biology of PIP3 signalling
  10. Background System Biology Modeling Gene Expression Analysis Acknowledgments PI3K signaling

    pathway Phosphoinositides Systems Biology Computational Modeling Has been widely used in different biological disciplines Has been proved to be robust and reliable Helps tackling the complexity problem Vladimir Kiselev Computational Biology of PIP3 signalling
  11. Background System Biology Modeling Gene Expression Analysis Acknowledgments Overview Our

    Model Predictions 1 Background PI3K signaling pathway Phosphoinositides Systems Biology 2 System Biology Modeling Overview Our Model Predictions 3 Gene Expression Analysis RNA-seq Our Data Preliminary Analysis Time-Course Analysis 4 Acknowledgments Vladimir Kiselev Computational Biology of PIP3 signalling
  12. Background System Biology Modeling Gene Expression Analysis Acknowledgments Overview Our

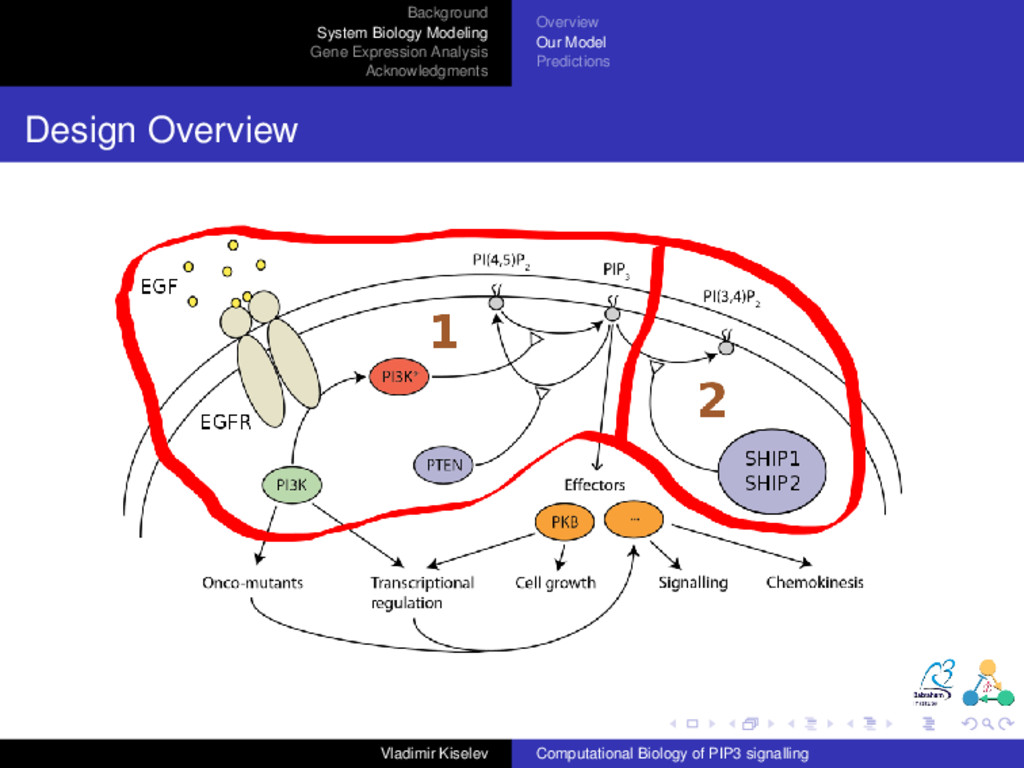
    Model Predictions Kinetic Modeling Deterministic – use a set of ODE to describe evolution of the system Assuming that the system is well stirred and spatially homogeneous Stochastic – more general approach directly taking into account system fluctuations Is required when number of particles in the systems is small Others (e.g. Rule Based Modeling) Vladimir Kiselev Computational Biology of PIP3 signalling
  13. Background System Biology Modeling Gene Expression Analysis Acknowledgments Overview Our

    Model Predictions 1 Background PI3K signaling pathway Phosphoinositides Systems Biology 2 System Biology Modeling Overview Our Model Predictions 3 Gene Expression Analysis RNA-seq Our Data Preliminary Analysis Time-Course Analysis 4 Acknowledgments Vladimir Kiselev Computational Biology of PIP3 signalling
  14. Background System Biology Modeling Gene Expression Analysis Acknowledgments Overview Our

    Model Predictions Design Overview Vladimir Kiselev Computational Biology of PIP3 signalling
  15. Background System Biology Modeling Gene Expression Analysis Acknowledgments Overview Our

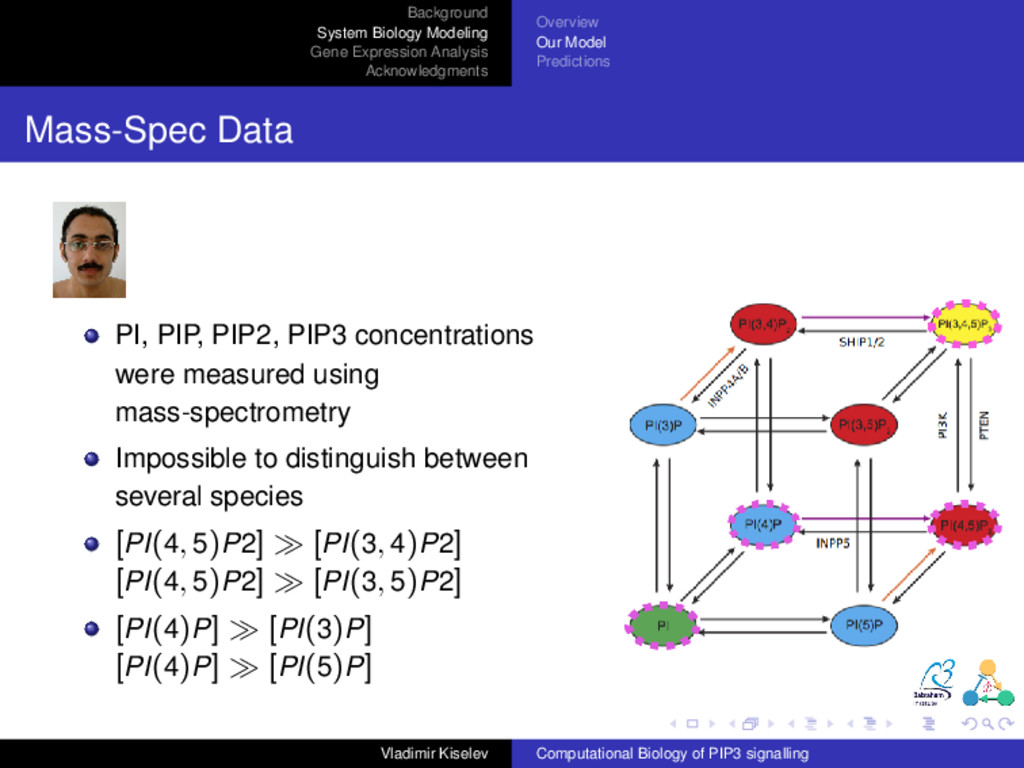
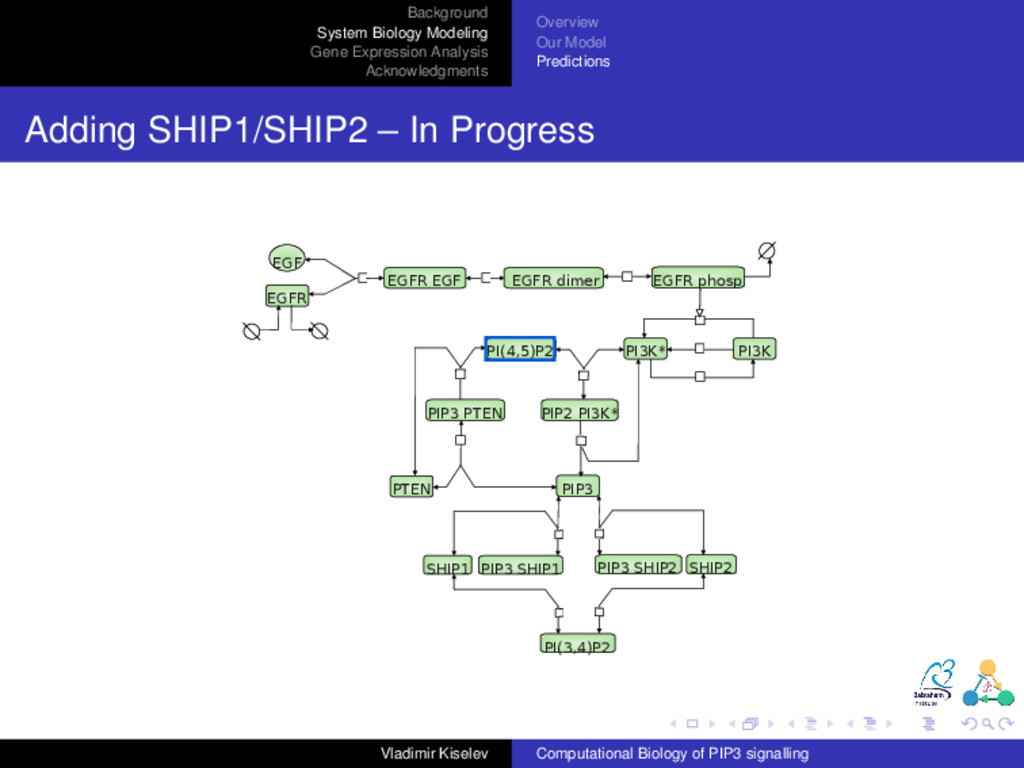
    Model Predictions Mass-Spec Data PI, PIP, PIP2, PIP3 concentrations were measured using mass-spectrometry Impossible to distinguish between several species [PI(4, 5)P2] [PI(3, 4)P2] [PI(4, 5)P2] [PI(3, 5)P2] [PI(4)P] [PI(3)P] [PI(4)P] [PI(5)P] Vladimir Kiselev Computational Biology of PIP3 signalling
  16. Background System Biology Modeling Gene Expression Analysis Acknowledgments Overview Our

    Model Predictions Design 1 – without PI(3,4)P2 EGF EGFR EGFR EGF EGFR dimer EGFR phosp. PI3K* PI3K PIP2 PI3K* PIP2 PIP3 PTEN PIP3 PTEN Vladimir Kiselev Computational Biology of PIP3 signalling
  17. Background System Biology Modeling Gene Expression Analysis Acknowledgments Overview Our

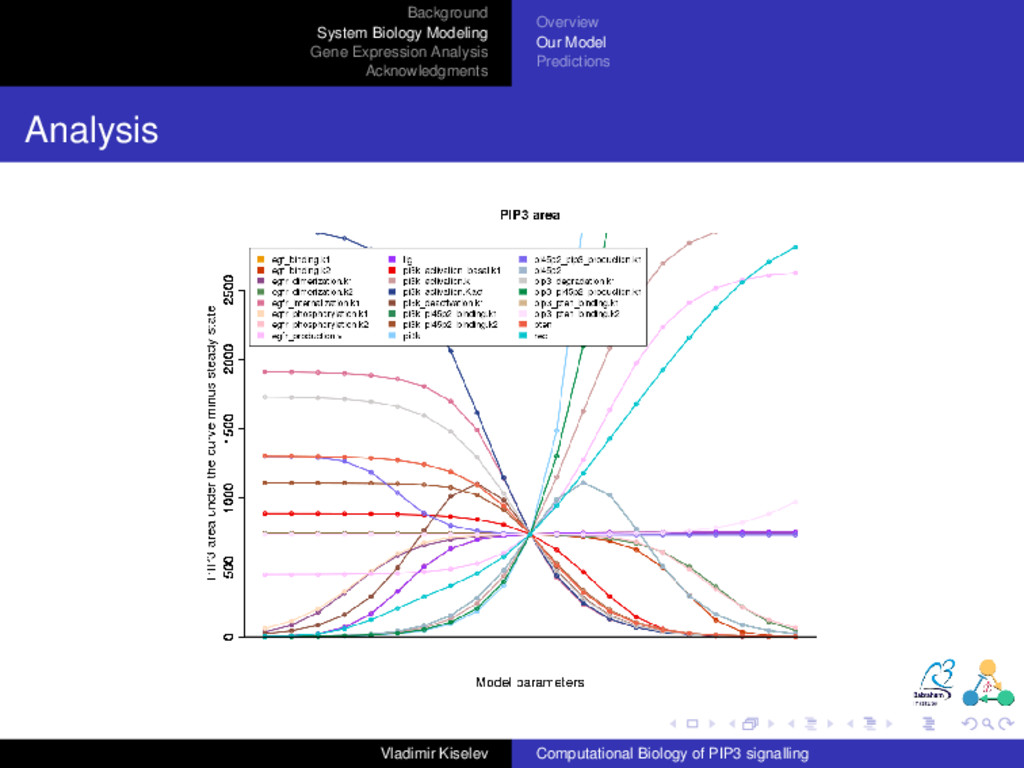
    Model Predictions Analysis Figure 4: Area under PIP3 curve minus steady state level. Model is more sensitive to parameters which curve goes higher (or lower) towards left or right Vladimir Kiselev Computational Biology of PIP3 signalling
  18. Background System Biology Modeling Gene Expression Analysis Acknowledgments Overview Our

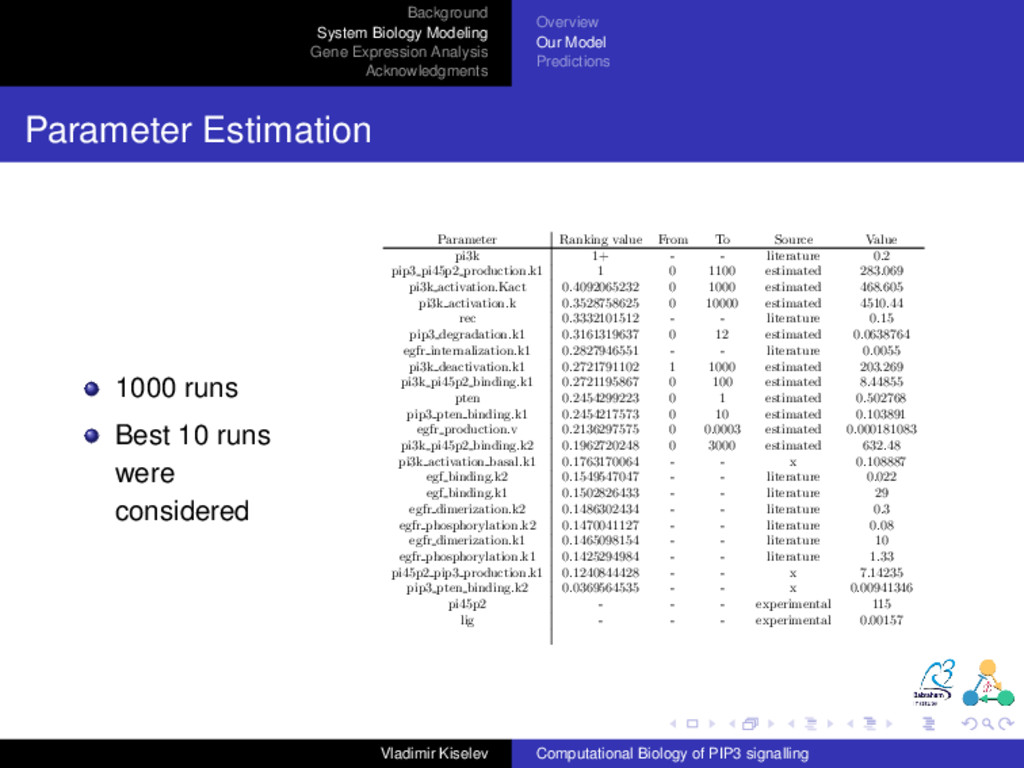
    Model Predictions Parameter Estimation 1000 runs Best 10 runs were considered mutant, but also an artificial experiment which was used to set steady state levels of PIP3 to their values. Otherwise, steady state level of PIP3 would be much higher or lower than zero-time experimental points in WT and PTEN experiments. Set of parameters that gives the best objective value, the best fit for experi- mental values, is given in Table 1, together with sensitivity analysis results; the fit is shown in Fig. 6. Summary of the best three sets of parameters (the one from Table 1, and two other sets which give very similiar objective values) is given in Table 2. The first two sets are somewhat similiar, but the third one di↵ers greatly in two parameters, which hit their upper boundary. Only the best set of parameters is kept and used later. Parameter Ranking value From To Source Value pi3k 1+ - - literature 0.2 pip3 pi45p2 production.k1 1 0 1100 estimated 283.069 pi3k activation.Kact 0.4092065232 0 1000 estimated 468.605 pi3k activation.k 0.3528758625 0 10000 estimated 4510.44 rec 0.3332101512 - - literature 0.15 pip3 degradation.k1 0.3161319637 0 12 estimated 0.0638764 egfr internalization.k1 0.2827946551 - - literature 0.0055 pi3k deactivation.k1 0.2721791102 1 1000 estimated 203.269 pi3k pi45p2 binding.k1 0.2721195867 0 100 estimated 8.44855 pten 0.2454299223 0 1 estimated 0.502768 pip3 pten binding.k1 0.2454217573 0 10 estimated 0.103891 egfr production.v 0.2136297575 0 0.0003 estimated 0.000181083 pi3k pi45p2 binding.k2 0.1962720248 0 3000 estimated 632.48 pi3k activation basal.k1 0.1763170064 - - x 0.108887 egf binding.k2 0.1549547047 - - literature 0.022 egf binding.k1 0.1502826433 - - literature 29 egfr dimerization.k2 0.1486302434 - - literature 0.3 egfr phosphorylation.k2 0.1470041127 - - literature 0.08 egfr dimerization.k1 0.1465098154 - - literature 10 egfr phosphorylation.k1 0.1425294984 - - literature 1.33 pi45p2 pip3 production.k1 0.1240844428 - - x 7.14235 pip3 pten binding.k2 0.0369564535 - - x 0.00941346 pi45p2 - - - experimental 115 lig - - - experimental 0.00157 Table 1: Parameters: ranking, intervals, final values 6 Vladimir Kiselev Computational Biology of PIP3 signalling
  19. Background System Biology Modeling Gene Expression Analysis Acknowledgments Overview Our

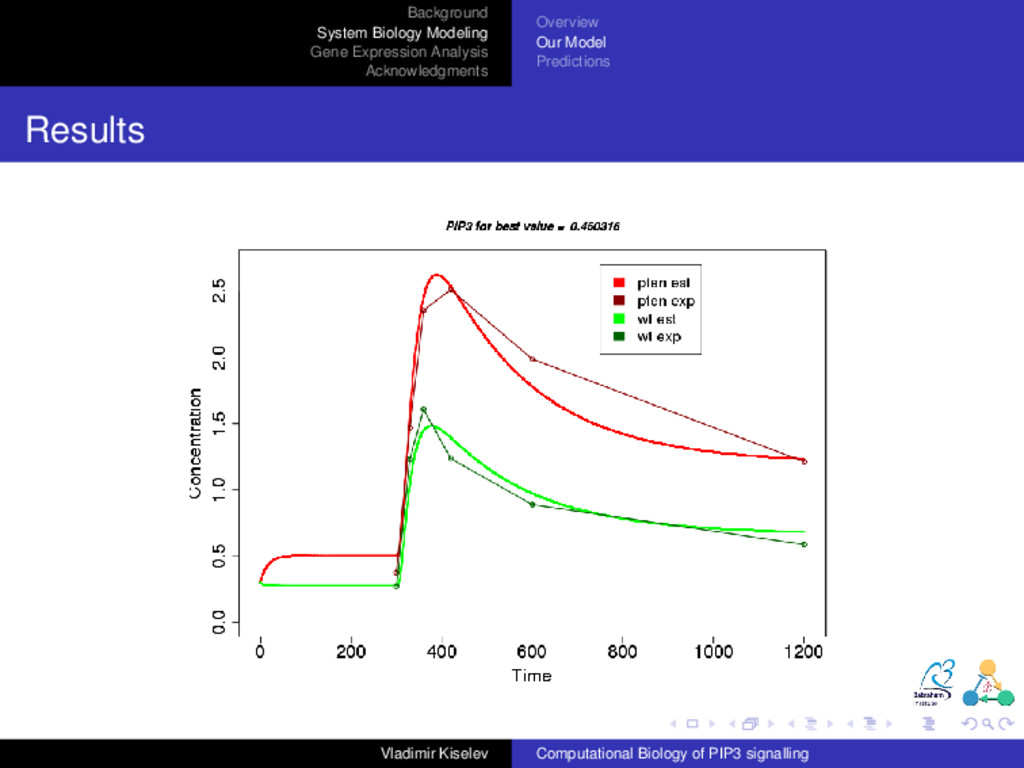
    Model Predictions Results Figure 6: Results of parameter estimation: output of the model with the best set of parameters compared to experimental data. Vladimir Kiselev Computational Biology of PIP3 signalling
  20. Background System Biology Modeling Gene Expression Analysis Acknowledgments Overview Our

    Model Predictions 1 Background PI3K signaling pathway Phosphoinositides Systems Biology 2 System Biology Modeling Overview Our Model Predictions 3 Gene Expression Analysis RNA-seq Our Data Preliminary Analysis Time-Course Analysis 4 Acknowledgments Vladimir Kiselev Computational Biology of PIP3 signalling
  21. Background System Biology Modeling Gene Expression Analysis Acknowledgments Overview Our

    Model Predictions SHIP1/SHIP2 Activity Vladimir Kiselev Computational Biology of PIP3 signalling
  22. Background System Biology Modeling Gene Expression Analysis Acknowledgments Overview Our

    Model Predictions SHIP1/SHIP2 Activity ctrl WT ctrl PTEN SHIP2 WT SHIP2 PTEN SHIP1 WT SHIP1 PTEN 0 200 400 600 0 2 4 0 2 4 0 2 4 0 2 4 0 2 4 0 2 4 Time Percentage of peak value at 1 min exp SHIP1_1 SHIP1_2 SHIP1_3 SHIP2_1 SHIP2_2 SHIP2_3 PIP3 Vladimir Kiselev Computational Biology of PIP3 signalling
  23. Background System Biology Modeling Gene Expression Analysis Acknowledgments Overview Our

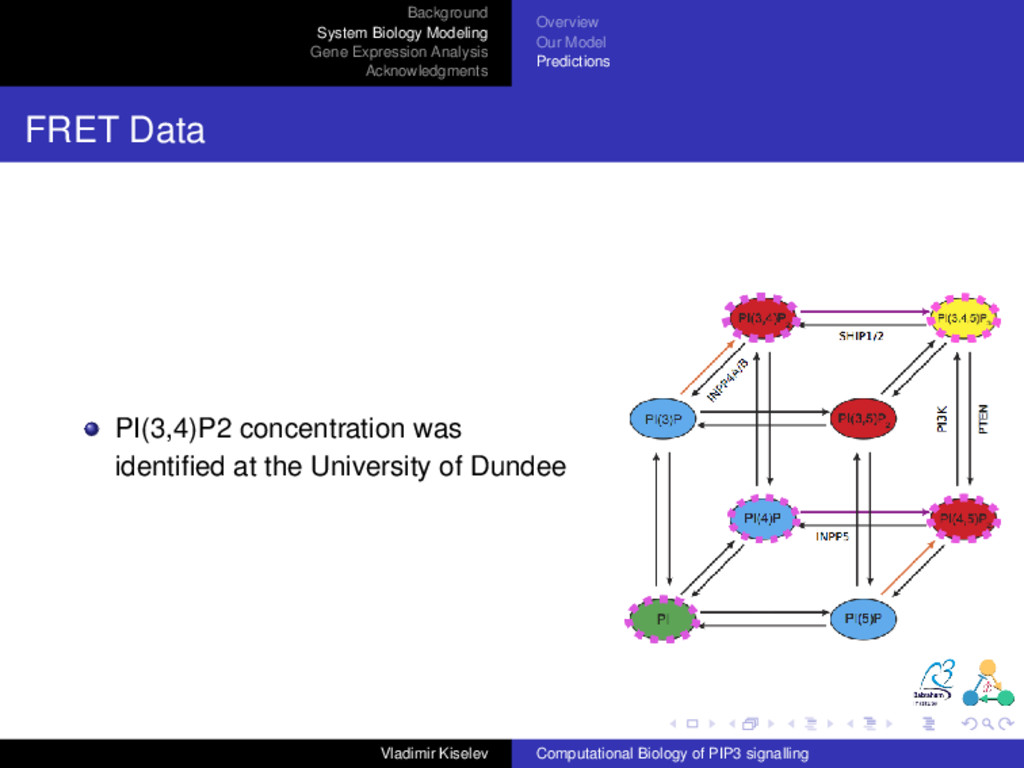
    Model Predictions FRET Data PI(3,4)P2 concentration was identified at the University of Dundee Vladimir Kiselev Computational Biology of PIP3 signalling
  24. Background System Biology Modeling Gene Expression Analysis Acknowledgments Overview Our

    Model Predictions SHIP1/SHIP2 Activity Vladimir Kiselev Computational Biology of PIP3 signalling
  25. Background System Biology Modeling Gene Expression Analysis Acknowledgments Overview Our

    Model Predictions Adding SHIP1/SHIP2 – In Progress EGF EGFR EGFR EGF EGFR dimer EGFR phosp. PI3K* PI3K PIP2 PI3K* PI(4,5)P2 PIP3 PTEN PIP3 PTEN SHIP2 PIP3 SHIP2 PI(3,4)P2 SHIP1 PIP3 SHIP1 Vladimir Kiselev Computational Biology of PIP3 signalling
  26. Background System Biology Modeling Gene Expression Analysis Acknowledgments Overview Our

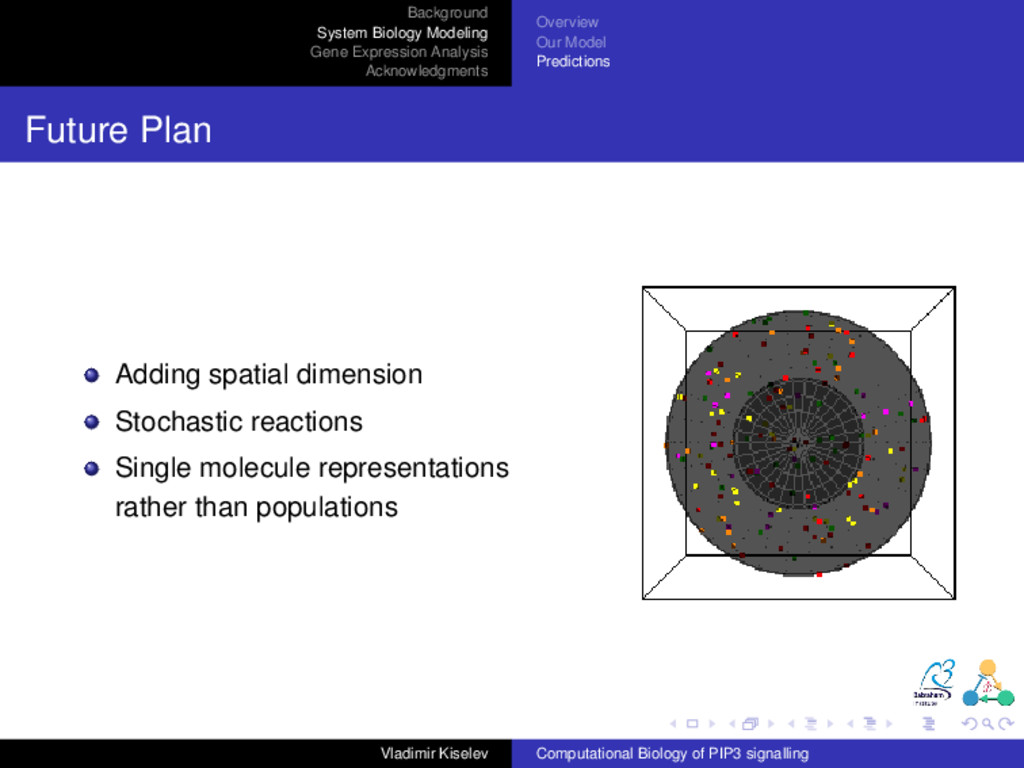
    Model Predictions Future Plan Adding spatial dimension Stochastic reactions Single molecule representations rather than populations Vladimir Kiselev Computational Biology of PIP3 signalling
  27. Background System Biology Modeling Gene Expression Analysis Acknowledgments RNA-seq Our

    Data Preliminary Analysis Time-Course Analysis 1 Background PI3K signaling pathway Phosphoinositides Systems Biology 2 System Biology Modeling Overview Our Model Predictions 3 Gene Expression Analysis RNA-seq Our Data Preliminary Analysis Time-Course Analysis 4 Acknowledgments Vladimir Kiselev Computational Biology of PIP3 signalling
  28. Background System Biology Modeling Gene Expression Analysis Acknowledgments RNA-seq Our

    Data Preliminary Analysis Time-Course Analysis Brief Intro Figure from www.discovery.lifemapsc.com Vladimir Kiselev Computational Biology of PIP3 signalling
  29. Background System Biology Modeling Gene Expression Analysis Acknowledgments RNA-seq Our

    Data Preliminary Analysis Time-Course Analysis Method Figure from www.raetschlab.org Vladimir Kiselev Computational Biology of PIP3 signalling
  30. Background System Biology Modeling Gene Expression Analysis Acknowledgments RNA-seq Our

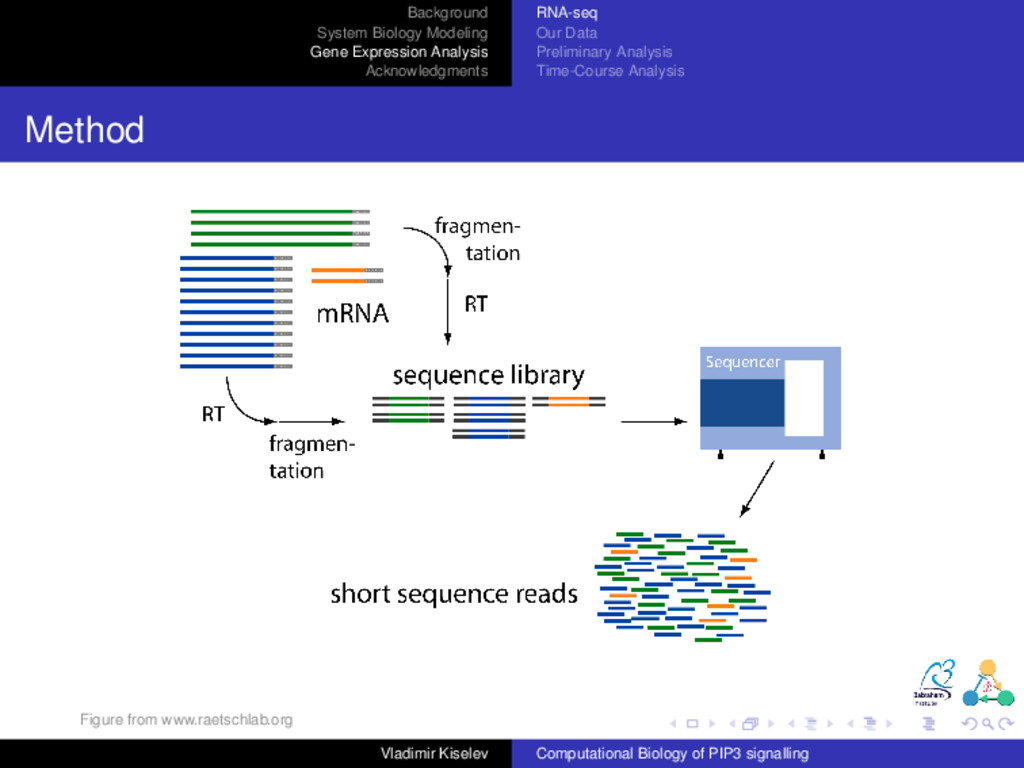
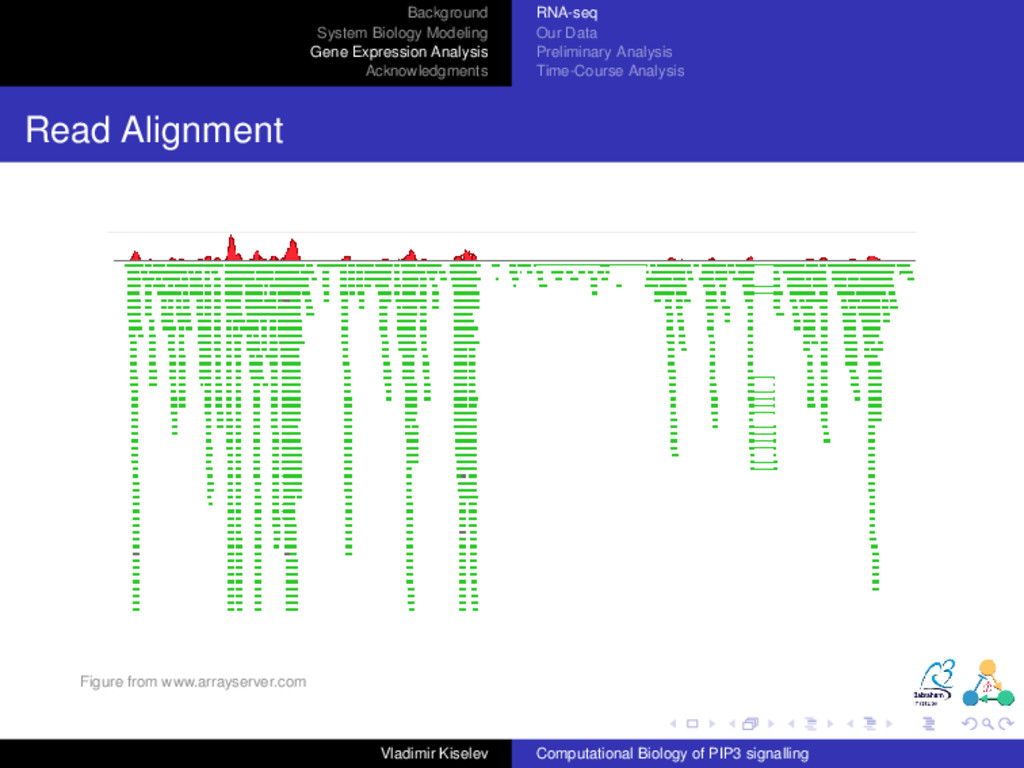
    Data Preliminary Analysis Time-Course Analysis Read Alignment Figure from www.arrayserver.com Vladimir Kiselev Computational Biology of PIP3 signalling
  31. Background System Biology Modeling Gene Expression Analysis Acknowledgments RNA-seq Our

    Data Preliminary Analysis Time-Course Analysis 1 Background PI3K signaling pathway Phosphoinositides Systems Biology 2 System Biology Modeling Overview Our Model Predictions 3 Gene Expression Analysis RNA-seq Our Data Preliminary Analysis Time-Course Analysis 4 Acknowledgments Vladimir Kiselev Computational Biology of PIP3 signalling
  32. Background System Biology Modeling Gene Expression Analysis Acknowledgments RNA-seq Our

    Data Preliminary Analysis Time-Course Analysis Experiment Design – Everything done by Veronique Juvin Human, breast-derived MCF10a cell line 4 conditions WT WT + p110α selective inhibitor (A66) – KO below PTEN -/- (both mutant alleles) – PTEN below p110α H1047R/+ (1 WT allele / 1 mutant allele) – KI below RNA-seq time course measurements at 0m-15m-40m-90m-180m-300m 3 replicates for each point Vladimir Kiselev Computational Biology of PIP3 signalling
  33. Background System Biology Modeling Gene Expression Analysis Acknowledgments RNA-seq Our

    Data Preliminary Analysis Time-Course Analysis Expression Data Vladimir Kiselev Computational Biology of PIP3 signalling
  34. Background System Biology Modeling Gene Expression Analysis Acknowledgments RNA-seq Our

    Data Preliminary Analysis Time-Course Analysis 1 Background PI3K signaling pathway Phosphoinositides Systems Biology 2 System Biology Modeling Overview Our Model Predictions 3 Gene Expression Analysis RNA-seq Our Data Preliminary Analysis Time-Course Analysis 4 Acknowledgments Vladimir Kiselev Computational Biology of PIP3 signalling
  35. Background System Biology Modeling Gene Expression Analysis Acknowledgments RNA-seq Our

    Data Preliminary Analysis Time-Course Analysis Correlation Matrix Vladimir Kiselev Computational Biology of PIP3 signalling
  36. Background System Biology Modeling Gene Expression Analysis Acknowledgments RNA-seq Our

    Data Preliminary Analysis Time-Course Analysis Principal Component Analysis q q qq q qq q q q q q q q q q q q q q qq q q q q q q q q q q qq q q q q q q q q q q q q q q q q q q q q q q q q q q q q q q q q q q q qq q q q q −0.1 0.0 0.1 0.2 −0.1155 −0.1150 −0.1145 −0.1140 PC1 PC2 time q q q q q q 0 15 40 90 180 300 cond q q q q q wt pten ko konost ki Vladimir Kiselev Computational Biology of PIP3 signalling
  37. Background System Biology Modeling Gene Expression Analysis Acknowledgments RNA-seq Our

    Data Preliminary Analysis Time-Course Analysis 1 Background PI3K signaling pathway Phosphoinositides Systems Biology 2 System Biology Modeling Overview Our Model Predictions 3 Gene Expression Analysis RNA-seq Our Data Preliminary Analysis Time-Course Analysis 4 Acknowledgments Vladimir Kiselev Computational Biology of PIP3 signalling
  38. Background System Biology Modeling Gene Expression Analysis Acknowledgments RNA-seq Our

    Data Preliminary Analysis Time-Course Analysis DE Analysis Tool DESeq package (from Bioconductor) – takes into account all replicates FDR of 1% Vladimir Kiselev Computational Biology of PIP3 signalling
  39. Background System Biology Modeling Gene Expression Analysis Acknowledgments RNA-seq Our

    Data Preliminary Analysis Time-Course Analysis Time Direction Vladimir Kiselev Computational Biology of PIP3 signalling
  40. Background System Biology Modeling Gene Expression Analysis Acknowledgments RNA-seq Our

    Data Preliminary Analysis Time-Course Analysis Time Direction Vladimir Kiselev Computational Biology of PIP3 signalling
  41. Background System Biology Modeling Gene Expression Analysis Acknowledgments RNA-seq Our

    Data Preliminary Analysis Time-Course Analysis Time Profiles Vladimir Kiselev Computational Biology of PIP3 signalling
  42. Background System Biology Modeling Gene Expression Analysis Acknowledgments RNA-seq Our

    Data Preliminary Analysis Time-Course Analysis Time Profiles Vladimir Kiselev Computational Biology of PIP3 signalling
  43. Background System Biology Modeling Gene Expression Analysis Acknowledgments RNA-seq Our

    Data Preliminary Analysis Time-Course Analysis Condition Direction Vladimir Kiselev Computational Biology of PIP3 signalling
  44. Background System Biology Modeling Gene Expression Analysis Acknowledgments RNA-seq Our

    Data Preliminary Analysis Time-Course Analysis Condition Direction Vladimir Kiselev Computational Biology of PIP3 signalling
  45. Background System Biology Modeling Gene Expression Analysis Acknowledgments RNA-seq Our

    Data Preliminary Analysis Time-Course Analysis Condition Profiles 809 401 303 301 266 180 145 143 128 124 92 63 60 57 53 53 49 40 35 29 28 28 sdssss ssssds ddsdds ddssss ddsddd ddsdss dsssss dddddd sssdss sdsdss ddssds sdsdds sssdds sdssds ddssdd sssssd ssssus ssssdd dsssds sussss ddsssd dssdds −5 0 −5 0 −5 0 −5 0 −5 0 0 100 200 300 0 100 200 300 time log2FoldChange Vladimir Kiselev Computational Biology of PIP3 signalling
  46. Background System Biology Modeling Gene Expression Analysis Acknowledgments RNA-seq Our

    Data Preliminary Analysis Time-Course Analysis Future Plan Identify unique EGF stimulation related genes Vladimir Kiselev Computational Biology of PIP3 signalling
  47. Background System Biology Modeling Gene Expression Analysis Acknowledgments Acknowledgments People

    Mouhannad Malek, Veronique Juvin Len Stephens, Phill Hawkins Nicolas Le Novere and the group Nicholas Luscombe and the LRI group Marija Jankovic, Sven Bergmann, Anne Segonds-Pichon, Simon Andrews Money BBSRC grant Babraham Institute Note: this presentation was made with L ATEX, Beamer + Wiki2Beamer Source code: https://github.com/wikiselev/department-seminar Vladimir Kiselev Computational Biology of PIP3 signalling