Upgrade to Pro — share decks privately, control downloads, hide ads and more …

Accurately Simulating Energy Consumption of I/O-intensive Scientific Workflows

WRENCH
June 12, 2019

Accurately Simulating Energy Consumption of I/O-intensive Scientific Workflows

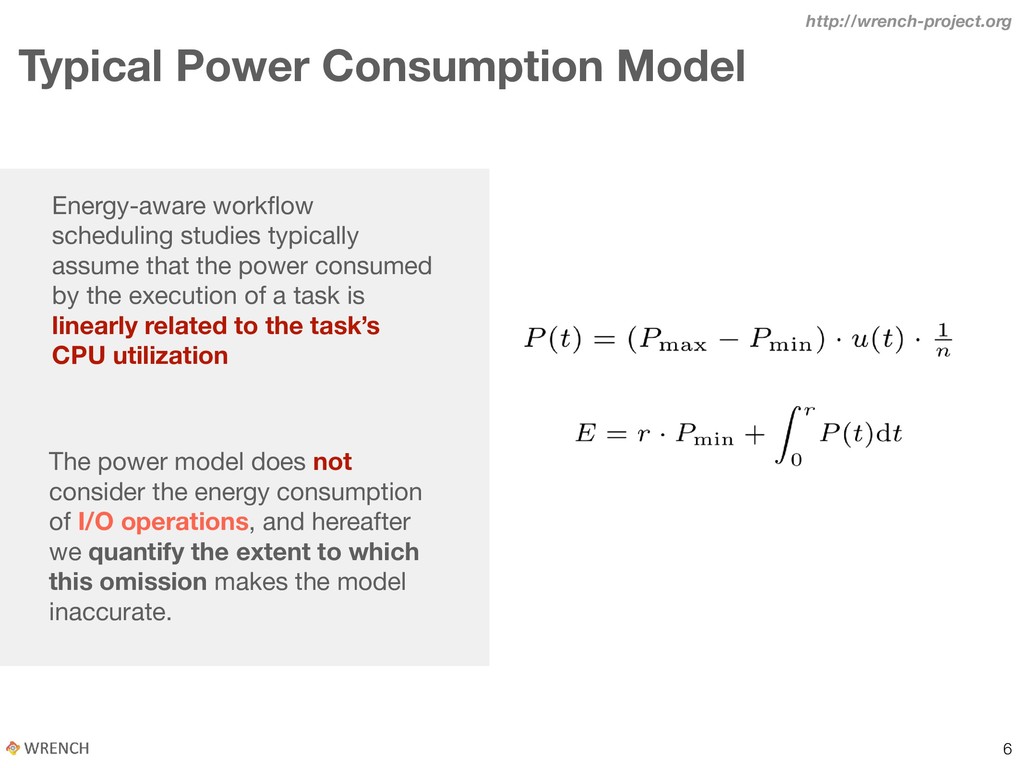
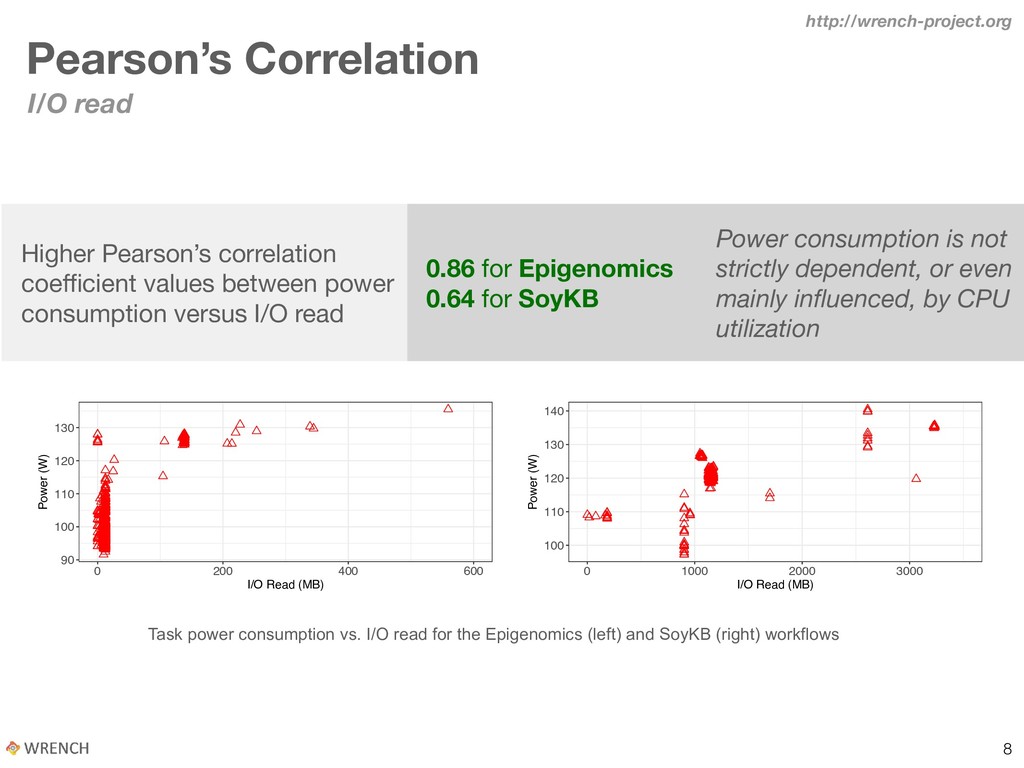
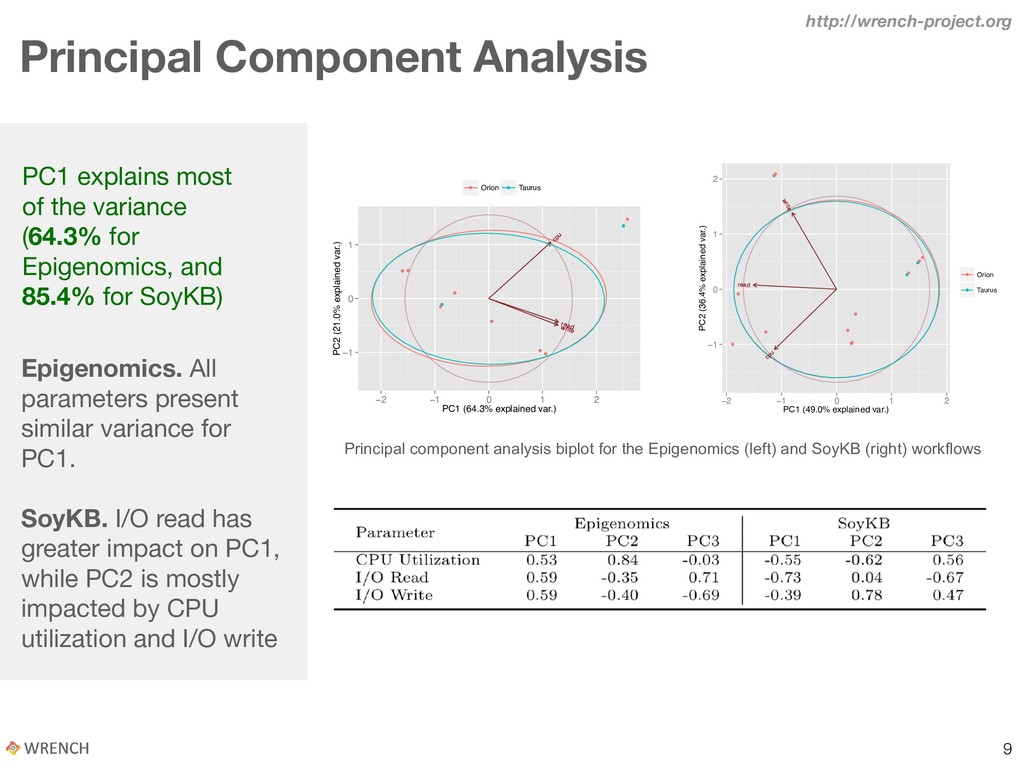
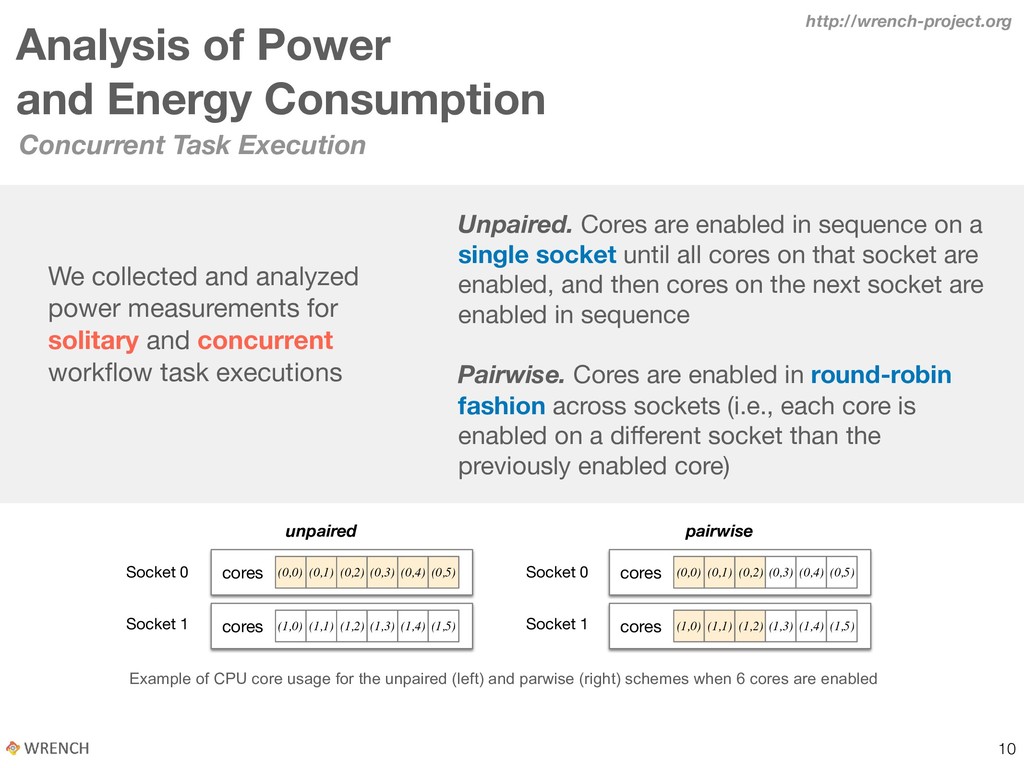
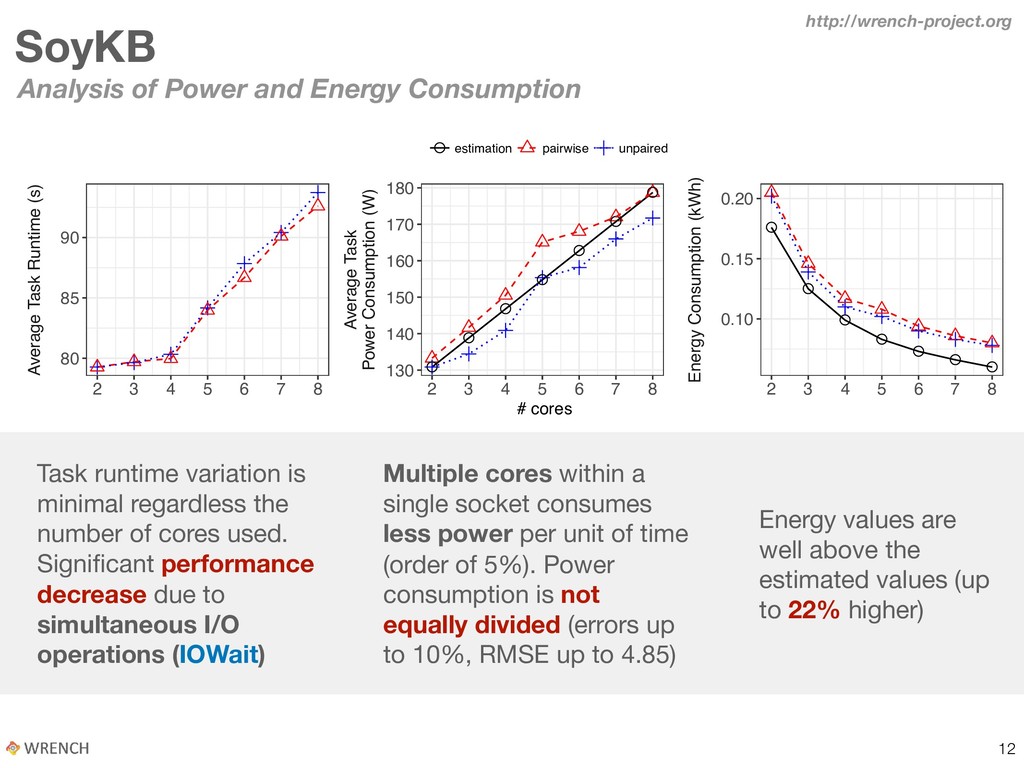
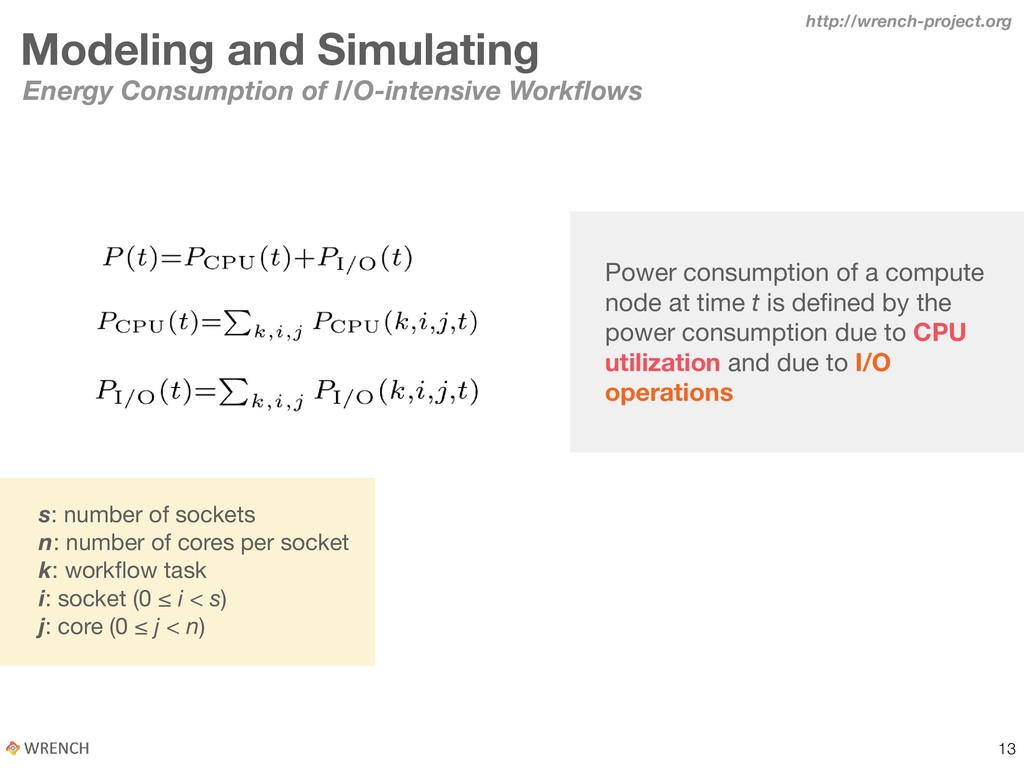
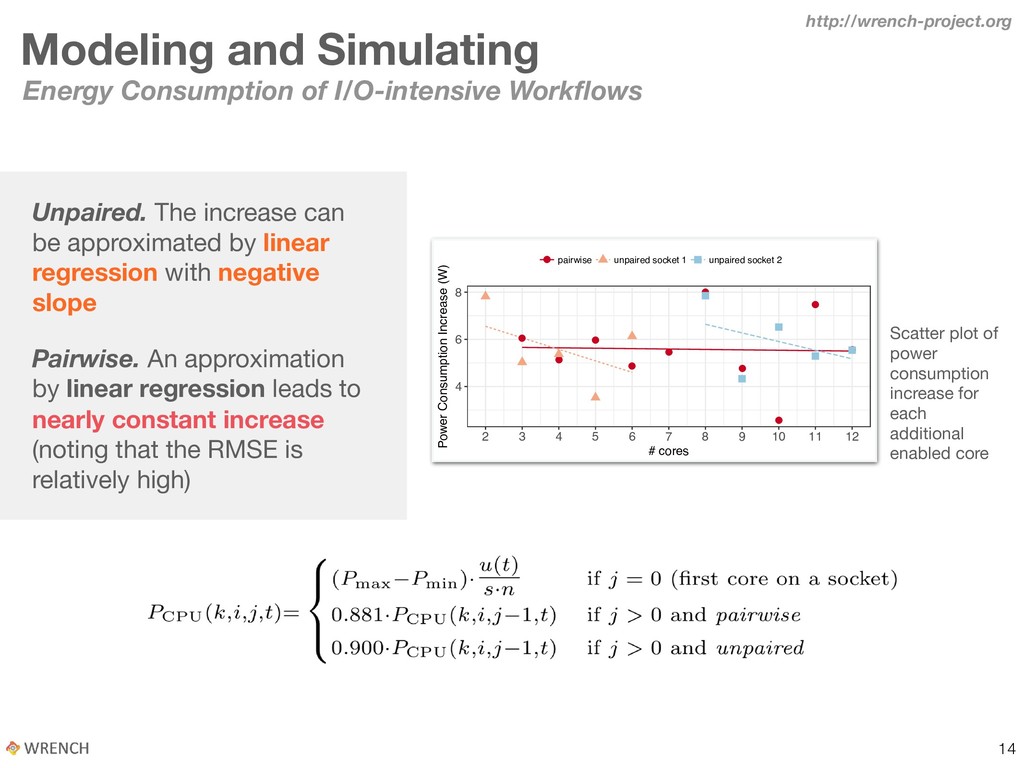
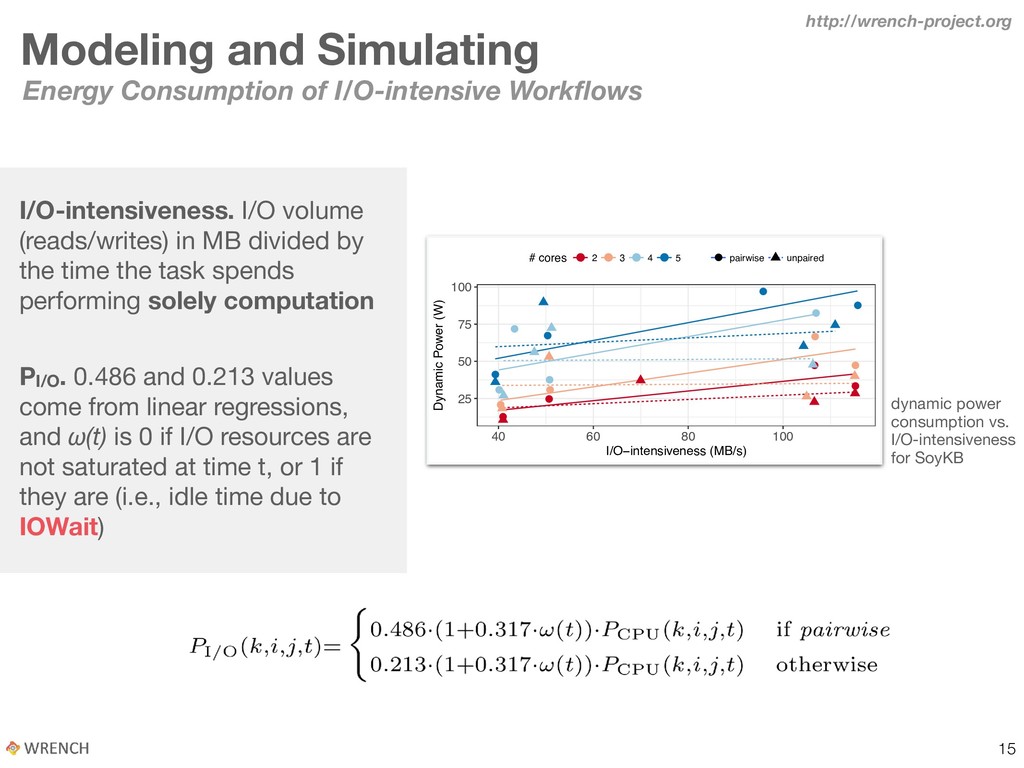
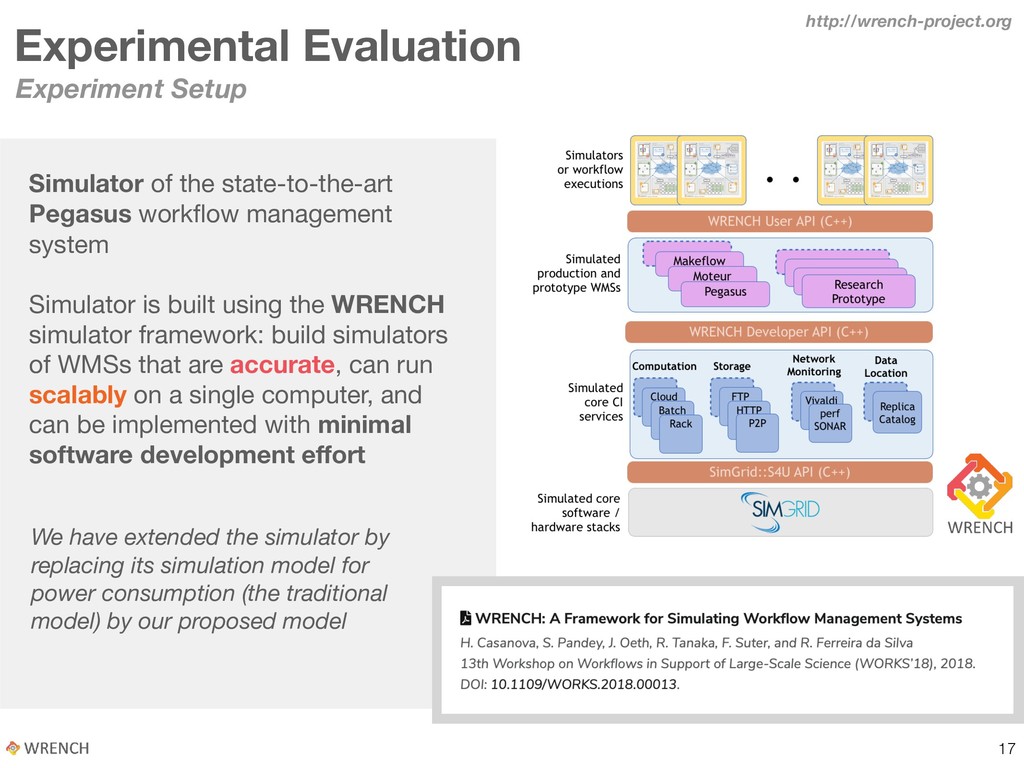
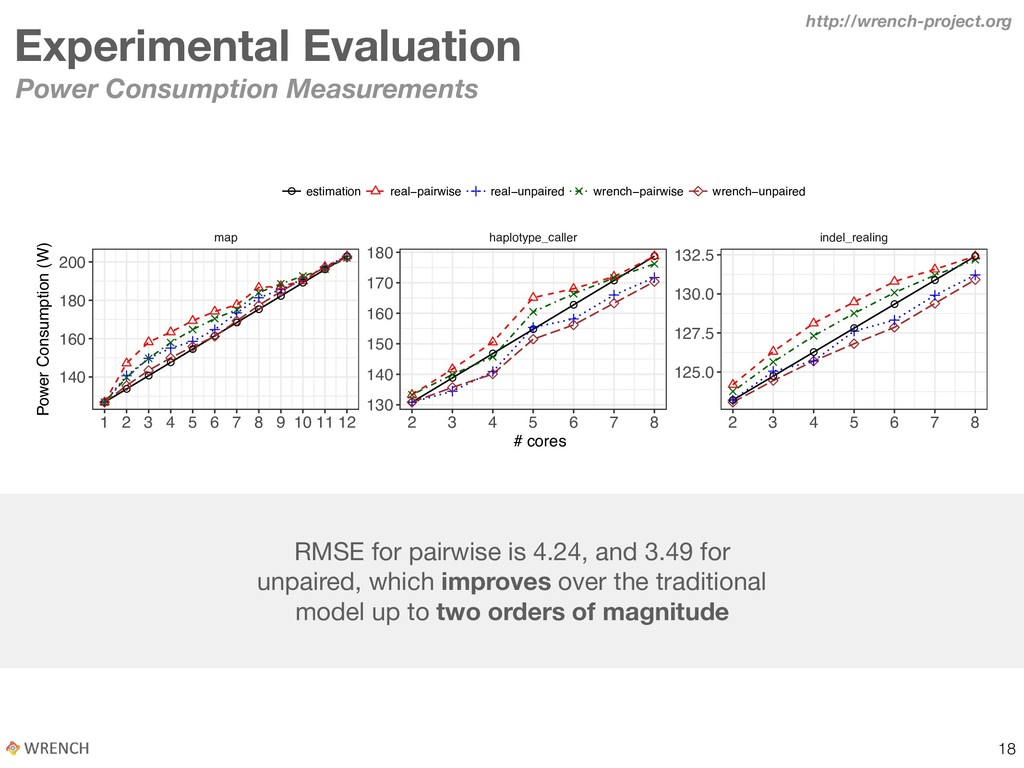
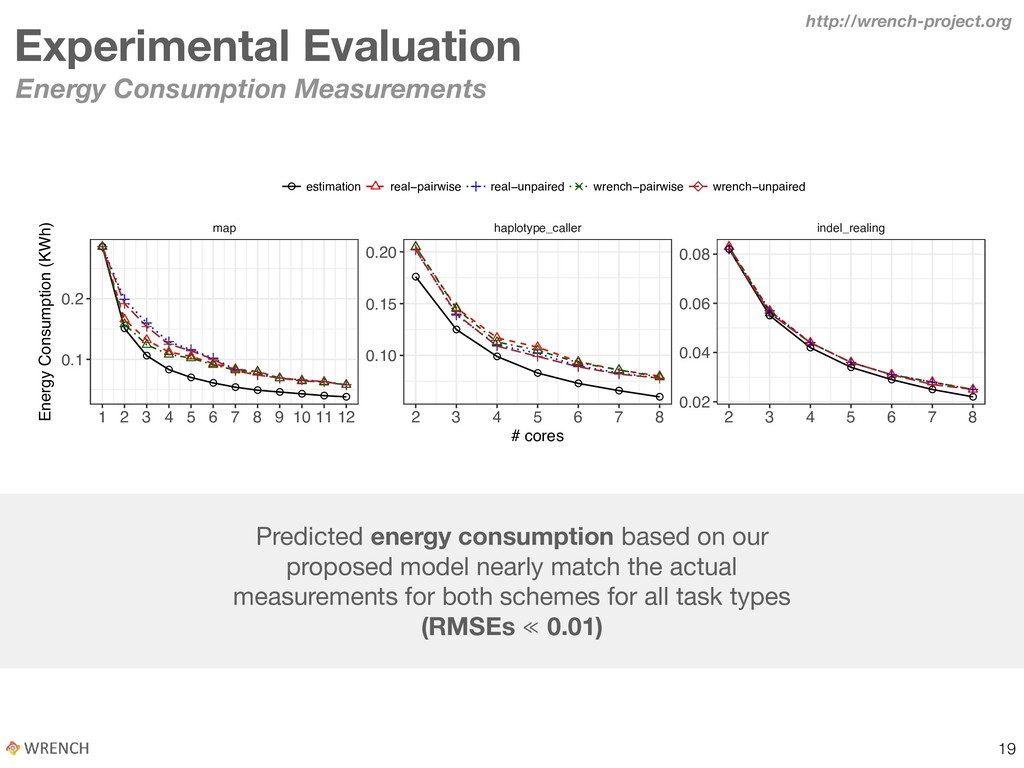
While distributed computing infrastructures can provide in- frastructure-level techniques for managing energy consumption, appli- cation-level energy consumption models have also been developed to support energy-efficient scheduling and resource provisioning algorithms. In this work, we analyze the accuracy of a widely-used application-level model that have been developed and used in the context of scientific workflow executions. To this end, we profile two production scientific workflows on a distributed platform instrumented with power meters. We then conduct an analysis of power and energy consumption measure- ments. This analysis shows that power consumption is not linearly related to CPU utilization and that I/O operations significantly impact power, and thus energy, consumption. We then propose a power consumption model that accounts for I/O operations, including the impact of wait- ing for these operations to complete, and for concurrent task executions on multi-socket, multi-core compute nodes. We implement our proposed model as part of a simulator that allows us to draw direct comparisons between real-world and modeled power and energy consumption. We find that our model has high accuracy when compared to real-world execu- tions. Furthermore, our model improves accuracy by about two orders of magnitude when compared to the traditional models used in the energy- efficient workflow scheduling literature.

WRENCH

June 12, 2019
Tweet

More Decks by WRENCH

Other Decks in Research

Transcript

  1. Accurately Simulating Energy Consumption of I/O-intensive Scientific Workflows Rafael Ferreira

    da Silva1, Anne-Cécile Orgerie2, Henri Casanova3, Ryan Tanaka3, Ewa Deelman1, and Frédéric Suter4 http://wrench-project.org 1 USC Information Sciences Institute, Marina del Rey, CA, USA 2 Univ Rennes, Inria, CNRS, IRISA, Rennes, France 3 Information and Computer Sciences, University of Hawaii, Honolulu, HI, USA 4 IN2P3 Computing Center, CNRS, Villeurbanne, France
  2. Motivation !2 Computational simulations often comprise individual computational (but often

    I/O- intensive) tasks with some dependency structure, and are computed on distributed computing infrastructures such as HPC and clouds The need to manage energy consumption across the entire suite of information and communication technology has received significant attention in the last few years Approaches. Data-centers have developed techniques for managing cooling and energy usage. Researchers have investigated application-level techniques and algorithms to enable energy-efficient executions http://wrench-project.org https://insidehpc.com/2017/12/sc17-energy-efficiency-software- stack-cross-community-efforts/
  3. Improving our Understanding Pegasus Workflow Management System State-of-the-art workflow system

    Pegasus encompasses a set of technologies that help workflow-based applications execute in a number of different environments Monitors and logs fine-grained profiling data such as I/O operations, runtime, memory usage, and CPU utilization https://pegasus.isi.edu Grid'5000 Testbed Workflows were executed on the taurus cluster at the Grid’5000 Lyon site, which is instrumented at the node level with power meters Lyon site. Each node is equipped with two 2.3GHz hexacore Intel Xeon E5-2630 CPUs, 32GB of RAM, and standard magnetic hard drives. Power measurements are collected in milliseconds from power meters that are connected to a data collector via a serial link https://grid5000.fr http://wrench-project.org !3
  4. Workflows
 Characteristics fastQSplit filterContams sol2sanger fastq2bfq map mapMerge maqIndex pileup

    Epigenomics I/O-intensive bioinformatics workflow (instance of 577 tasks) !4 http://wrench-project.org
  5. ... ... ... aligment_to_reference sort_sam dedup add_replace realing_target_creator indel_realing haplotype_caller

    genotype_gvcfs combine_variants select_variants_indel filtering_indel select_variants_snp filtering_snp merge_gvcfs SoyKB I/O-intensive bioinformatics workflow (instance of 676 tasks) !5 http://wrench-project.org Workflows
 Characteristics
  6. Typical Power Consumption Model Energy-aware workflow scheduling studies typically assume

    that the power consumed by the execution of a task is linearly related to the task’s CPU utilization The power model does not consider the energy consumption of I/O operations, and hereafter we quantify the extent to which this omission makes the model inaccurate. !6 http://wrench-project.org
  7. Pearson’s Correlation 90 100 110 120 130 100% 125% 150%

    CPU Utilization Power (W) 100 110 120 130 140 100% 125% 150% CPU Utilization Power (W) Task power consumption vs. CPU utilization for the Epigenomics (left) and SoyKB (right) workflows CPU Utilization Very low Pearson’s correlation coefficient values between power consumption versus CPU utilization 0.38 for Epigenomics -0.02 for SoyKB No linear increase in the power consumption as CPU utilization increases !7 http://wrench-project.org
  8. Task power consumption vs. I/O read for the Epigenomics (left)

    and SoyKB (right) workflows 100 110 120 130 140 0 1000 2000 3000 I/O Read (MB) Power (W) 90 100 110 120 130 0 200 400 600 I/O Read (MB) Power (W) Higher Pearson’s correlation coefficient values between power consumption versus I/O read 0.86 for Epigenomics 0.64 for SoyKB Power consumption is not strictly dependent, or even mainly influenced, by CPU utilization !8 http://wrench-project.org Pearson’s Correlation I/O read
  9. Principal Component Analysis Principal component analysis biplot for the Epigenomics

    (left) and SoyKB (right) workflows PC1 explains most of the variance (64.3% for Epigenomics, and 85.4% for SoyKB) cpu read write −1 0 1 −2 −1 0 1 2 PC1 (64.3% explained var.) PC2 (21.0% explained var.) Orion Taurus cpu read write −1 0 1 2 −2 −1 0 1 2 PC1 (49.0% explained var.) PC2 (36.4% explained var.) Orion Taurus Epigenomics. All parameters present similar variance for PC1. SoyKB. I/O read has greater impact on PC1, while PC2 is mostly impacted by CPU utilization and I/O write !9 http://wrench-project.org
  10. Analysis of Power and Energy Consumption Example of CPU core

    usage for the unpaired (left) and parwise (right) schemes when 6 cores are enabled We collected and analyzed power measurements for solitary and concurrent workflow task executions Concurrent Task Execution unpaired cores Socket 0 cores pairwise cores cores (0,0) (0,1) (0,2) (0,3) (0,4) (0,5) Socket 1 Socket 0 Socket 1 (1,0) (1,1) (1,2) (1,3) (1,4) (1,5) (0,0) (0,1) (0,2) (0,3) (0,4) (0,5) (1,0) (1,1) (1,2) (1,3) (1,4) (1,5) Unpaired. Cores are enabled in sequence on a single socket until all cores on that socket are enabled, and then cores on the next socket are enabled in sequence Pairwise. Cores are enabled in round-robin fashion across sockets (i.e., each core is enabled on a different socket than the previously enabled core) !10 http://wrench-project.org
  11. • • • • • • • • • •

    • • • • • • • • • • • • • • Energy Consumption (kWh) Average Task Power Consumption (W) Average Task Runtime (s) 1 2 3 4 5 6 7 8 9 101112 1 2 3 4 5 6 7 8 9 101112 1 2 3 4 5 6 7 8 9 101112 0.1 0.2 140 160 180 200 60 70 80 90 # cores • estimation pairwise unpaired Epigenomics Task performance is significantly impacted (degradation of ~25%) when multiple cores are used within a single socket Analysis of Power and Energy Consumption Multiple cores within a single socket consumes less power per unit of time (order of 10%). Power consumption is not equally divided among there number of cores per CPU Energy consumption estimation errors are up to 23% (RMSEs are 0.02 for pairwise and 0.03 for unpaired) !11 http://wrench-project.org
  12. • • • • • • • • • •

    • • • • Energy Consumption (kWh) Average Task Power Consumption (W) Average Task Runtime (s) 2 3 4 5 6 7 8 2 3 4 5 6 7 8 2 3 4 5 6 7 8 0.10 0.15 0.20 130 140 150 160 170 180 80 85 90 # cores • estimation pairwise unpaired Task runtime variation is minimal regardless the number of cores used. Significant performance decrease due to simultaneous I/O operations (IOWait) Multiple cores within a single socket consumes less power per unit of time (order of 5%). Power consumption is not equally divided (errors up to 10%, RMSE up to 4.85) Energy values are well above the estimated values (up to 22% higher) !12 http://wrench-project.org SoyKB Analysis of Power and Energy Consumption
  13. Modeling and Simulating Energy Consumption of I/O-intensive Workflows s: number

    of sockets n: number of cores per socket k: workflow task i: socket (0 ≤ i < s) j: core (0 ≤ j < n) Power consumption of a compute node at time t is defined by the power consumption due to CPU utilization and due to I/O operations !13 http://wrench-project.org
  14. • • • • • • • • • •

    4 6 8 2 3 4 5 6 7 8 9 10 11 12 # cores Power Consumption Increase (W) • pairwise unpaired socket 1 unpaired socket 2 Scatter plot of power consumption increase for each additional enabled core Unpaired. The increase can be approximated by linear regression with negative slope Pairwise. An approximation by linear regression leads to nearly constant increase (noting that the RMSE is relatively high) !14 http://wrench-project.org Modeling and Simulating Energy Consumption of I/O-intensive Workflows
  15. dynamic power consumption vs. I/O-intensiveness for SoyKB I/O-intensiveness. I/O volume

    (reads/writes) in MB divided by the time the task spends performing solely computation • • • • • • • • • • • • • • • • 25 50 75 100 40 60 80 100 I/O−intensiveness (MB/s) Dynamic Power (W) # cores • • • • 2 3 4 5 • pairwise unpaired PI/O. 0.486 and 0.213 values come from linear regressions, and ω(t) is 0 if I/O resources are not saturated at time t, or 1 if they are (i.e., idle time due to IOWait) !15 http://wrench-project.org Modeling and Simulating Energy Consumption of I/O-intensive Workflows
  16. dynamic power consumption vs. I/O-intensiveness for SoyKB I/O-intensiveness. I/O volume

    (reads/writes) in MB divided by the time the task spends performing solely computation • • • • • • • • • • • • • • • • 25 50 75 100 40 60 80 100 I/O−intensiveness (MB/s) Dynamic Power (W) # cores • • • • 2 3 4 5 • pairwise unpaired PI/O. 0.486 and 0.213 values come from linear regressions, and ω(t) is 0 if I/O resources are not saturated at time t, or 1 if they are (i.e., idle time due to IOWait) !16 http://wrench-project.org Modeling and Simulating Energy Consumption of I/O-intensive Workflows The impact of IOWait does not show any strong correlation with the features of different task types This factor is computed as the average of the most accurate such factor values computed individually for each task type
  17. Experimental Evaluation Experiment Setup Simulator of the state-to-the-art Pegasus workflow

    management system Simulator is built using the WRENCH simulator framework: build simulators of WMSs that are accurate, can run scalably on a single computer, and can be implemented with minimal software development effort We have extended the simulator by replacing its simulation model for power consumption (the traditional model) by our proposed model !17 http://wrench-project.org
  18. RMSE for pairwise is 4.24, and 3.49 for unpaired, which

    improves over the traditional model up to two orders of magnitude • • • • • • • • • • • • • • • • • • • • • • • • • • map haplotype_caller indel_realing 1 2 3 4 5 6 7 8 9 10 11 12 2 3 4 5 6 7 8 2 3 4 5 6 7 8 125.0 127.5 130.0 132.5 130 140 150 160 170 180 140 160 180 200 # cores Power Consumption (W) • estimation real−pairwise real−unpaired wrench−pairwise wrench−unpaired Experimental Evaluation Power Consumption Measurements http://wrench-project.org !18
  19. • • • • • • • • • •

    • • • • • • • • • • • • • • • • map haplotype_caller indel_realing 1 2 3 4 5 6 7 8 9 10 11 12 2 3 4 5 6 7 8 2 3 4 5 6 7 8 125.0 127.5 130.0 132.5 130 140 150 160 170 180 140 160 180 200 # cores Power Consumption (W) • estimation real−pairwise real−unpaired wrench−pairwise wrench−unpaired Predicted energy consumption based on our proposed model nearly match the actual measurements for both schemes for all task types (RMSEs ≪ 0.01) • • • • • • • • • • • • • • • • • • • • • • • • • • map haplotype_caller indel_realing 1 2 3 4 5 6 7 8 9 10 11 12 2 3 4 5 6 7 8 2 3 4 5 6 7 8 0.02 0.04 0.06 0.08 0.10 0.15 0.20 0.1 0.2 # cores Energy Consumption (KWh) Experimental Evaluation Energy Consumption Measurements http://wrench-project.org !19
  20. Future Work We plan to instantiate and validate our proposed

    model for other workflows and platform configurations We hope to use power-metered platforms in which compute nodes have SSDs instead of HDDs – The power consumption of I/O could be smaller relative to that of computation – Note that platforms that target extreme-scale computing also often employ low-power compute nodes (i.e., equipped with ARM processors) http://wrench-project.org !20
  21. http://wrench-project.org Thank You Questions? [email protected] This work is funded by

    NSF contracts #1642369 and #1642335, “SI2-SSE: WRENCH: A Simulation Workbench for Scientific Workflow Users, Developers, and Researchers”, and CNRS under grant #PICS07239