& operating our Kubernetes as a Service platform • In my free time: anime & manga — into Demon Slayer (鬼滅の刃), Jujutsu Kaisen (呪術廻戦), and Frieren (葬送のフリーレン) • • Shota Yoshimura | @yosshi_ Also watched: the FIFA World Cup 2026 Favorite release logo: Kubernetes v1.36 "Haru" (ハル)
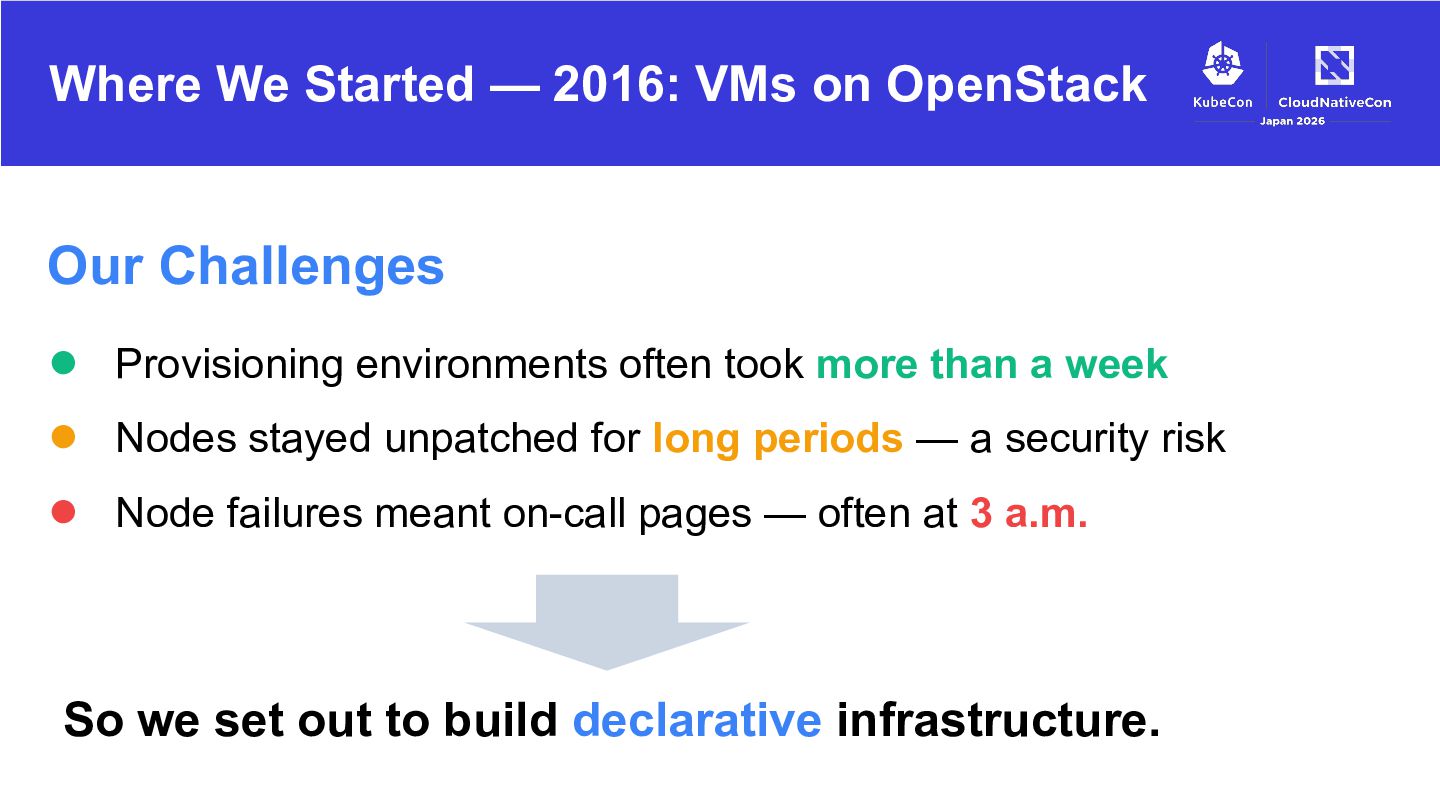
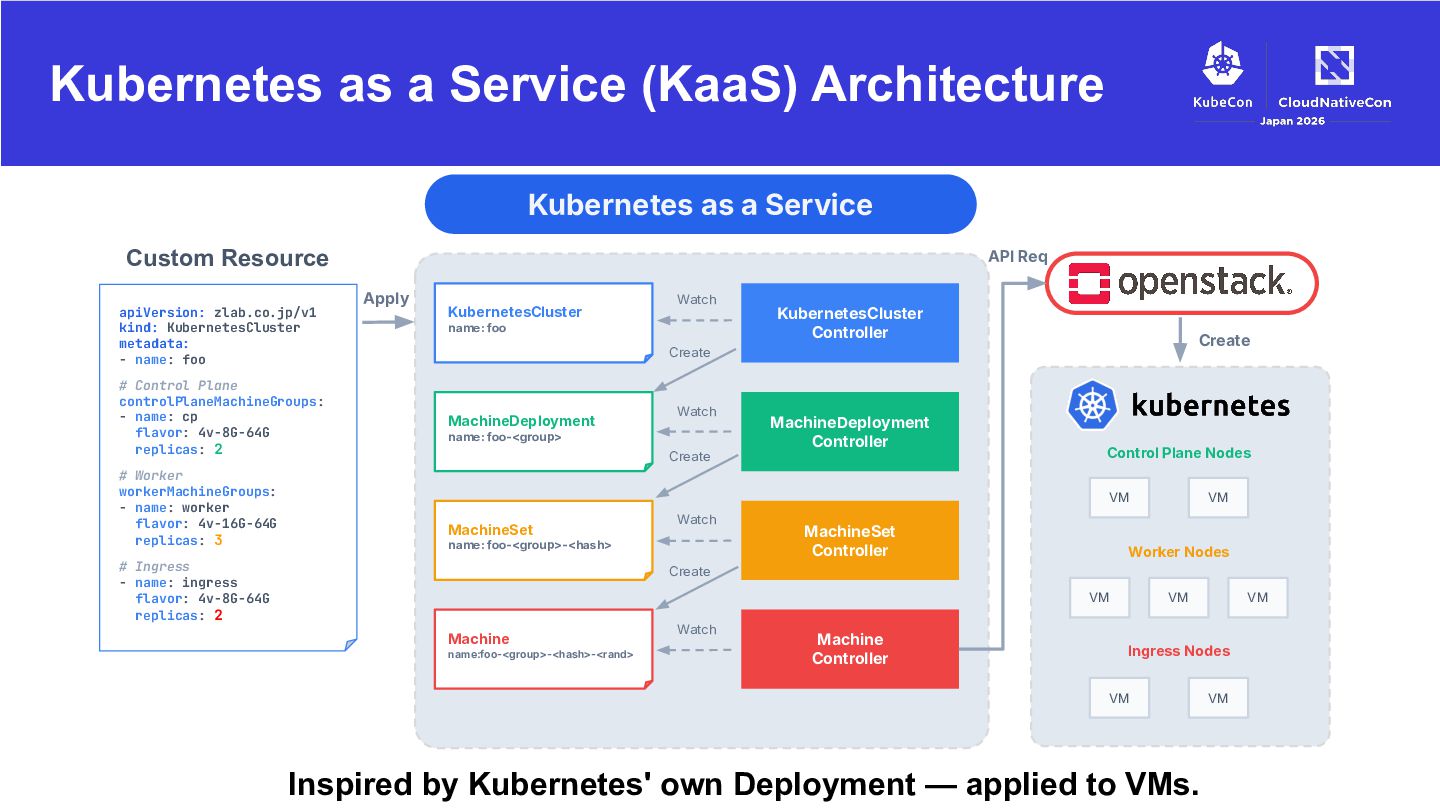
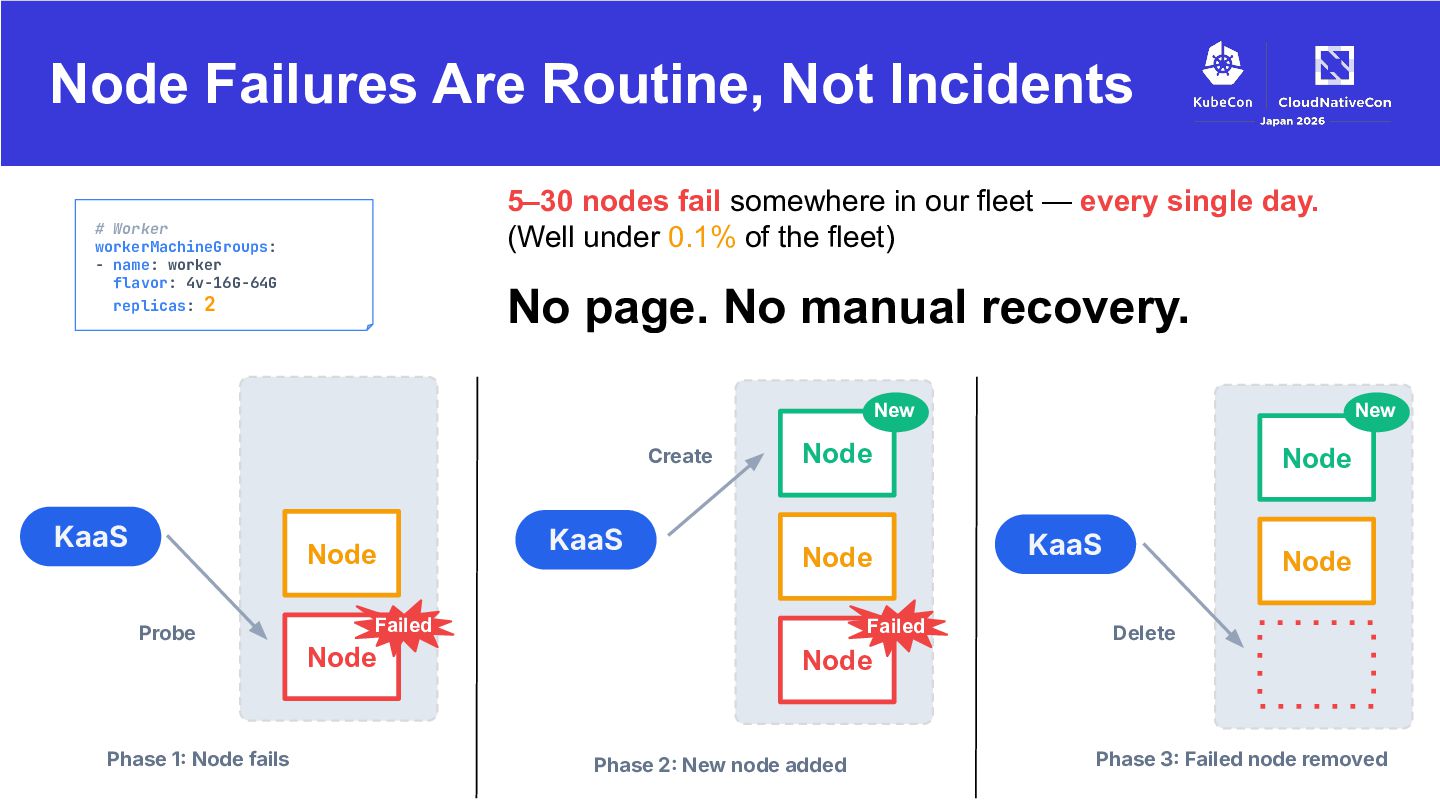
• Provisioning environments often took more than a week • Nodes stayed unpatched for long periods — a security risk • Node failures meant on-call pages — often at 3 a.m. So we set out to build declarative infrastructure.
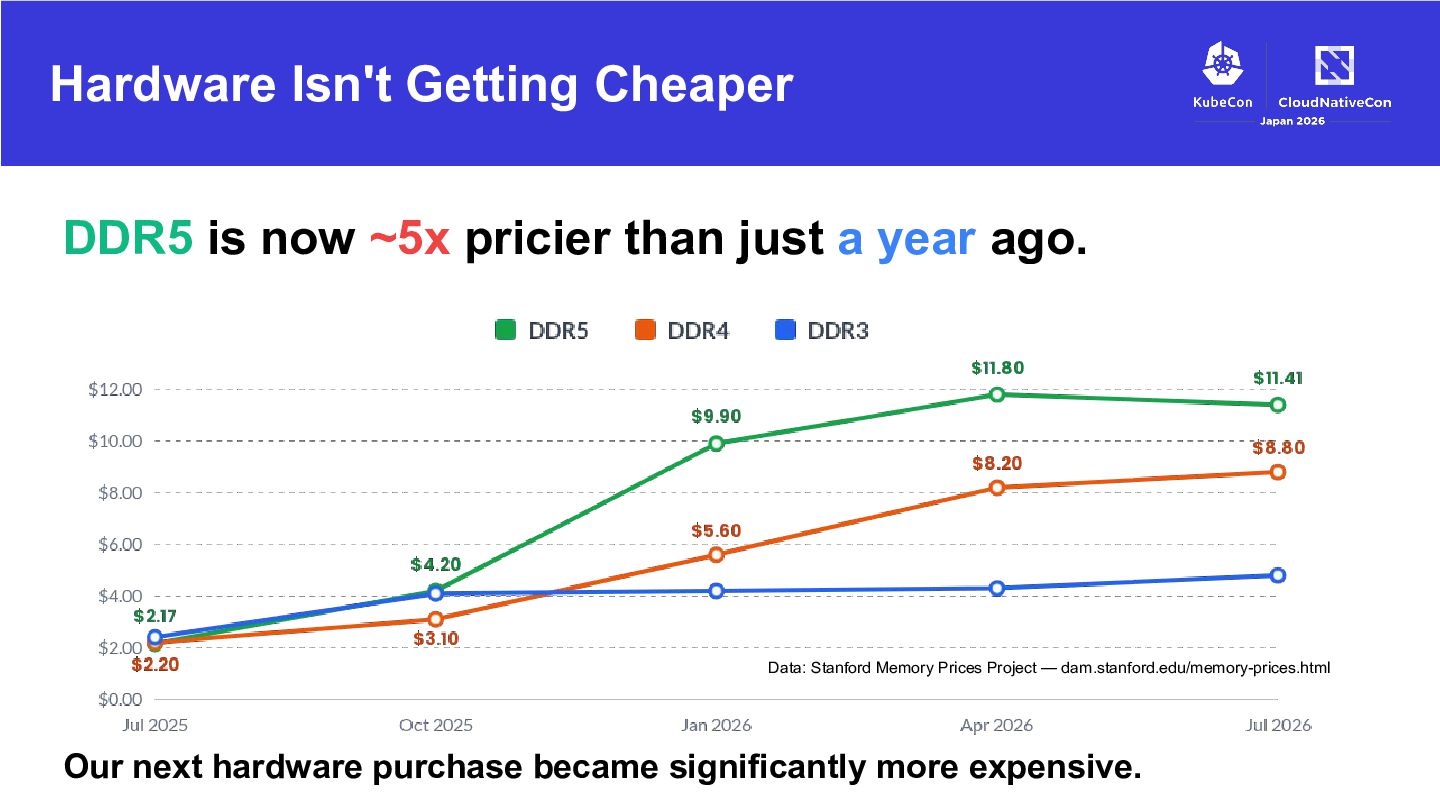
just a year ago. Data: Stanford Memory Prices Project — dam.stanford.edu/memory-prices.html Our next hardware purchase became significantly more expensive.
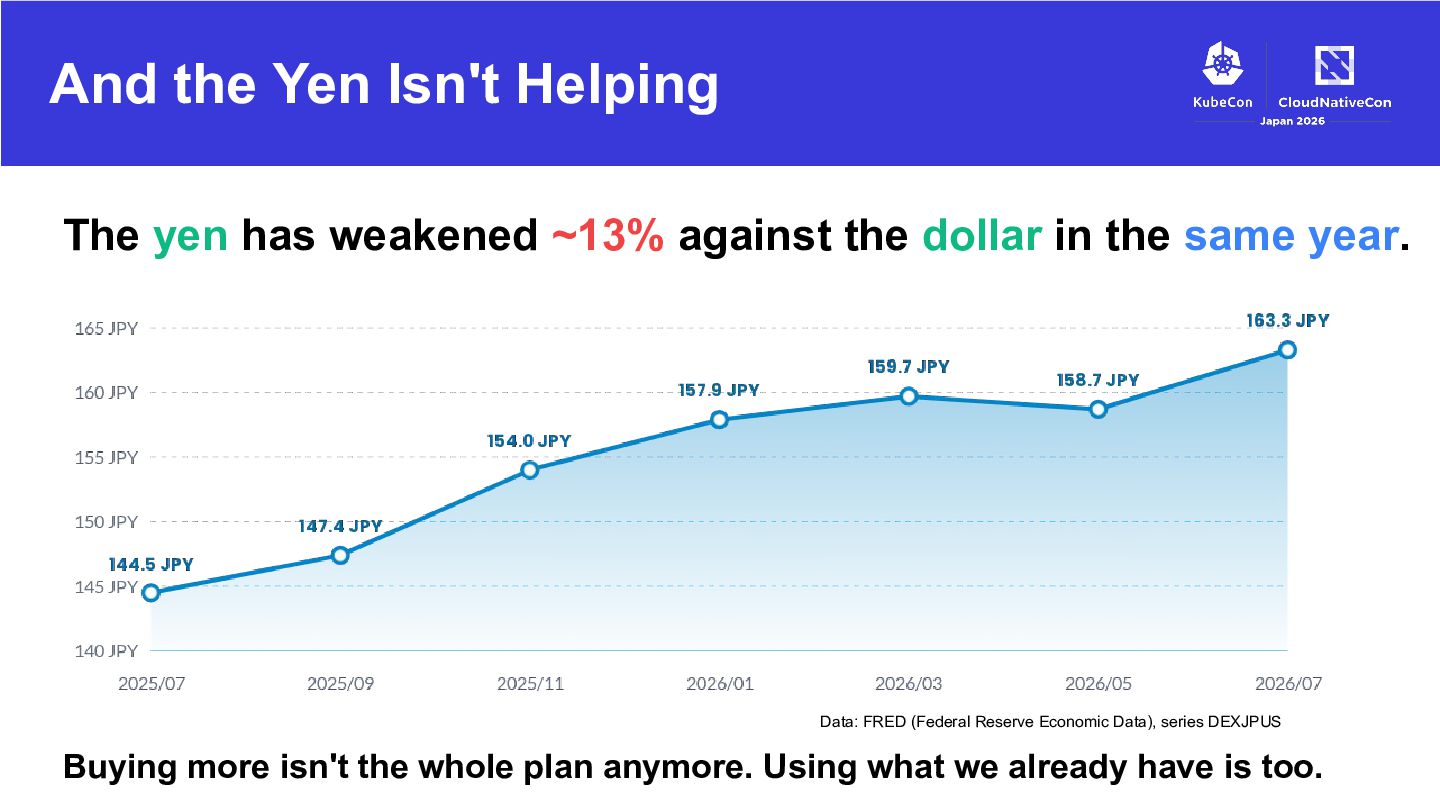
against the dollar in the same year. Data: FRED (Federal Reserve Economic Data), series DEXJPUS Buying more isn't the whole plan anymore. Using what we already have is too.
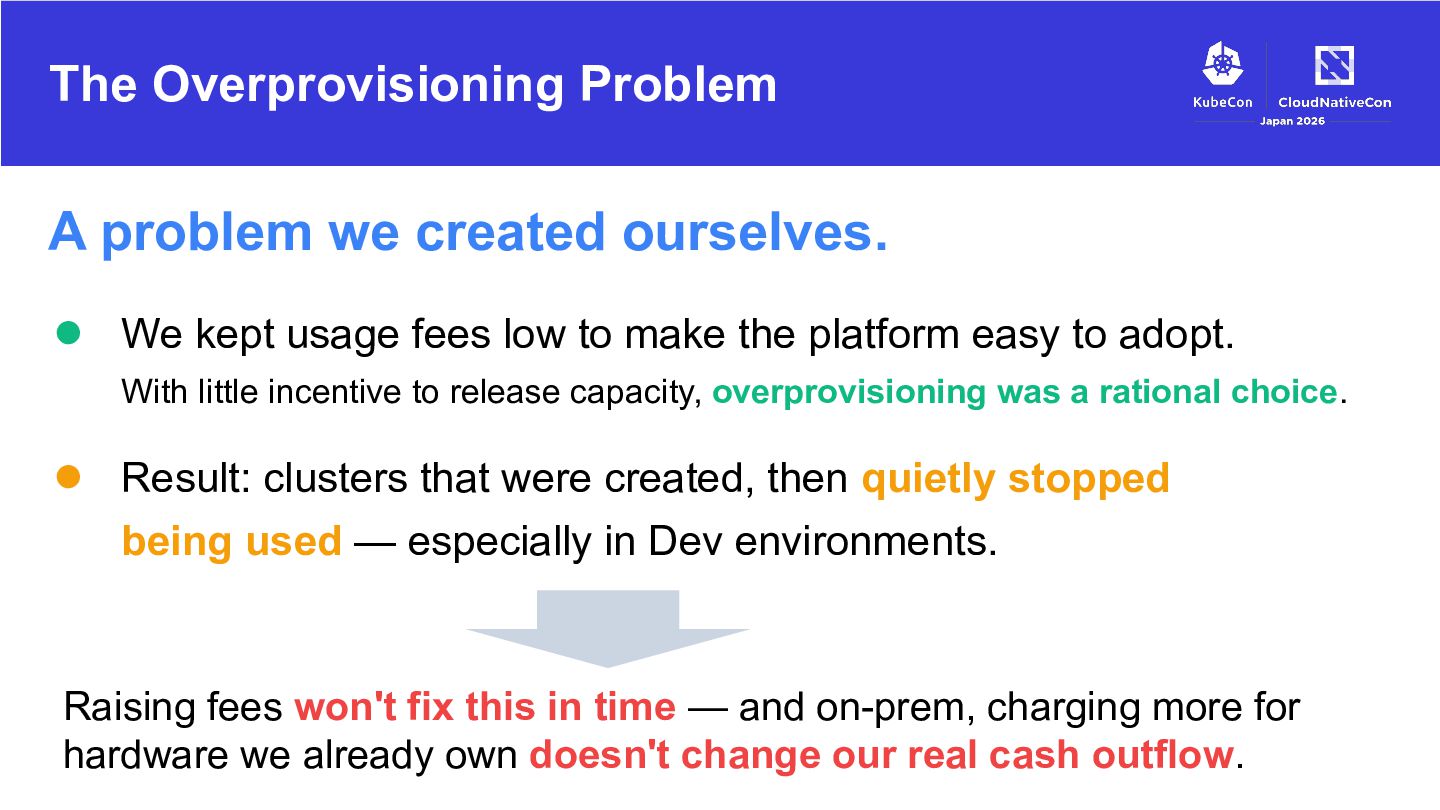
kept usage fees low to make the platform easy to adopt. With little incentive to release capacity, overprovisioning was a rational choice. • Result: clusters that were created, then quietly stopped being used — especially in Dev environments. Raising fees won't fix this in time — and on-prem, charging more for hardware we already own doesn't change our real cash outflow.
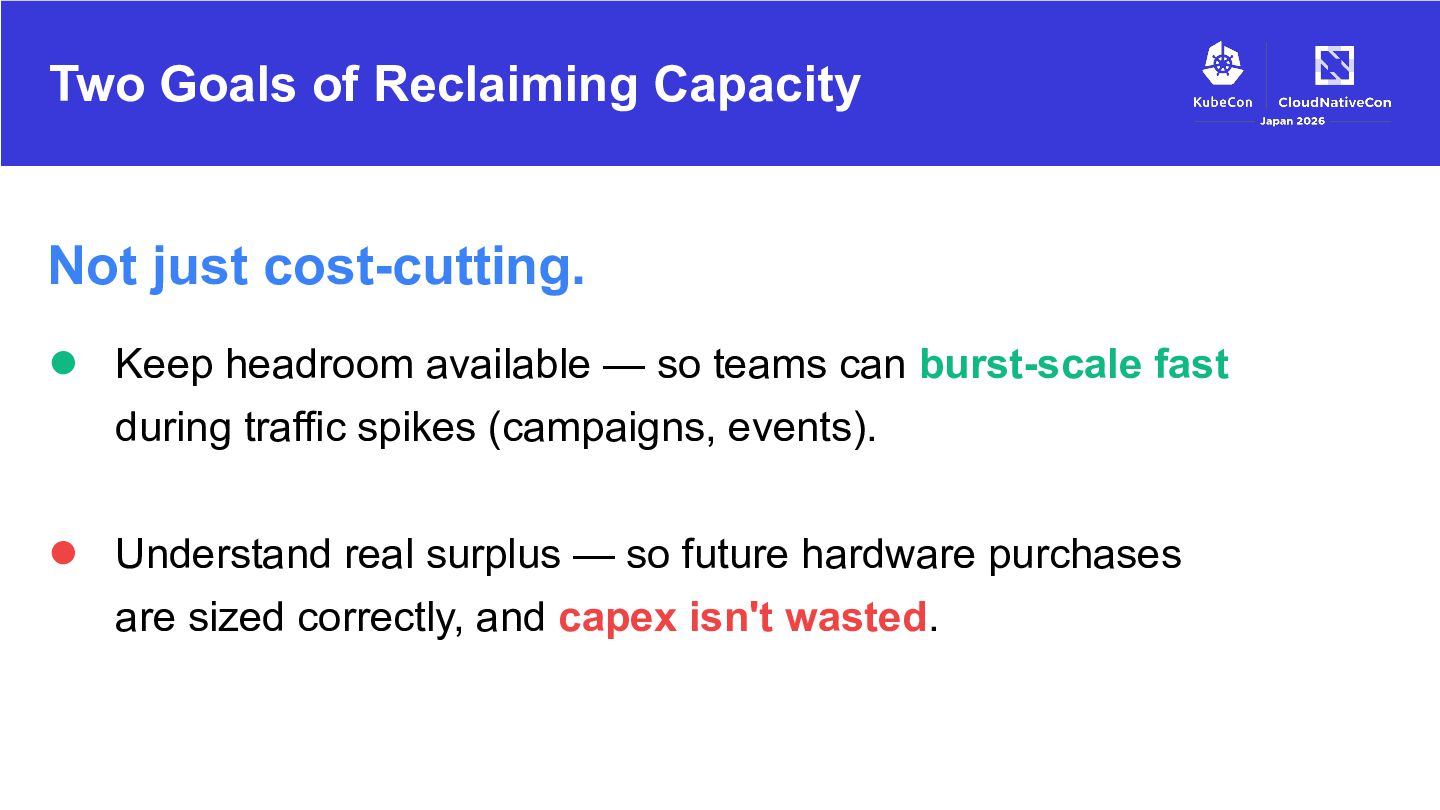
headroom available — so teams can burst-scale fast during traffic spikes (campaigns, events). • Understand real surplus — so future hardware purchases are sized correctly, and capex isn't wasted.
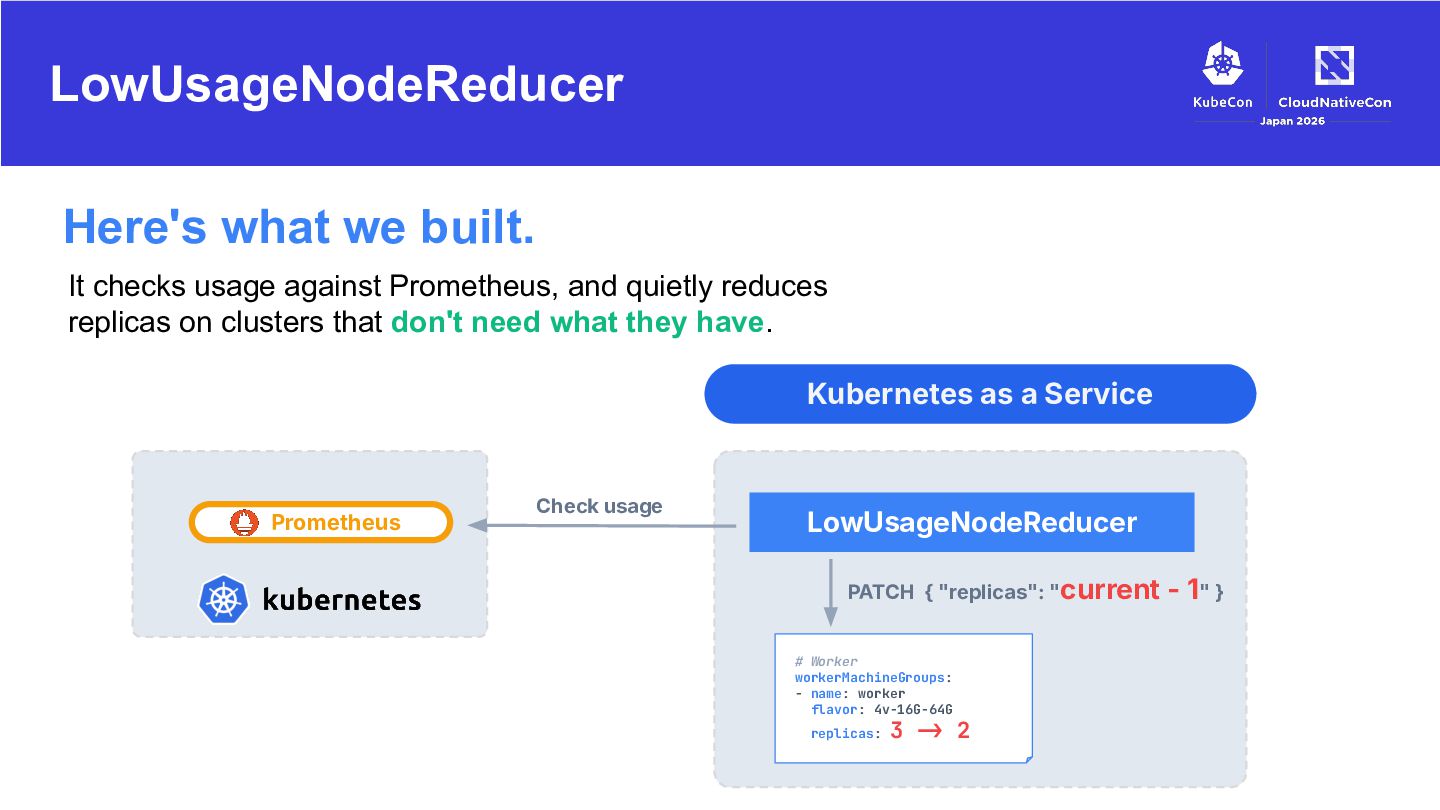
and quietly reduces replicas on clusters that don't need what they have. Kubernetes as a Service Prometheus Check usage LowUsageNodeReducer PATCH { "replicas": "current - 1" } # Worker workerMachineGroups: - name: worker flavor: 4v-16G-64G replicas: 3 !> 2
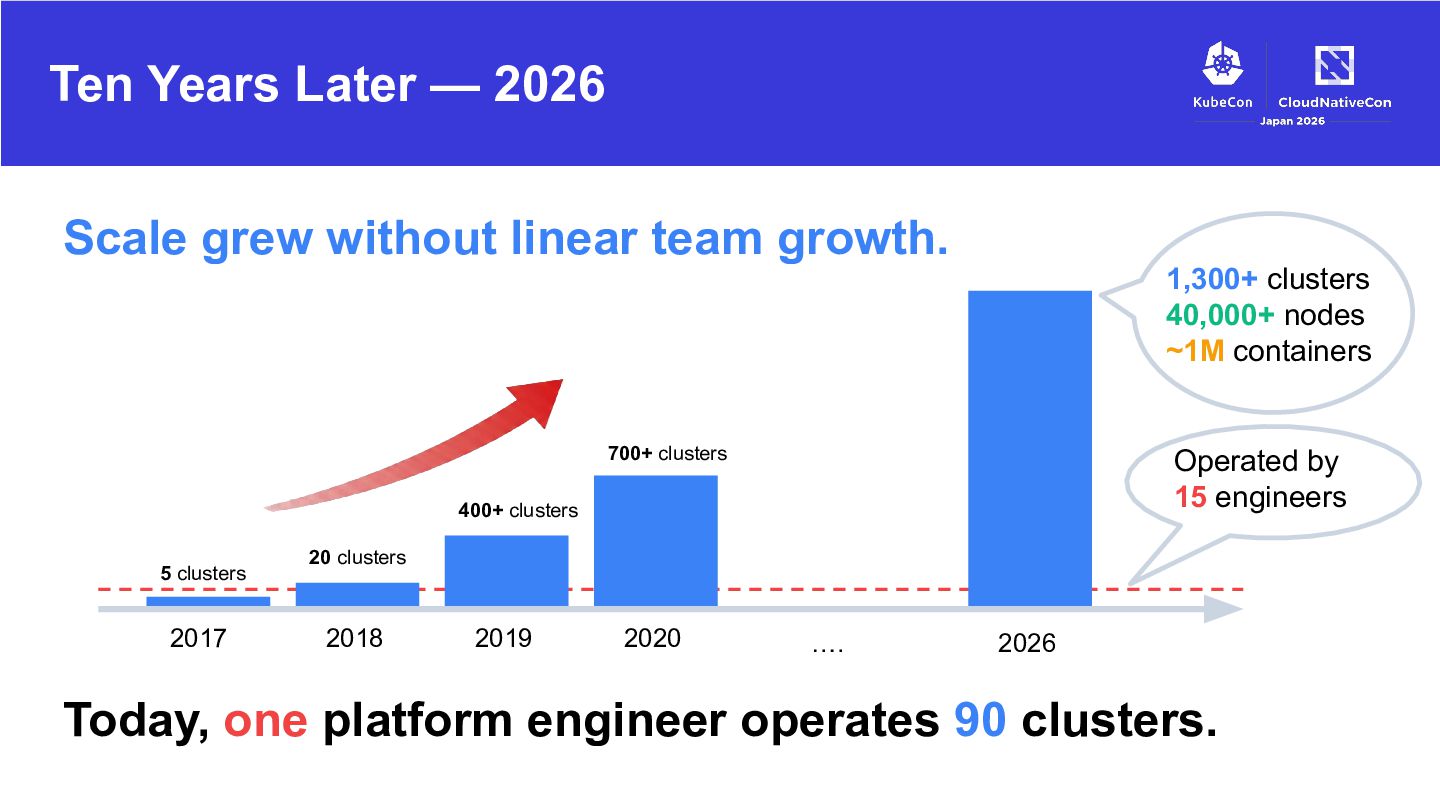
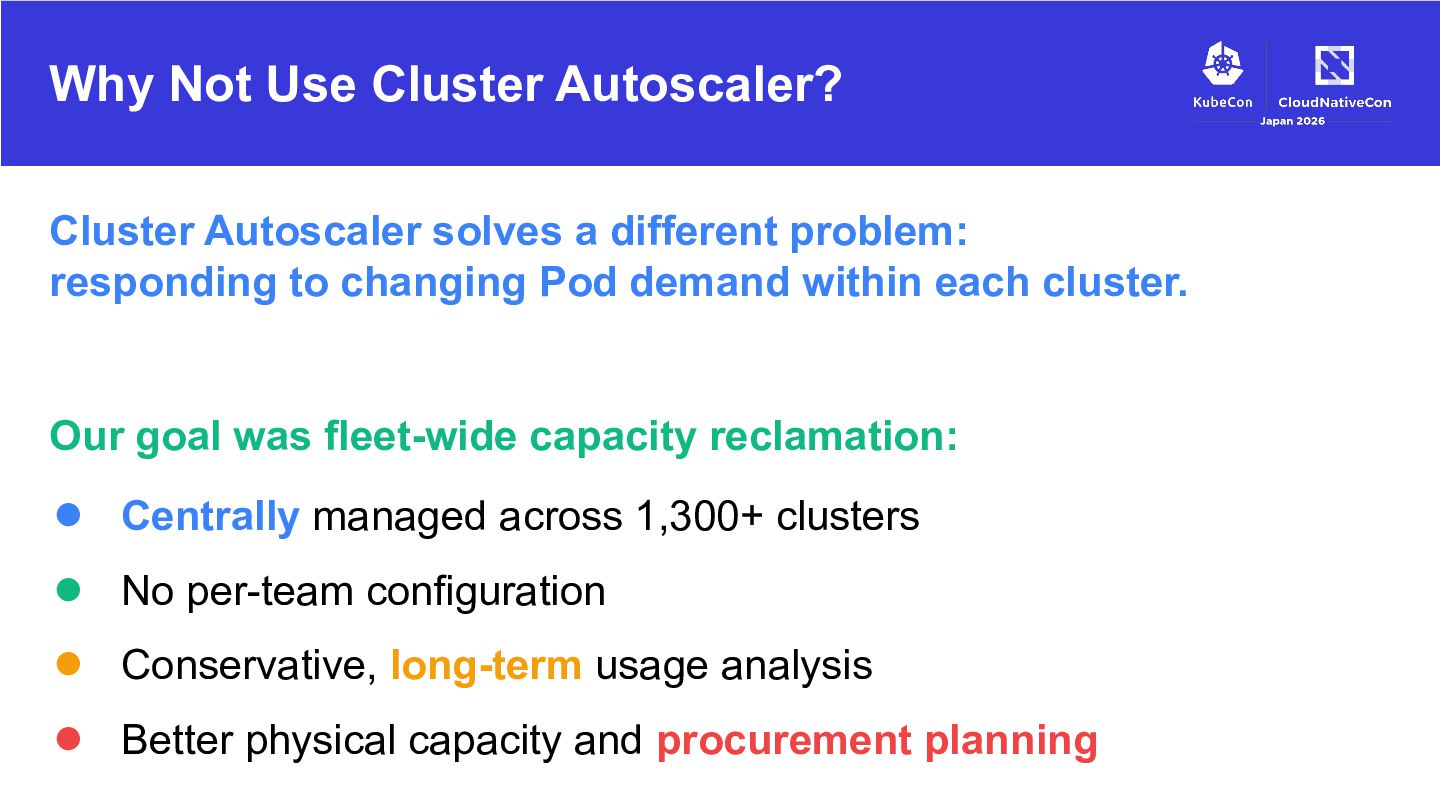
problem: responding to changing Pod demand within each cluster. Our goal was fleet-wide capacity reclamation: • Centrally managed across 1,300+ clusters • No per-team configuration • Conservative, long-term usage analysis • Better physical capacity and procurement planning
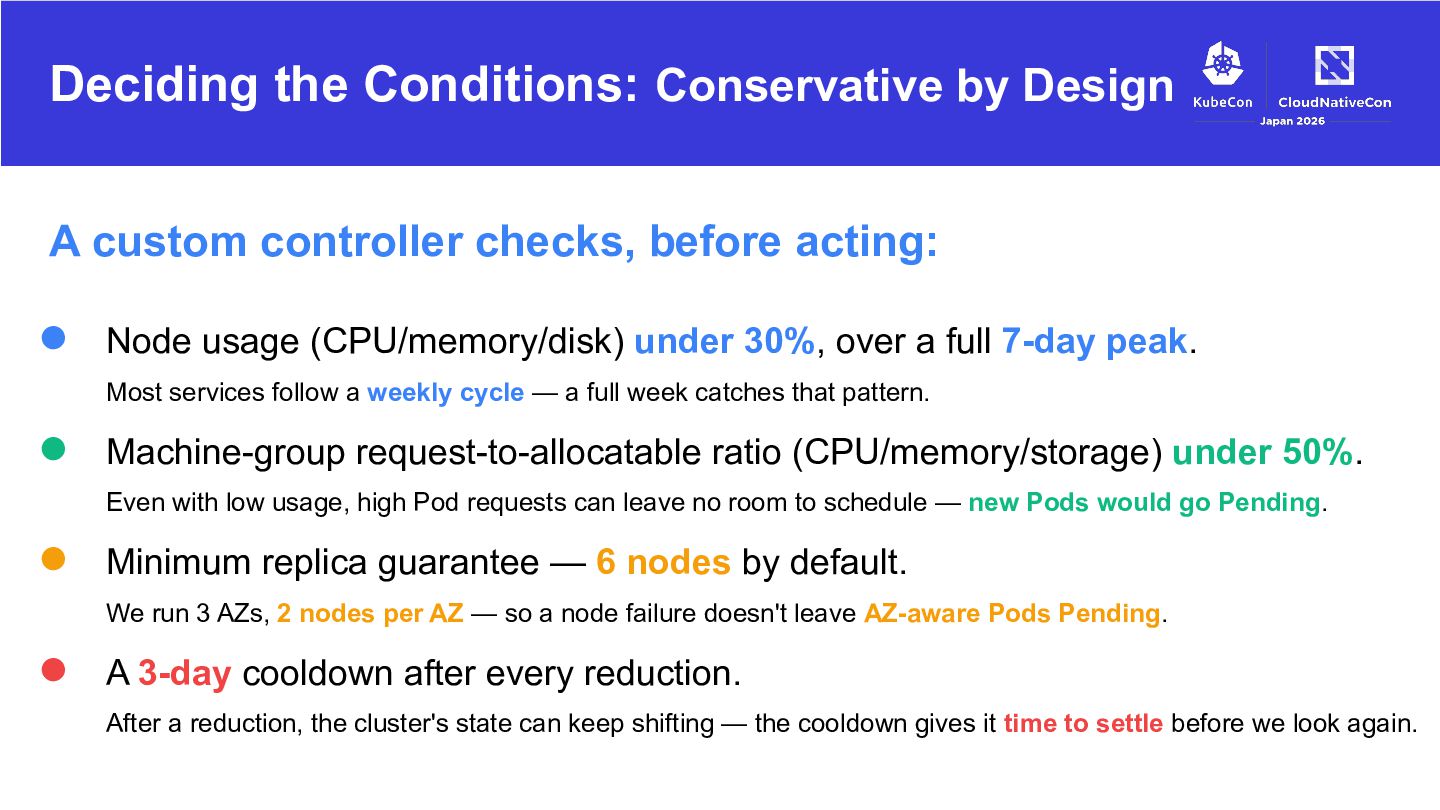
before acting: • Node usage (CPU/memory/disk) under 30%, over a full 7-day peak. Most services follow a weekly cycle — a full week catches that pattern. • Machine-group request-to-allocatable ratio (CPU/memory/storage) under 50%. Even with low usage, high Pod requests can leave no room to schedule — new Pods would go Pending. • Minimum replica guarantee — 6 nodes by default. We run 3 AZs, 2 nodes per AZ — so a node failure doesn't leave AZ-aware Pods Pending. • A 3-day cooldown after every reduction. After a reduction, the cluster's state can keep shifting — the cooldown gives it time to settle before we look again.
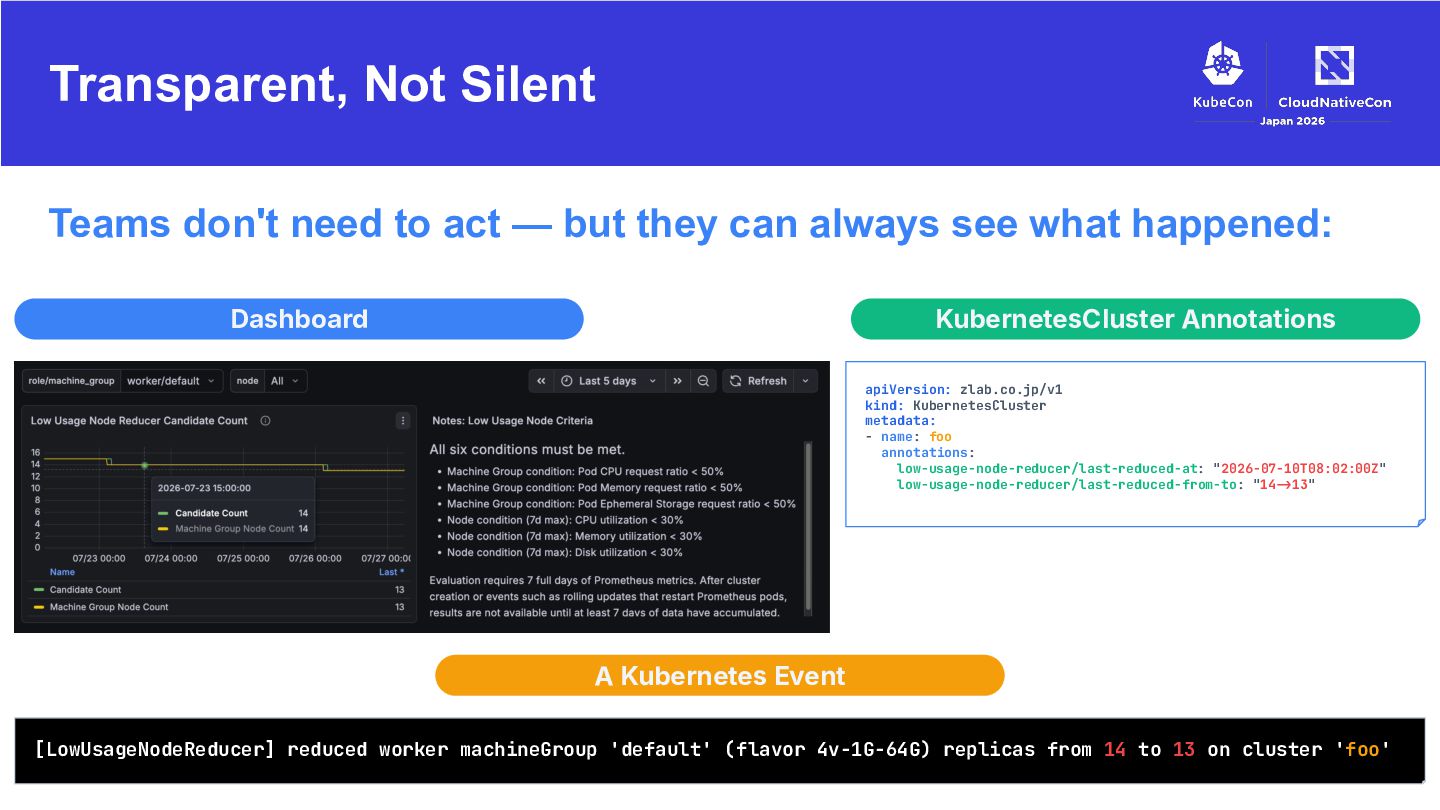
they can always see what happened: Dashboard KubernetesCluster Annotations apiVersion: zlab.co.jp/v1 kind: KubernetesCluster metadata: - name: foo annotations: low-usage-node-reducer/last-reduced-at: "2026-07-10T08:02:00Z" low-usage-node-reducer/last-reduced-from-to: "14!>13" A Kubernetes Event [LowUsageNodeReducer] reduced worker machineGroup 'default' (flavor 4v-1G-64G) replicas from 14 to 13 on cluster 'foo'
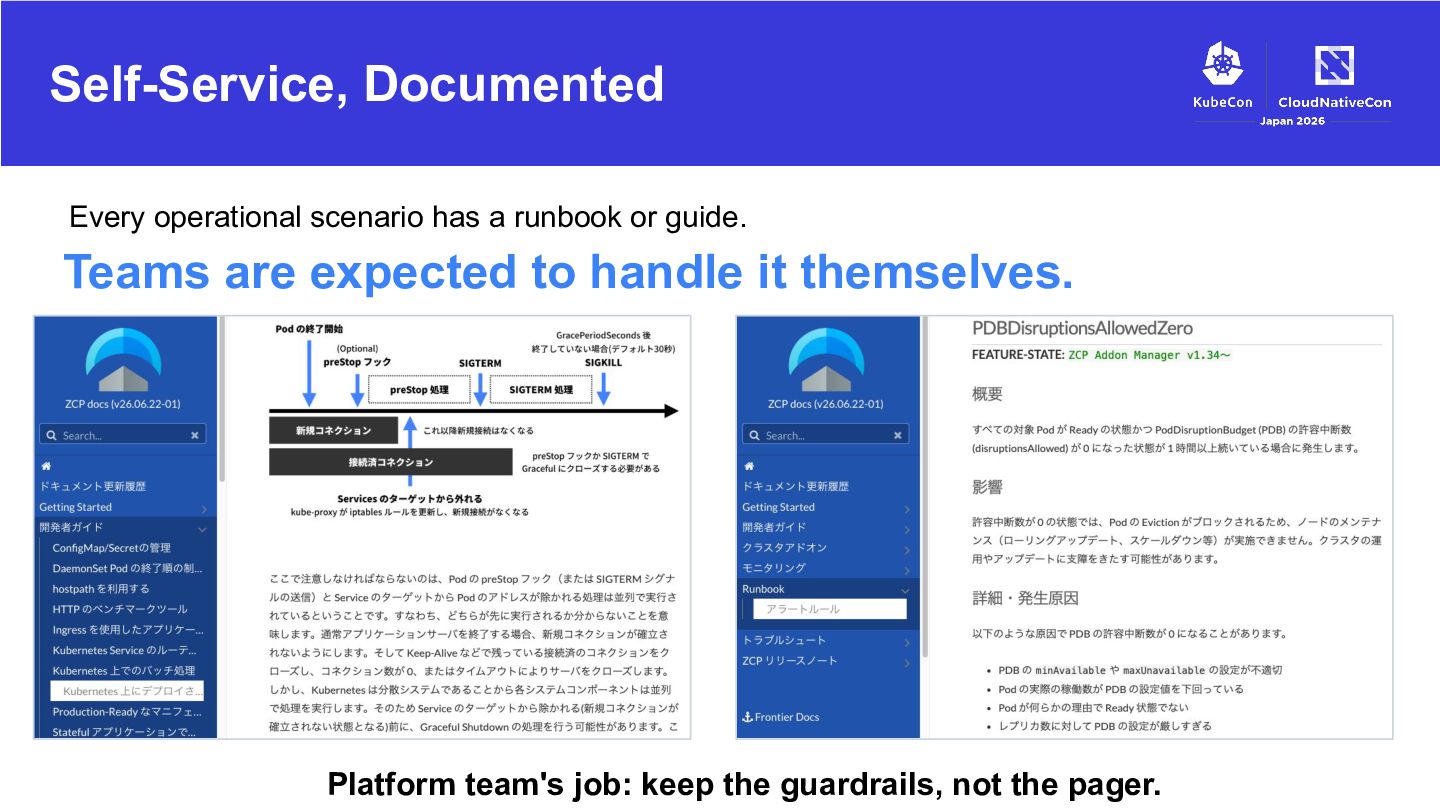
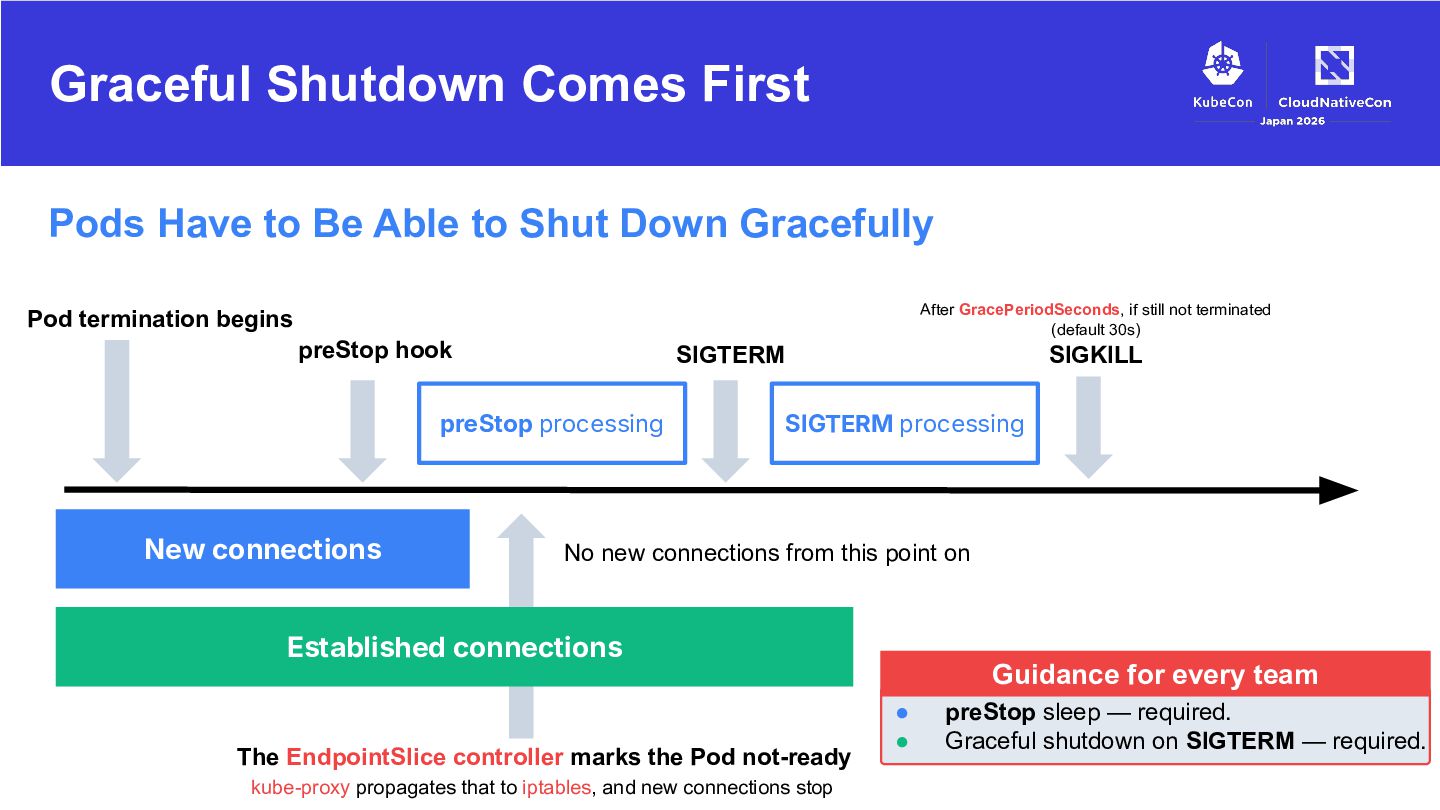
Shut Down Gracefully After GracePeriodSeconds, if still not terminated (default 30s) Pod termination begins preStop hook SIGTERM preStop processing New connections SIGKILL SIGTERM processing No new connections from this point on Established connections The EndpointSlice controller marks the Pod not-ready kube-proxy propagates that to iptables, and new connections stop Guidance for every team • • preStop sleep — required. Graceful shutdown on SIGTERM — required.
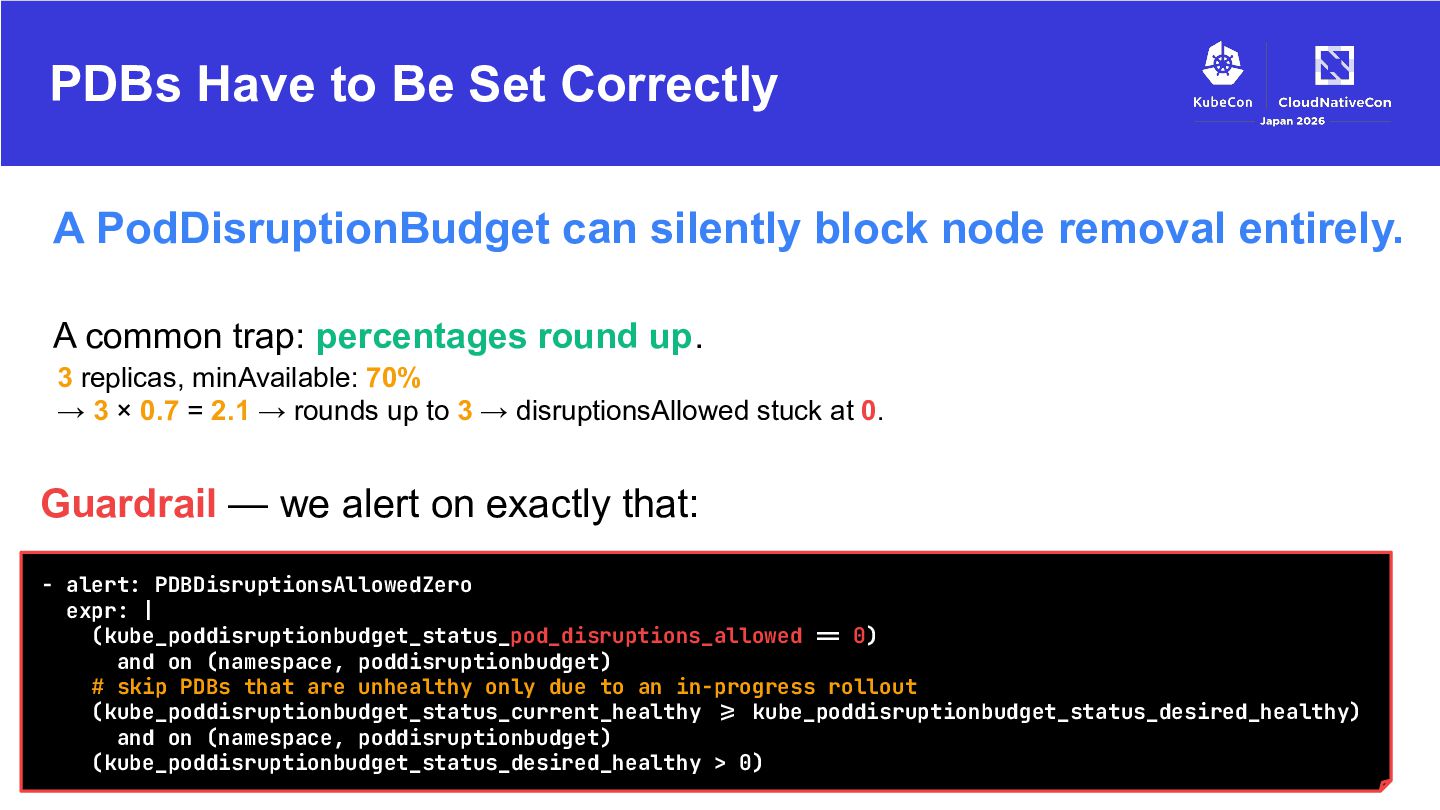
block node removal entirely. A common trap: percentages round up. 3 replicas, minAvailable: 70% → 3 × 0.7 = 2.1 → rounds up to 3 → disruptionsAllowed stuck at 0. Guardrail — we alert on exactly that: - alert: PDBDisruptionsAllowedZero expr: | (kube_poddisruptionbudget_status_pod_disruptions_allowed != 0) and on (namespace, poddisruptionbudget) # skip PDBs that are unhealthy only due to an in-progress rollout (kube_poddisruptionbudget_status_current_healthy != kube_poddisruptionbudget_status_desired_healthy) and on (namespace, poddisruptionbudget) (kube_poddisruptionbudget_status_desired_healthy > 0)
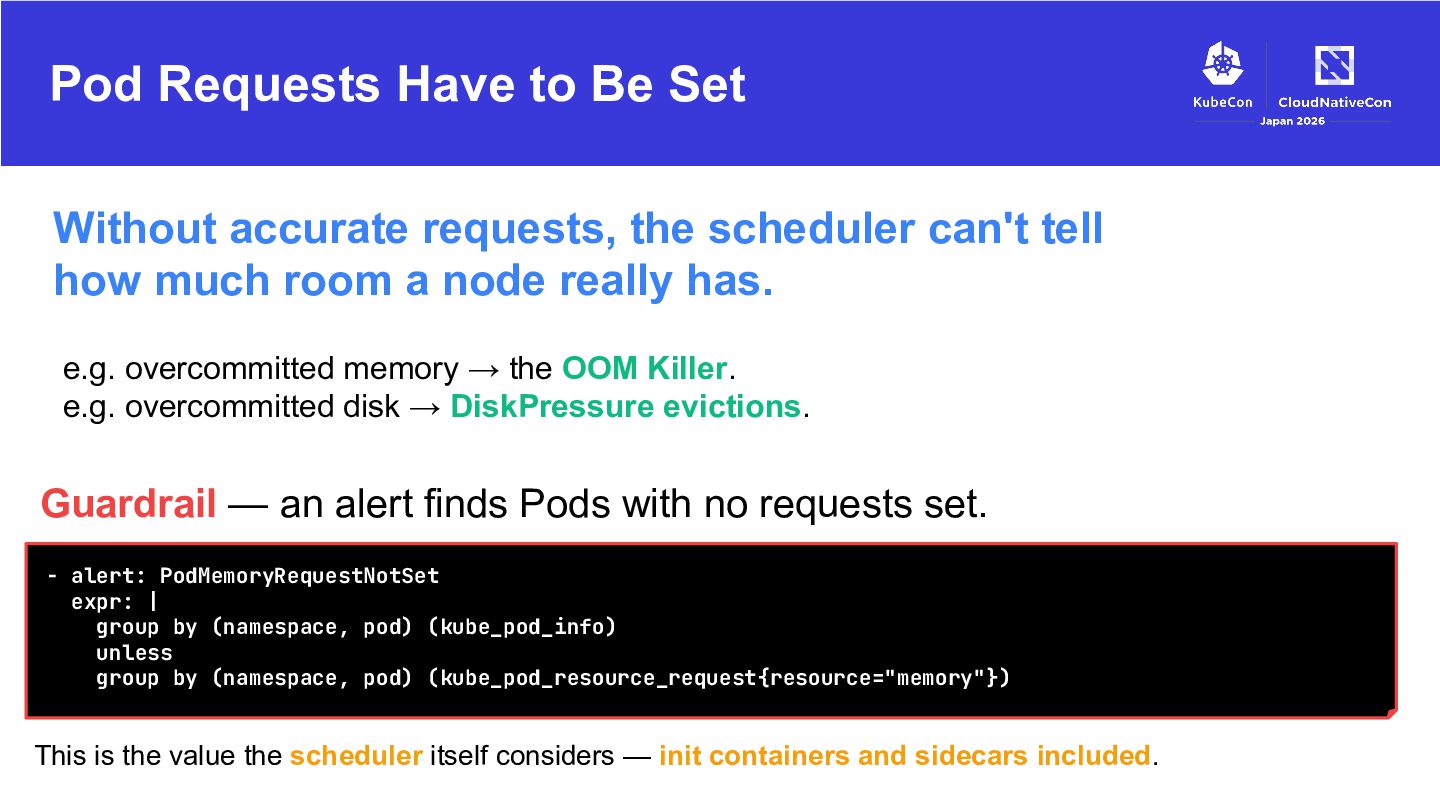
scheduler can't tell how much room a node really has. e.g. overcommitted memory → the OOM Killer. e.g. overcommitted disk → DiskPressure evictions. Guardrail — an alert finds Pods with no requests set. - alert: PodMemoryRequestNotSet expr: | group by (namespace, pod) (kube_pod_info) unless group by (namespace, pod) (kube_pod_resource_request{resource="memory"}) This is the value the scheduler itself considers — init containers and sidecars included.
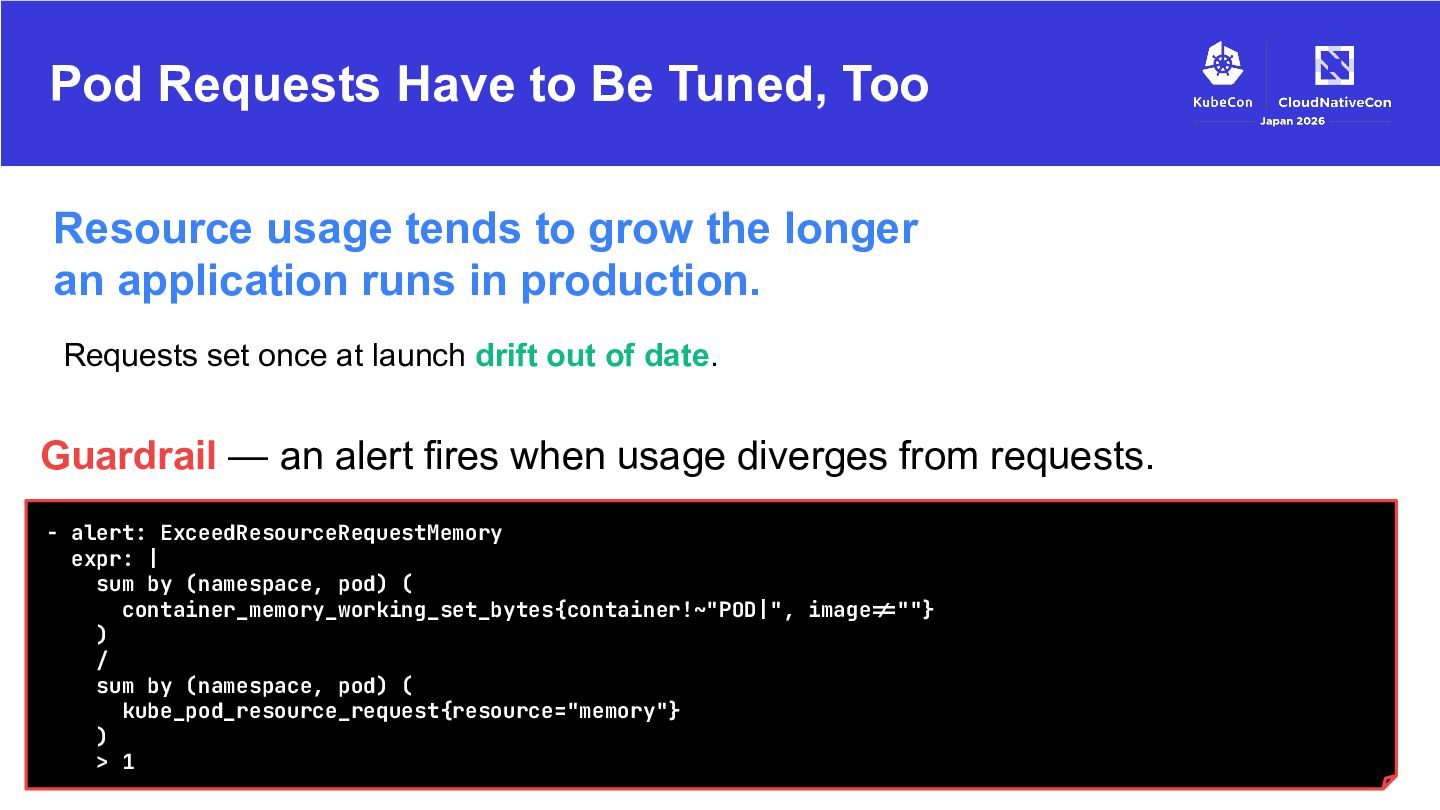
to grow the longer an application runs in production. Requests set once at launch drift out of date. Guardrail — an alert fires when usage diverges from requests. - alert: ExceedResourceRequestMemory expr: | sum by (namespace, pod) ( container_memory_working_set_bytes{container!~"POD|", image!=""} ) / sum by (namespace, pod) ( kube_pod_resource_request{resource="memory"} ) > 1
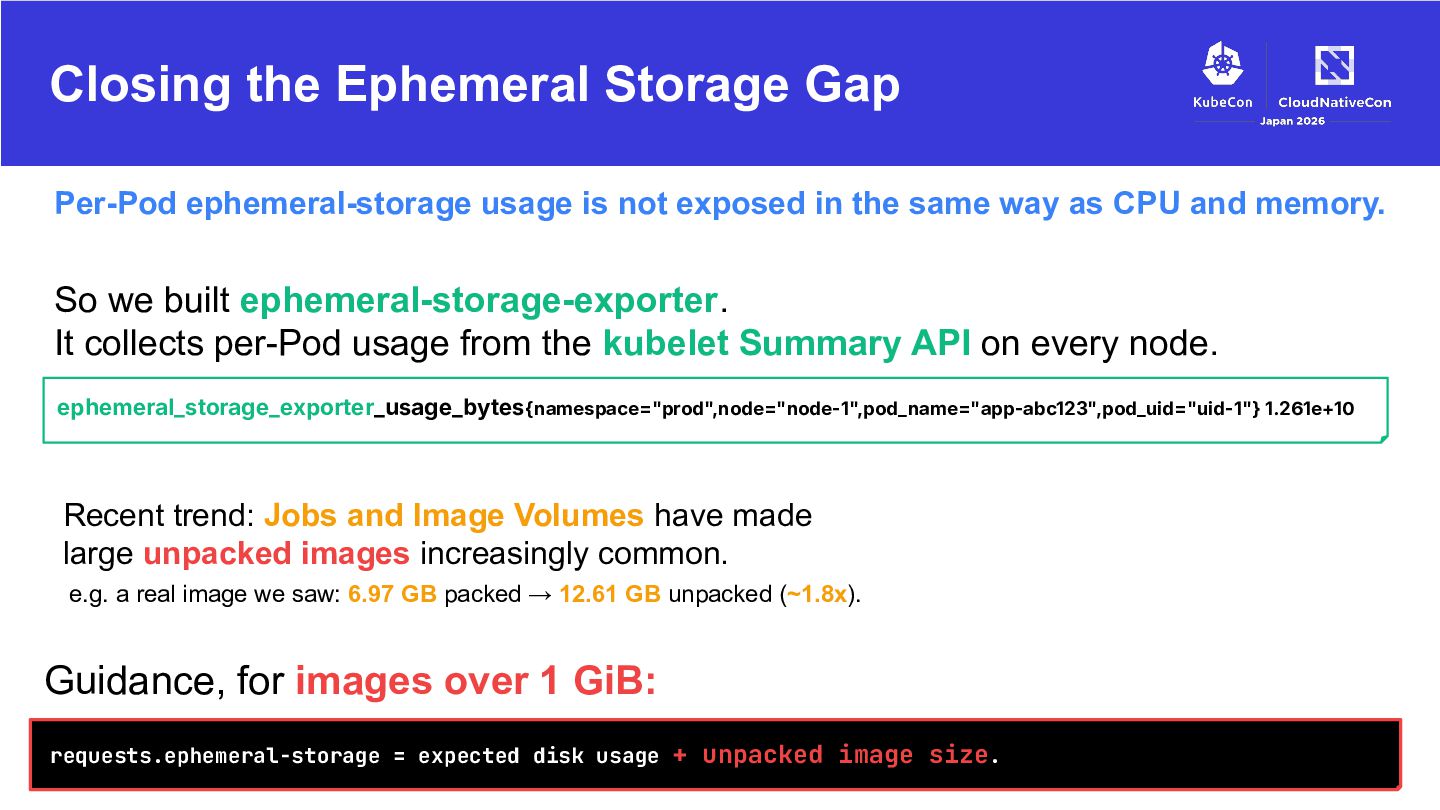
exposed in the same way as CPU and memory. So we built ephemeral-storage-exporter. It collects per-Pod usage from the kubelet Summary API on every node. ephemeral_storage_exporter_usage_bytes{namespace="prod",node="node-1",pod_name="app-abc123",pod_uid="uid-1"} 1.261e+10 Recent trend: Jobs and Image Volumes have made large unpacked images increasingly common. e.g. a real image we saw: 6.97 GB packed → 12.61 GB unpacked (~1.8x). Guidance, for images over 1 GiB: requests.ephemeral-storage = expected disk usage + unpacked image size.
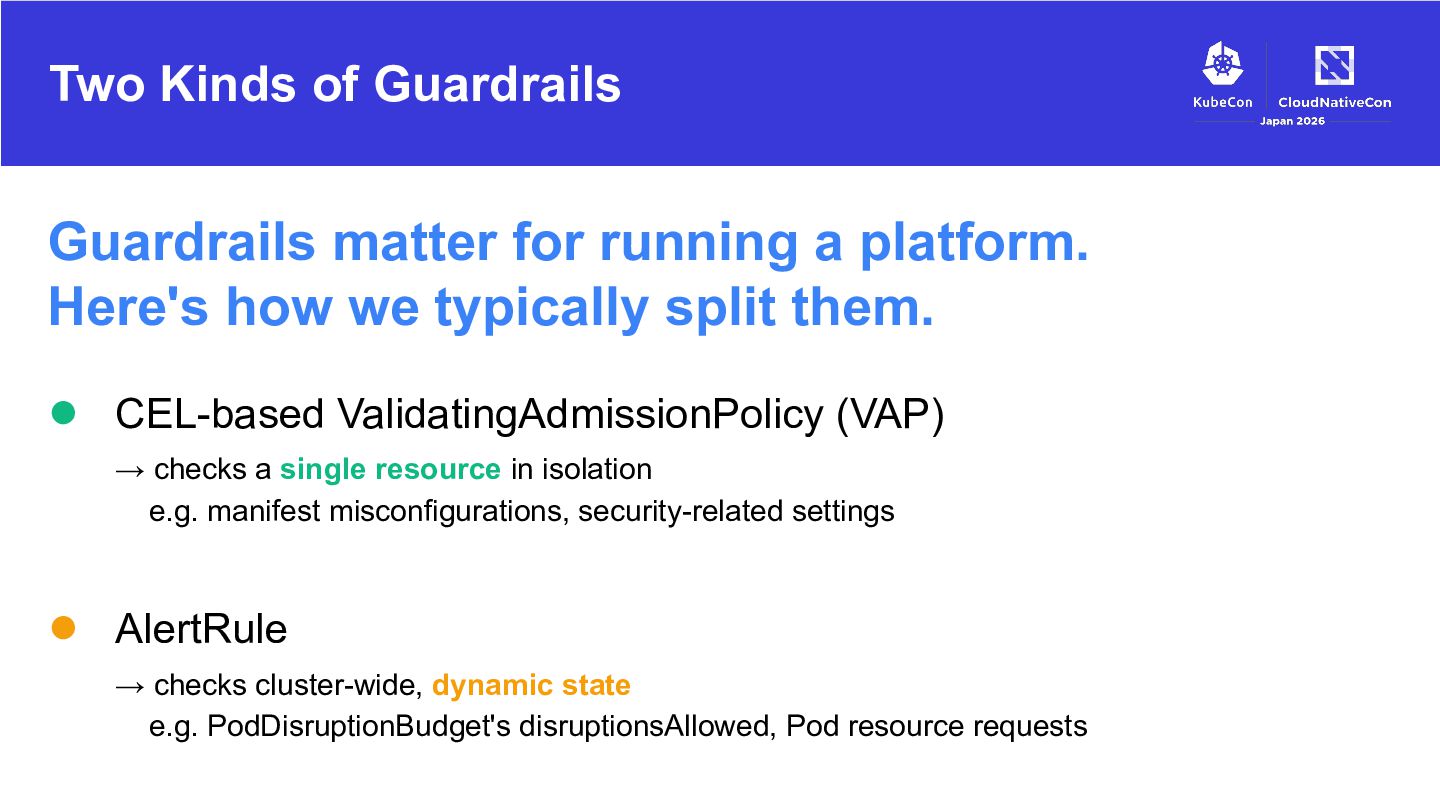
Here's how we typically split them. • CEL-based ValidatingAdmissionPolicy (VAP) → checks a single resource in isolation e.g. manifest misconfigurations, security-related settings • AlertRule → checks cluster-wide, dynamic state e.g. PodDisruptionBudget's disruptionsAllowed, Pod resource requests
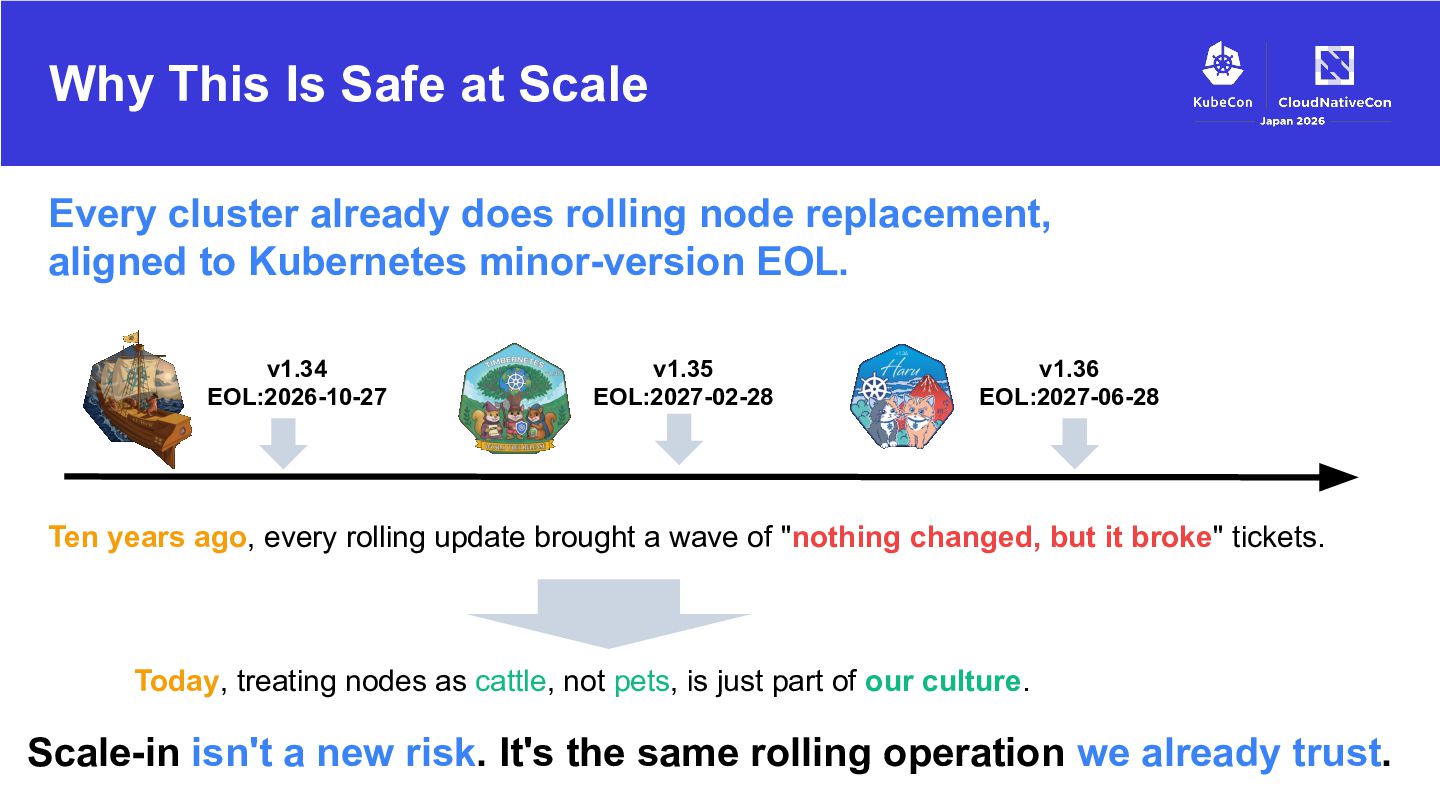
rolling node replacement, aligned to Kubernetes minor-version EOL. v1.34 EOL:2026-10-27 v1.35 EOL:2027-02-28 v1.36 EOL:2027-06-28 Ten years ago, every rolling update brought a wave of "nothing changed, but it broke" tickets. Today, treating nodes as cattle, not pets, is just part of our culture. Scale-in isn't a new risk. It's the same rolling operation we already trust.
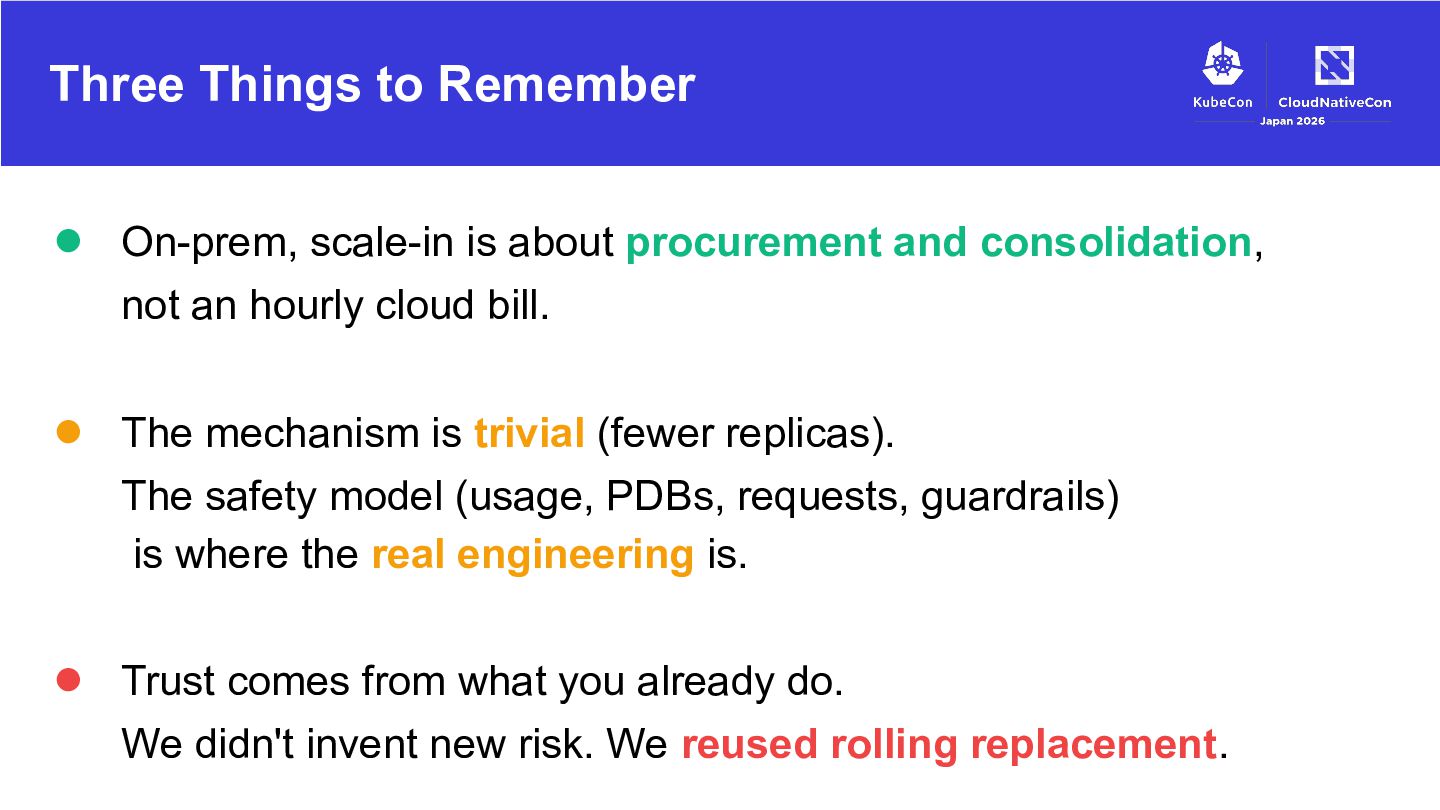
and consolidation, not an hourly cloud bill. • The mechanism is trivial (fewer replicas). The safety model (usage, PDBs, requests, guardrails) is where the real engineering is. • Trust comes from what you already do. We didn't invent new risk. We reused rolling replacement.


 yosshi_
 recruitengineers
 jtakeda
 mohab1
 yamanoku
 hiracky16
 pfn
pfn
 y0hgi
y0hgi
 takanorip
 ivry_presentationmaterials
 tokuty
 yahonda
 riyaamemiya
 brad_frost
 inesmontani
 bkeepers
 techseoconnect
 andyhume
 garrettdimon
 mayunak
 kneath
 honnibal
 reverentgeek
 aleyda
 apolaine