Upgrade to Pro — share decks privately, control downloads, hide ads and more …

ICSOFT2020 - Yuya Inagaki

ICSOFT2020 - Yuya Inagaki

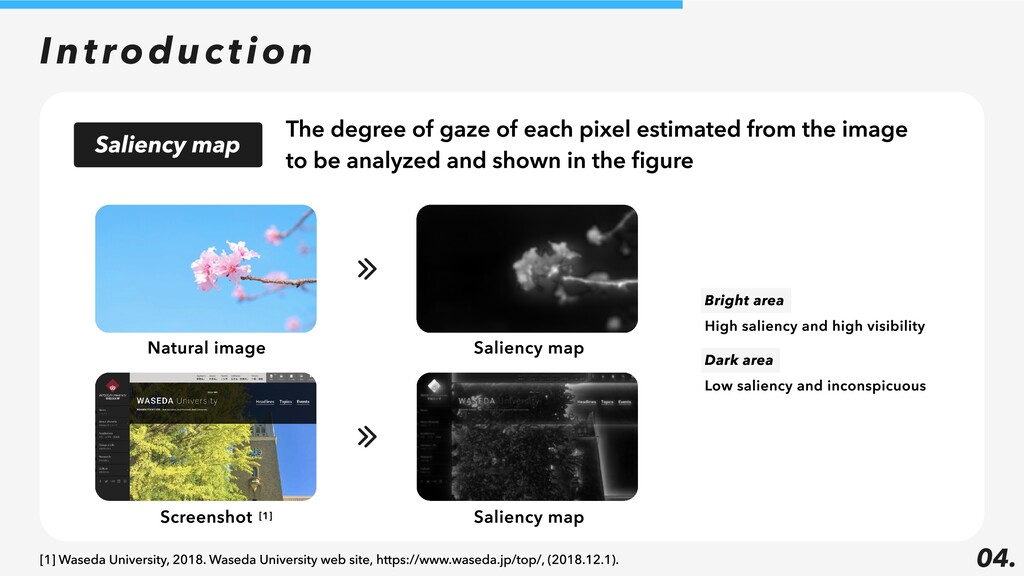
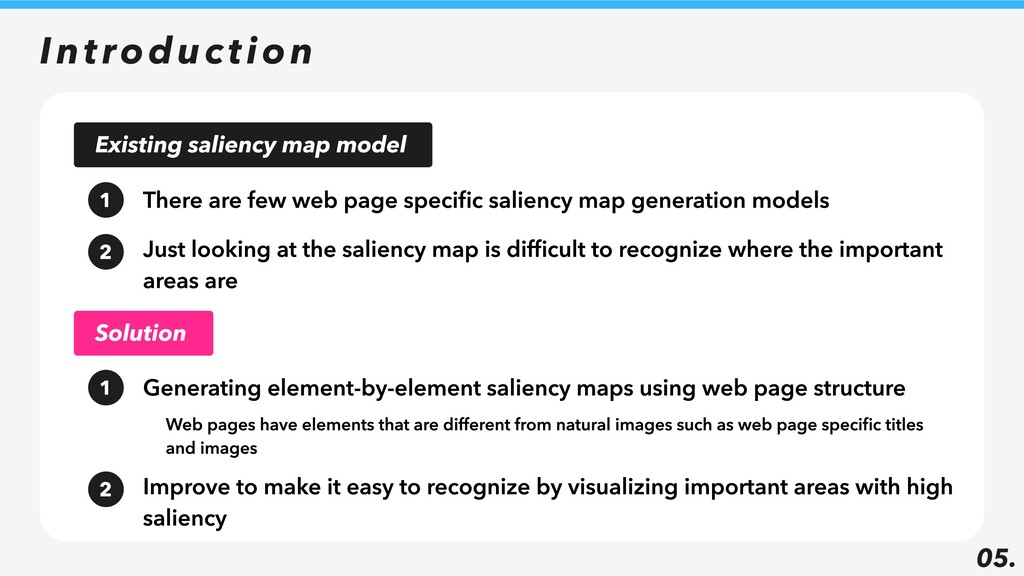
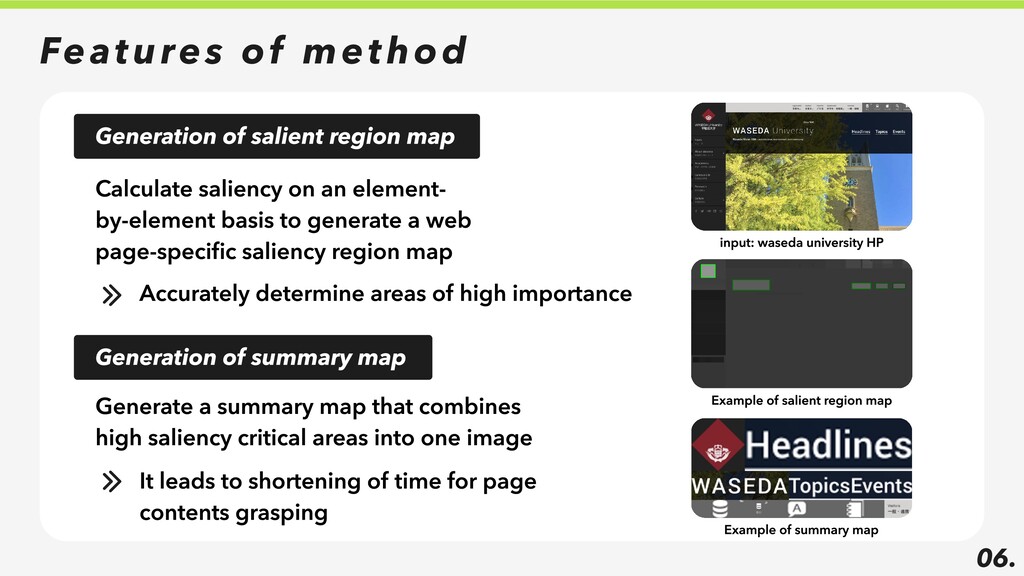
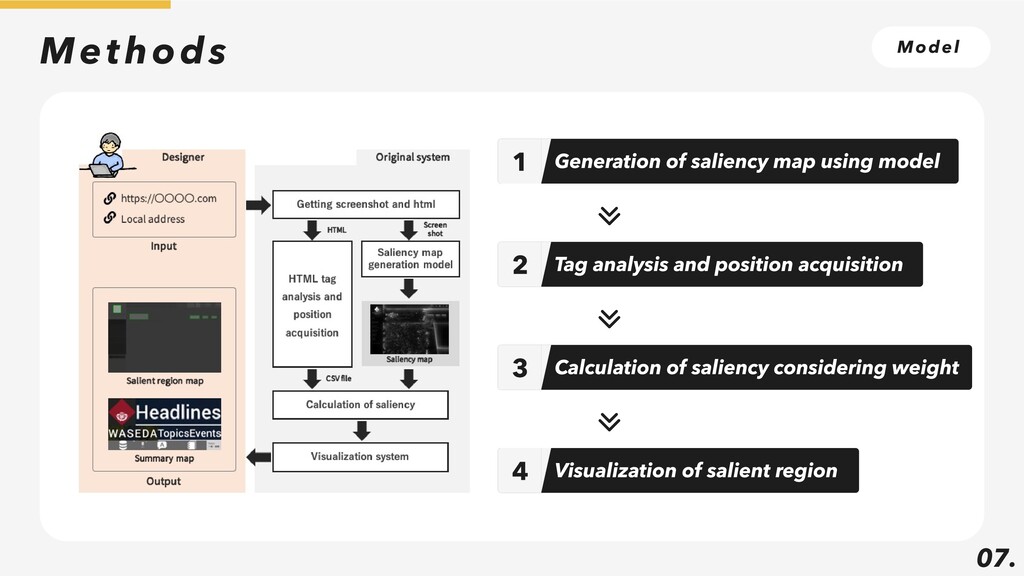
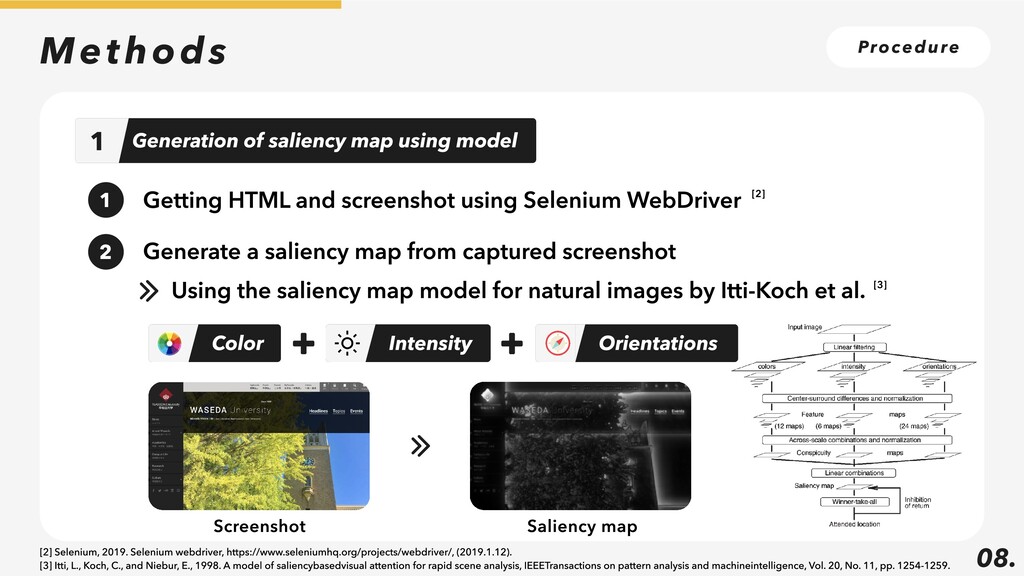
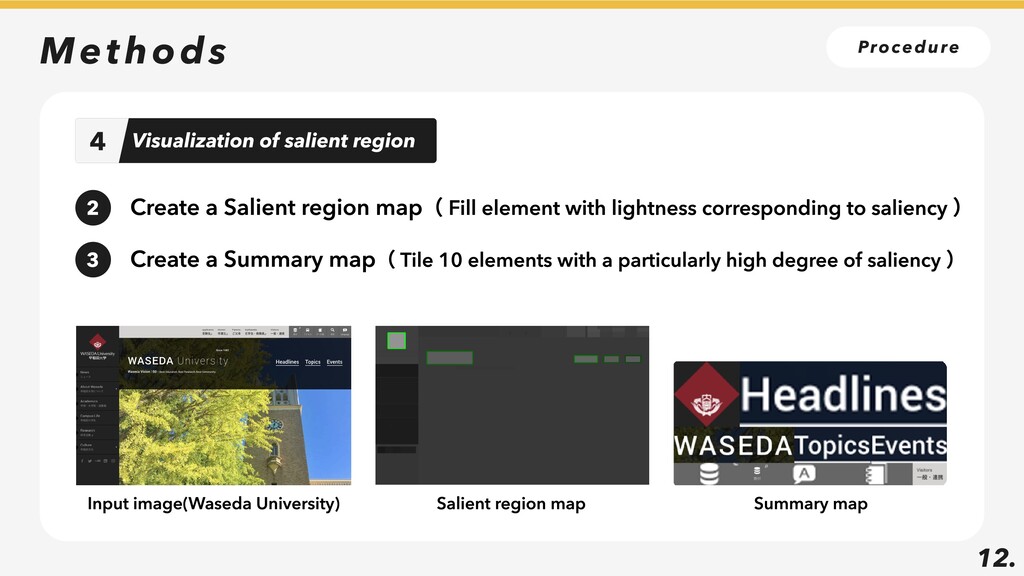
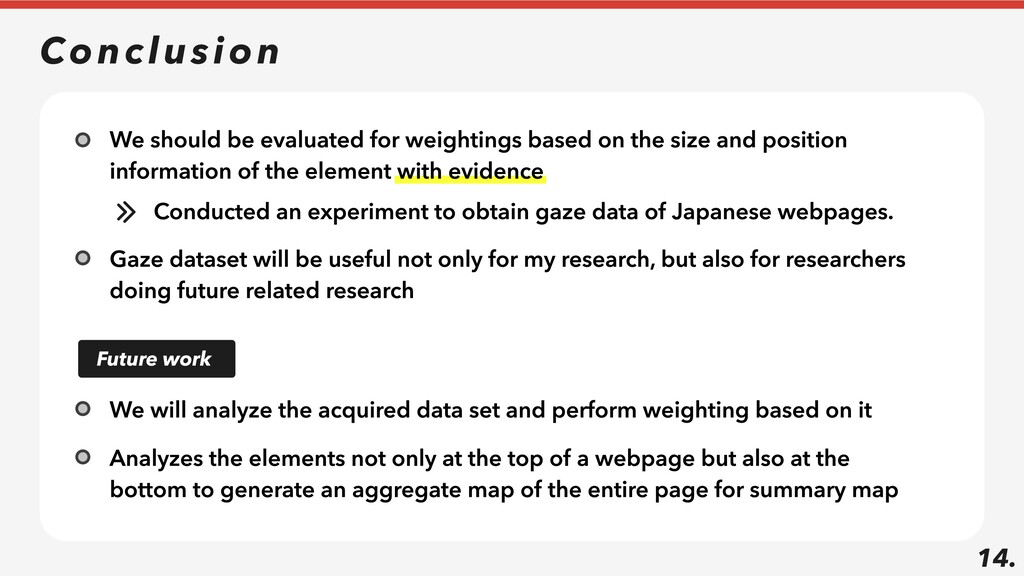
In this research, we propose a new visualization method for important areas of a webpage by calculating the saliency in element units using a combination of the structure of the webpage and the saliency map at the development stage. By arranging important information in areas where attention is likely to be focused, users can easily find such information, leading to efficient user acquisition. In addition, a summary map that summarizes particularly important areas into one image should help grasp the page contents. Compared to a traditional saliency map, the visibility of important areas is easier to see, allowing designers to accurately determine which elements are likely to be noticed when a user views a webpage during the development phase.

https://www.insticc.org/node/TechnicalProgram/icsoft/2020/presentationDetails/98855

Yuya Ina

July 09, 2020
Tweet

More Decks by Yuya Ina

Other Decks in Research

Transcript

  1. Visualization Method of Important Regions by Combination of Webpage Structures

    and Saliency Maps 2020.07.09 Yuya Inagaki† Hajime Iwata†† Junko Shirogane††† Yoshiaki Fukazawa† Waseda University† Kanagawa Institute of Technology†† Tokyo Woman’s Christian University††† ICSOFT2020
  2. 01 02. Introductiuon Features of method Method 1. Model 2.

    Procedure User’s gaze data experiment Conclusion 02 03 04 05 OUTLINE
  3. 03. I n t r o d u c t

    i o n There are many web pages with good design but low usability It tends to lower the quality of service and users tend to leave the page Problem To present a saliency map at the development stage that shows the ease of attracting person's gaze Solution - Is not the intention of the designer exactly reflected? - The place where the designer and the user are looking is shifted? Factor
  4. 04. I n t r o d u c t

    i o n The degree of gaze of each pixel estimated from the image to be analyzed and shown in the figure Natural image Saliency map Bright area High saliency and high visibility Dark area Low saliency and inconspicuous Screenshot [1] Saliency map Saliency map [1] Waseda University, 2018. Waseda University web site, https://www.waseda.jp/top/, (2018.12.1).
  5. 05. I n t r o d u c t

    i o n Solution There are few web page specific saliency map generation models Just looking at the saliency map is difficult to recognize where the important areas are Existing saliency map model 1 2 Generating element-by-element saliency maps using web page structure Web pages have elements that are different from natural images such as web page specific titles and images Improve to make it easy to recognize by visualizing important areas with high saliency 1 2
  6. 06. Fe a t u r e s o f

    m e t h o d Calculate saliency on an element- by-element basis to generate a web page-specific saliency region map Accurately determine areas of high importance input: waseda university HP Example of salient region map Example of summary map Generation of salient region map Generate a summary map that combines high saliency critical areas into one image It leads to shortening of time for page contents grasping Generation of summary map
  7. 07. M e t h o d s Generation of

    saliency map using model 1 Calculation of saliency considering weight 3 Visualization of salient region 4 Tag analysis and position acquisition 2 M o d e l
  8. 08. M e t h o d s Screenshot Saliency

    map Getting HTML and screenshot using Selenium WebDriver Generate a saliency map from captured screenshot Using the saliency map model for natural images by Itti-Koch et al. 1 2 Generation of saliency map using model 1 Pr o c e d u r e Orientations Color Intensity [2] [3] [2] Selenium, 2019. Selenium webdriver, https://www.seleniumhq.org/projects/webdriver/, (2019.1.12). [3] Itti, L., Koch, C., and Niebur, E., 1998. A model of saliencybased visual attention for rapid scene analysis, IEEE Transactions on pattern analysis and machine intelligence, Vol. 20, No. 11, pp. 1254-1259.
  9. 09. M e t h o d s Getting position

    and size of tag element using Selenium WebDriver Tag element : 1 Pr o c e d u r e Tag analysis and position acquisition 2 <div> <h1> <h2> <h3> <span> <img>
  10. 10. M e t h o d s [4] webpage

    saliency heatmap Calculation of saliency considering weight 3 Get the color average of the saliency map of each element area and make it a saliency level Weighting of saliency by location information and element size 1 2 Pr o c e d u r e Top-left bias Center bias Element size [4] Shen, C., and Zhao, Q., 2014. Webpage saliency, In European conference on computer vision, pp. 33-46, Springer.
  11. 11. M e t h o d s Visualization of

    salient region 4 Create a ranking of element saliency level Generate salient region map and summary map based on ranking (a) Screenshot of sample web page created for testing (b) Part of the structure of a sample web page created for test 1 Pr o c e d u r e
  12. 12. M e t h o d s Visualization of

    salient region 4 Pr o c e d u r e Create a Salient region map( Fill element with lightness corresponding to saliency ) 2 Create a Summary map( Tile 10 elements with a particularly high degree of saliency ) 3 Input image(Waseda University) Salient region map Summary map
  13. 13. U s e r ’s g a z e

    d a t a e x p e r i m e n t Original Dataset 270 webpages 35 subjects 27 categories based on “ikesai.com” calibration was performed for each subject 5 subjects per webpage 10 seconds each Basis for weighting by element position information and size is necessary Gaze datasets for webpages are limited and none are for a Japanese dataset 1 2
  14. 14. C o n c l u s i o

    n We should be evaluated for weightings based on the size and position information of the element with evidence Conducted an experiment to obtain gaze data of Japanese webpages. Gaze dataset will be useful not only for my research, but also for researchers doing future related research We will analyze the acquired data set and perform weighting based on it Analyzes the elements not only at the top of a webpage but also at the bottom to generate an aggregate map of the entire page for summary map Future work
  15. R e f e r e n c e m

    a t e r i a l
  16. U s e r ’s g a z e d

    a t a e x p e r i m e n t input image gazeplot heatmap State during the experiment 32px 64px Images with 64px or higher, which is the standard OS icon, display the saliency map as it is
  17. U s e r ’s g a z e d

    a t a e x p e r i m e n t single column 2 column 3 column multi column full screen Classify web pages into patterns and calculate weights for each Evaluated for weightings based on the size and position information of the element with evidence.