Upgrade to Pro
— share decks privately, control downloads, hide ads and more …
Speaker Deck
Features
Speaker Deck
PRO
Sign in
Sign up for free
Search
Search
SKL 2019 Intern Training Python Data Analysis
Search
Adam
March 05, 2019
Programming
55
0
Share
Embed
Copy iframe code
Copy JS code
Copy link
Start on current slide
SKL 2019 Intern Training Python Data Analysis
Data analysis and visualization introduction for 2019 intern.
Adam
March 05, 2019
More Decks by Adam
See All by Adam
Working Backward Reading Group
adamchang
0
110
Python Data Visualization - PyData Taipei Meetup
adamchang
0
250
SKL data analysis internship lecture 1
adamchang
0
150
SKL 2019 Intern Training Data Cleaning and Feature Engineering
adamchang
0
35
Other Decks in Programming
See All in Programming
PHP初心者セッション2026 〜生成AIでは見えない裏側を知る:今だからLAMPを通して仕組みを学ぶ〜
kashioka
0
660
自作OSでスライド発表する
uyuki234
1
3.9k
今さら聞けない .NET CLI
htkym
0
130
ここ半年くらいでAIに作らせたR用ツール
eitsupi
0
230
Lean は証明の正しさを確認するためだけのツールって思ってませんか?
inoueasei
1
110
The Bowling Game - From Imperative to Functional Programming - Part 1
philipschwarz
PRO
0
340
AI時代の仕事技芸論〜ソフトウェア開発で「遊ぶように働く」職人的熟達のすすめ(スクフェス仙台 2026バージョン)
kuranuki
0
720
AI時代、エンジニアはどう育つのか -未経験エンジニアの成長を間近で見て考えたこと-
thasu0123
0
150
Prismを使った型安全な暗号化_関数型まつり2026
_fhhmm
0
150
コーディングルールの鮮度を保ちたい for SRE NEXT 2026 / keep-fresh-go-internal-conventions-sre-next-2026
handlename
0
150
Claude Team Plan導入・ガイド
tk3fftk
0
240
ビデオ通話が繋がる0.2秒で何が起きているのか
supurazako
2
150
Featured
See All Featured
A better future with KSS
kneath
240
18k
The Illustrated Children's Guide to Kubernetes
chrisshort
51
53k
Rails Girls Zürich Keynote
gr2m
96
14k
Distributed Sagas: A Protocol for Coordinating Microservices
caitiem20
333
23k
Impact Scores and Hybrid Strategies: The future of link building
tamaranovitovic
0
340
Odyssey Design
rkendrick25
PRO
2
730
SERP Conf. Vienna - Web Accessibility: Optimizing for Inclusivity and SEO
sarafernandez
2
1.5k
Fight the Zombie Pattern Library - RWD Summit 2016
marcelosomers
234
17k
New Earth Scene 8
popppiees
3
2.4k
Product Roadmaps are Hard
iamctodd
55
12k
How to build an LLM SEO readiness audit: a practical framework
nmsamuel
1
810
4 Signs Your Business is Dying
shpigford
187
22k
Transcript
Data Analysis In Python 資料分析介紹 & Python實作
Yesterday recap! ‣ IDE In Python Development ‣ Markdown ‣
Data type ‣ Control Flow ‣ Exception ‣ Function ‣ Class ‣ Module ‣ Python Debugger
先介紹今天推薦的教材
為什麼要做資料分析? 幫助我們做更好的決策 - 我說的
–列⼦‧說符 「是故聖⼈⾒出以知入,觀往⽽知來,此其所 以先知之理也。」
TODAY’S AGENDA 1. Exploratory Data Analysis 2. Data Visualization 3.
How To Read Package Documents? 4. Pandas In Data Analysis 5. Homework
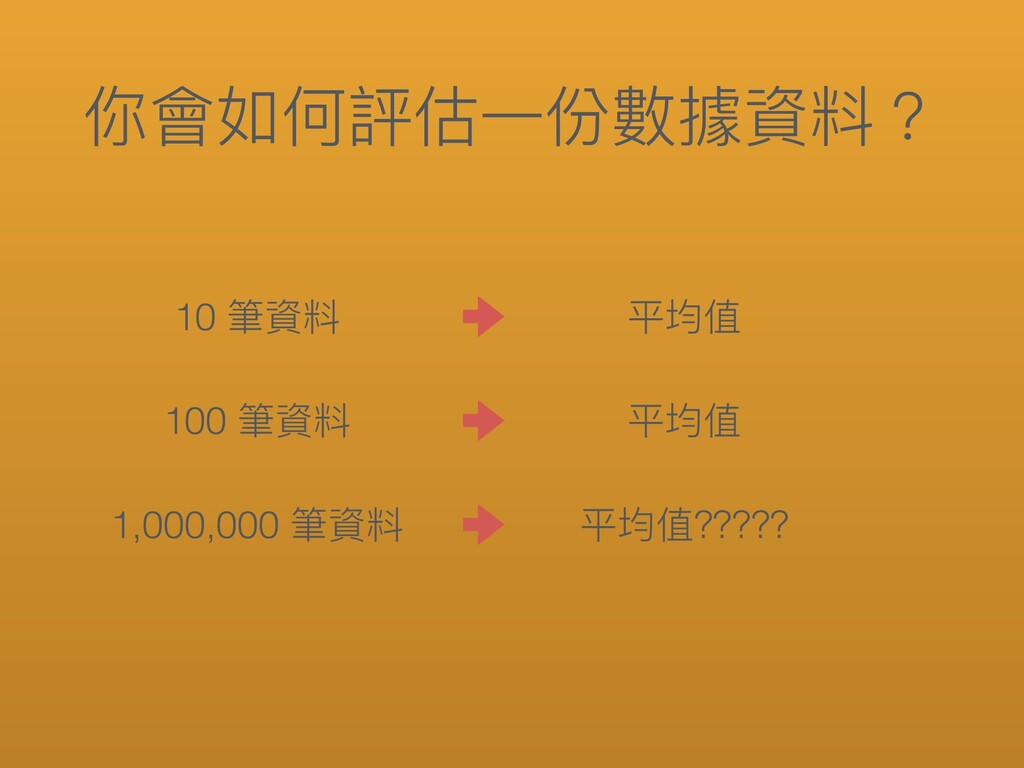
你會如何評估⼀份數據資料? 10 筆資料 100 筆資料 1,000,000 筆資料 平均值 平均值 平均值?????
分佈、分佈、分佈!
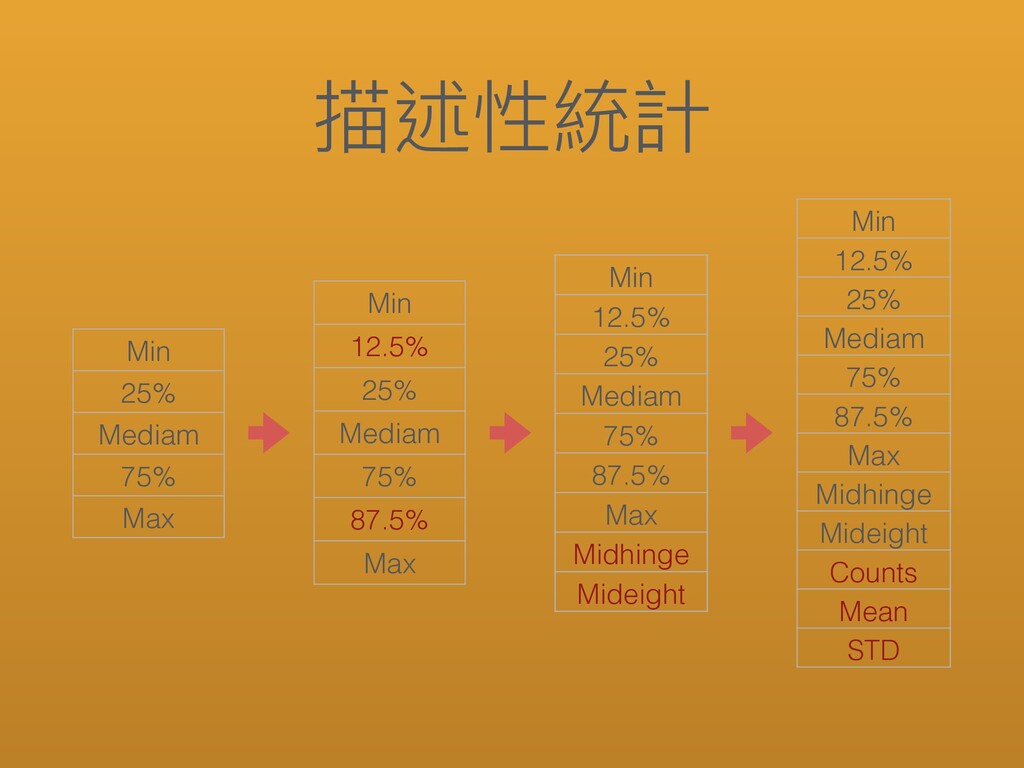
描述性統計 Min 25% Mediam 75% Max Min 12.5% 25% Mediam
75% 87.5% Max Min 12.5% 25% Mediam 75% 87.5% Max Midhinge Mideight Min 12.5% 25% Mediam 75% 87.5% Max Midhinge Mideight Counts Mean STD
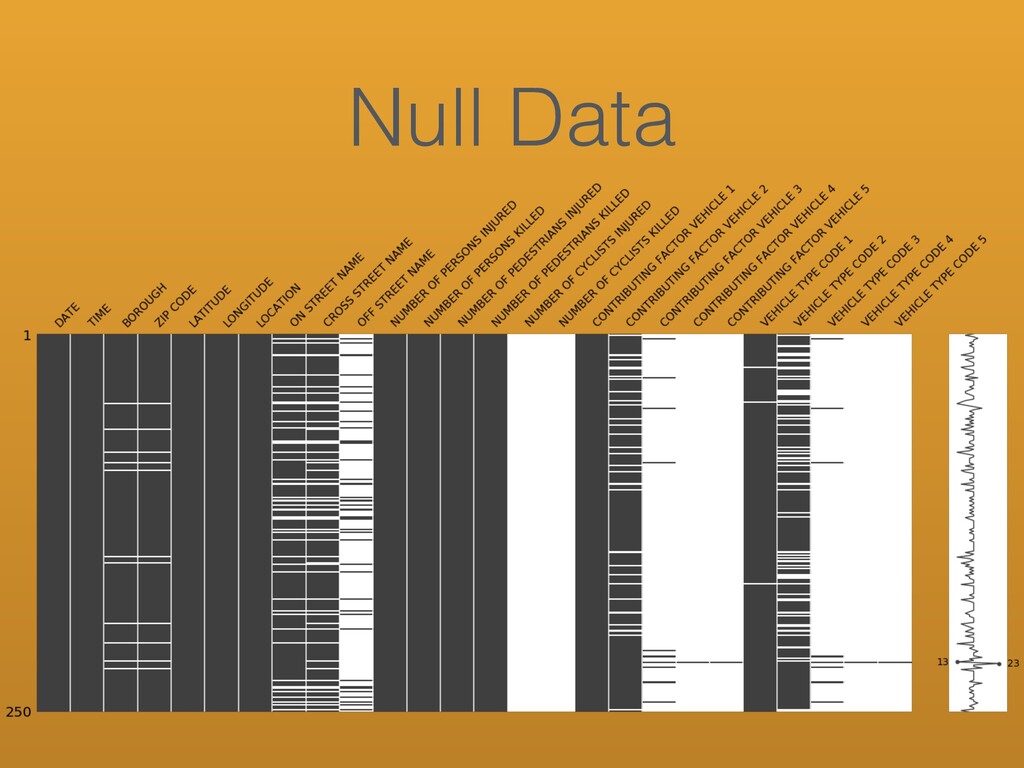
Null Data
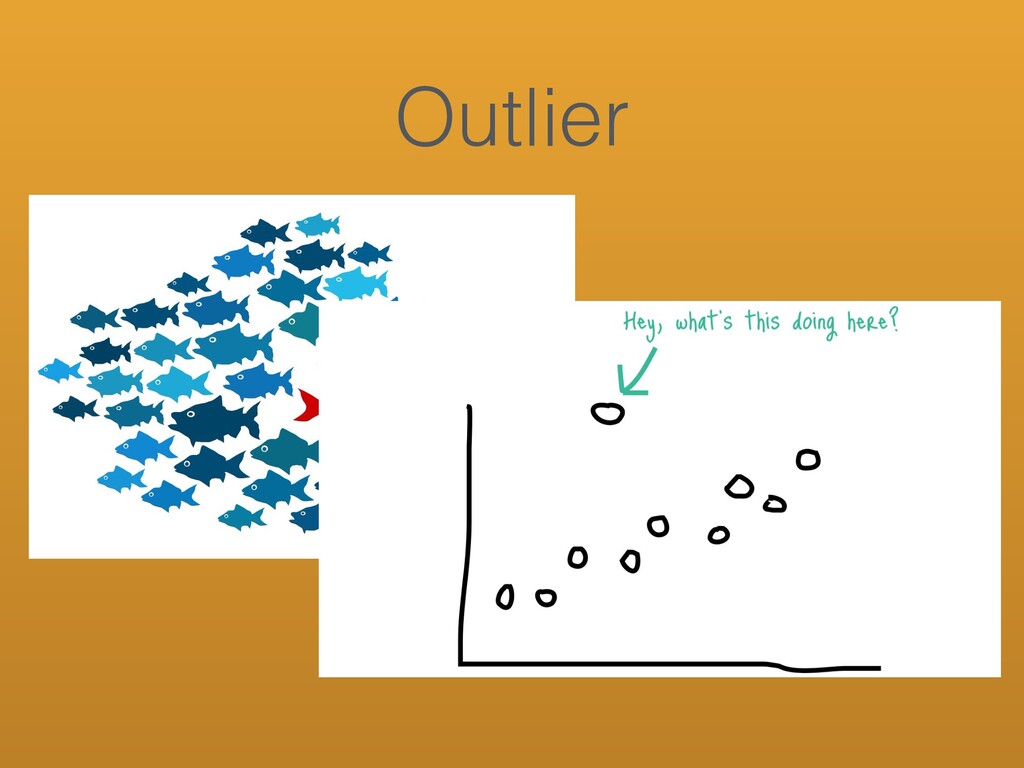
Outlier
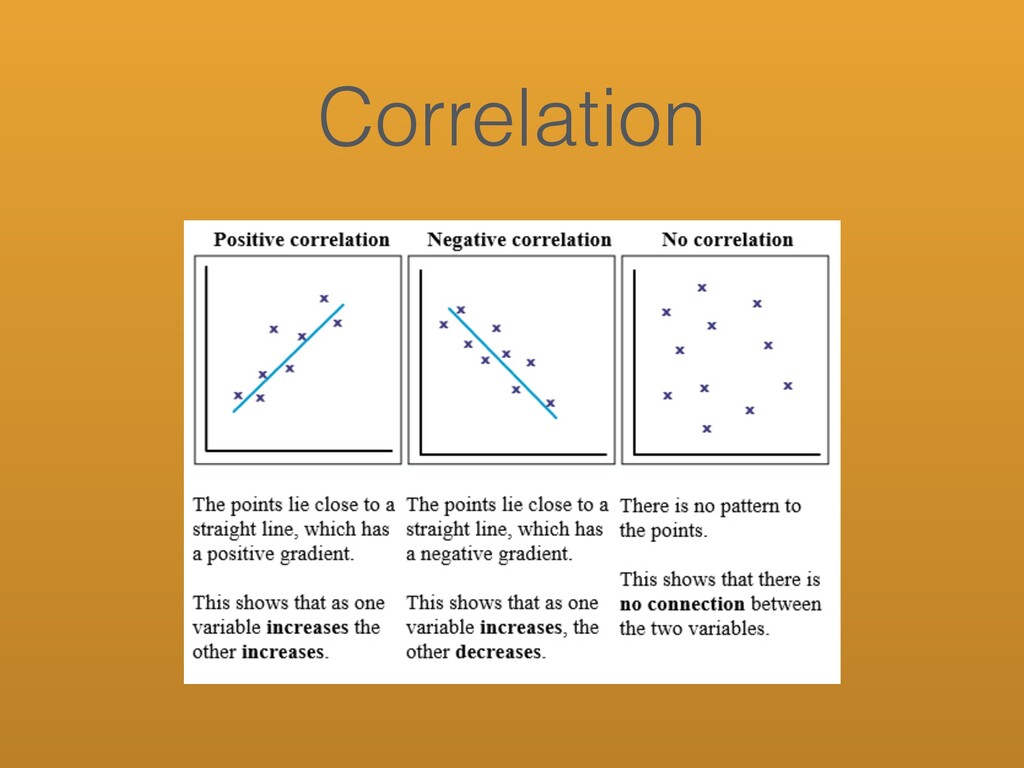
Correlation
Data Visualization
– 分佈、分佈、分佈!!! 為什麼我們要做資料視覺化?
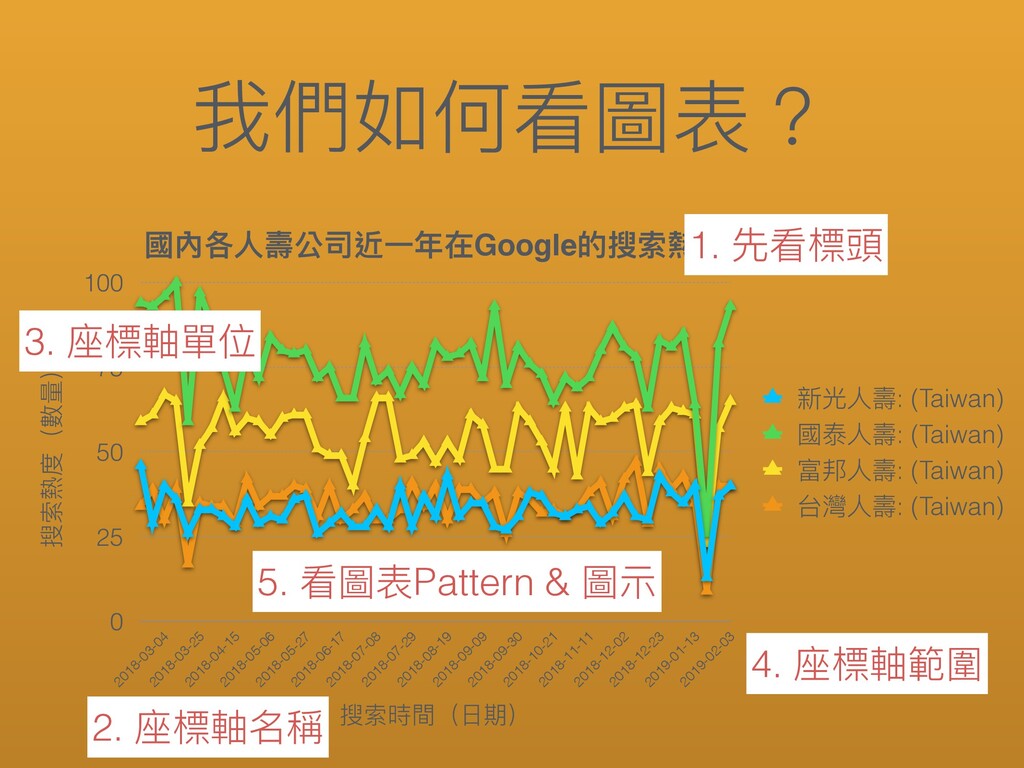
國內各⼈壽公司近⼀年在Google的搜索熱度 搜索熱度(數量) 0 25 50 75 100 搜索時間(⽇期) 2018-03-04 2018-03-25
2018-04-15 2018-05-06 2018-05-27 2018-06-17 2018-07-08 2018-07-29 2018-08-19 2018-09-09 2018-09-30 2018-10-21 2018-11-11 2018-12-02 2018-12-23 2019-01-13 2019-02-03 新光⼈壽: (Taiwan) 國泰⼈壽: (Taiwan) 富邦⼈壽: (Taiwan) 台灣⼈壽: (Taiwan) 我們如何看圖表? 1. 先看標頭 2. 座標軸名稱 3. 座標軸單位 4. 座標軸範圍 5. 看圖表Pattern & 圖⽰
常⽤的圖表有哪些?
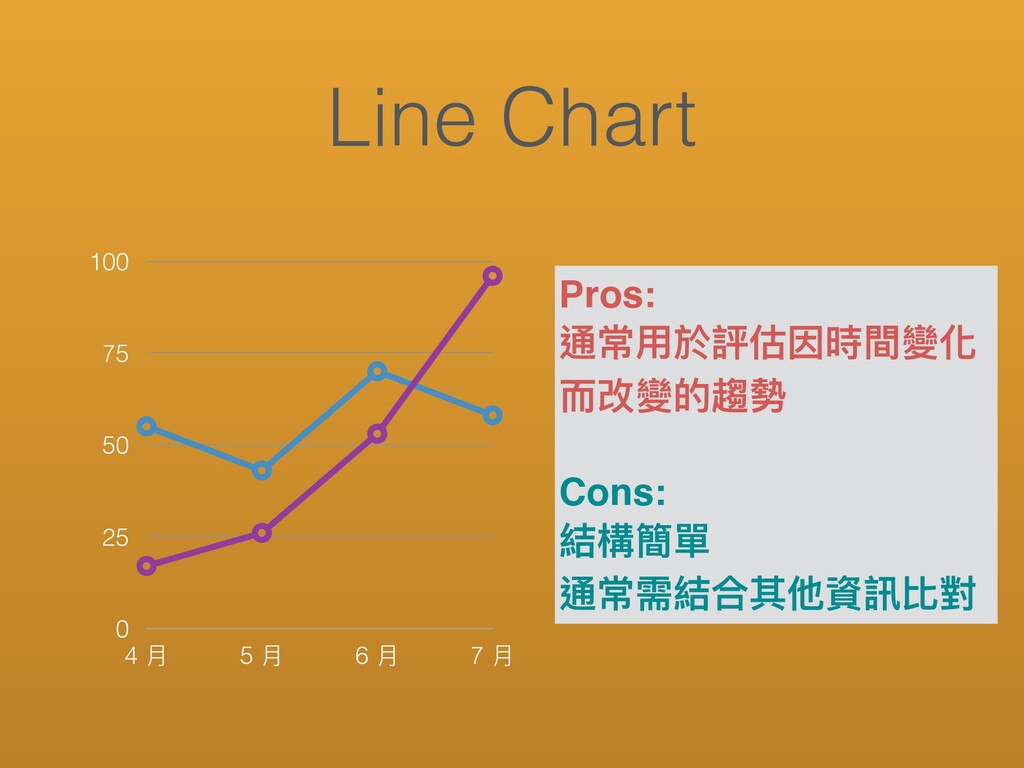
Line Chart 0 25 50 75 100 4 ⽉ 5
⽉ 6 ⽉ 7 ⽉ Pros: 通常⽤於評估因時間變化 ⽽改變的趨勢 Cons: 結構簡單 通常需結合其他資訊比對
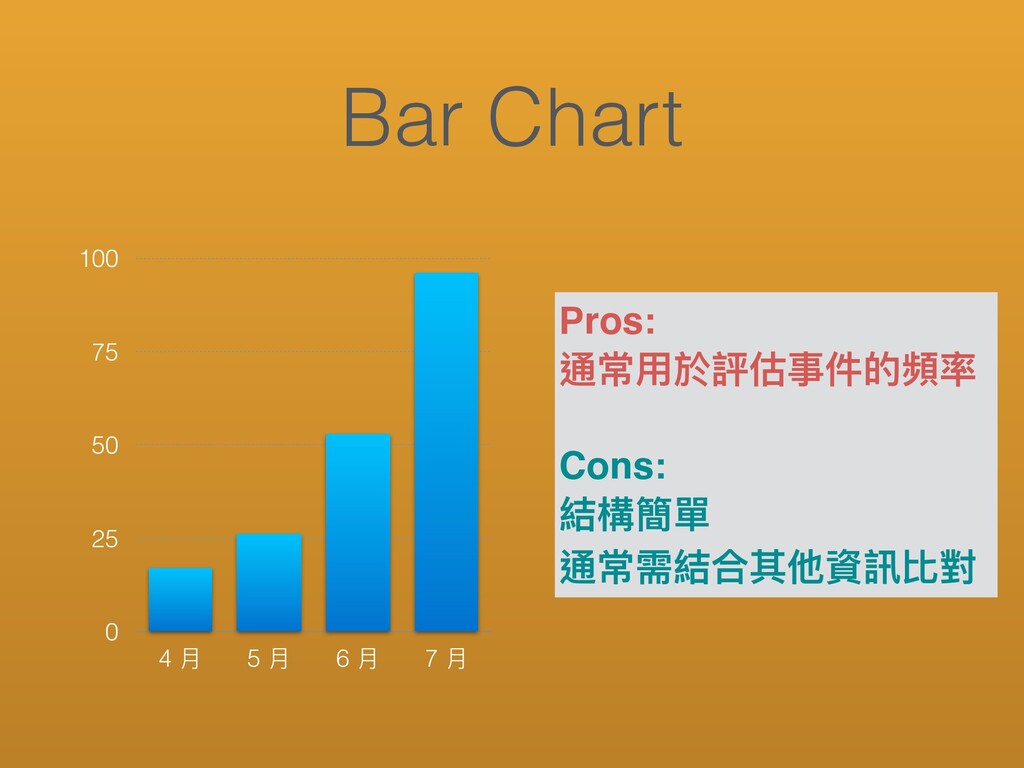
Bar Chart 0 25 50 75 100 4 ⽉ 5
⽉ 6 ⽉ 7 ⽉ Pros: 通常⽤於評估事件的頻率 Cons: 結構簡單 通常需結合其他資訊比對
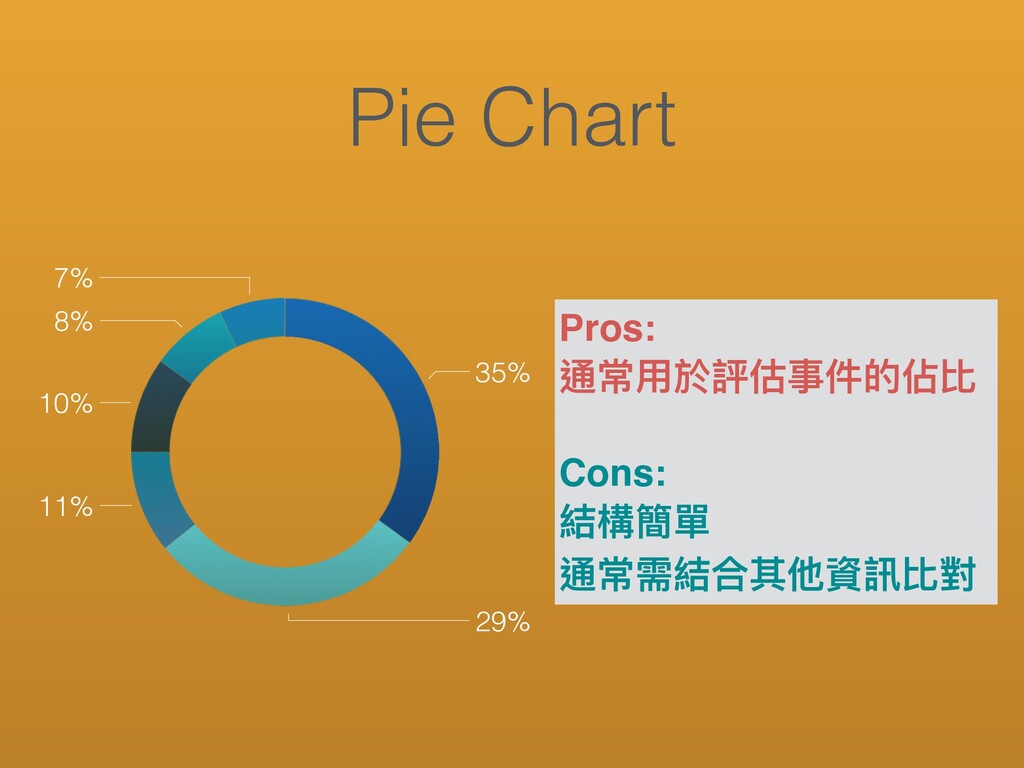
Pie Chart 7% 8% 10% 11% 29% 35% Pros: 通常⽤於評估事件的佔比
Cons: 結構簡單 通常需結合其他資訊比對
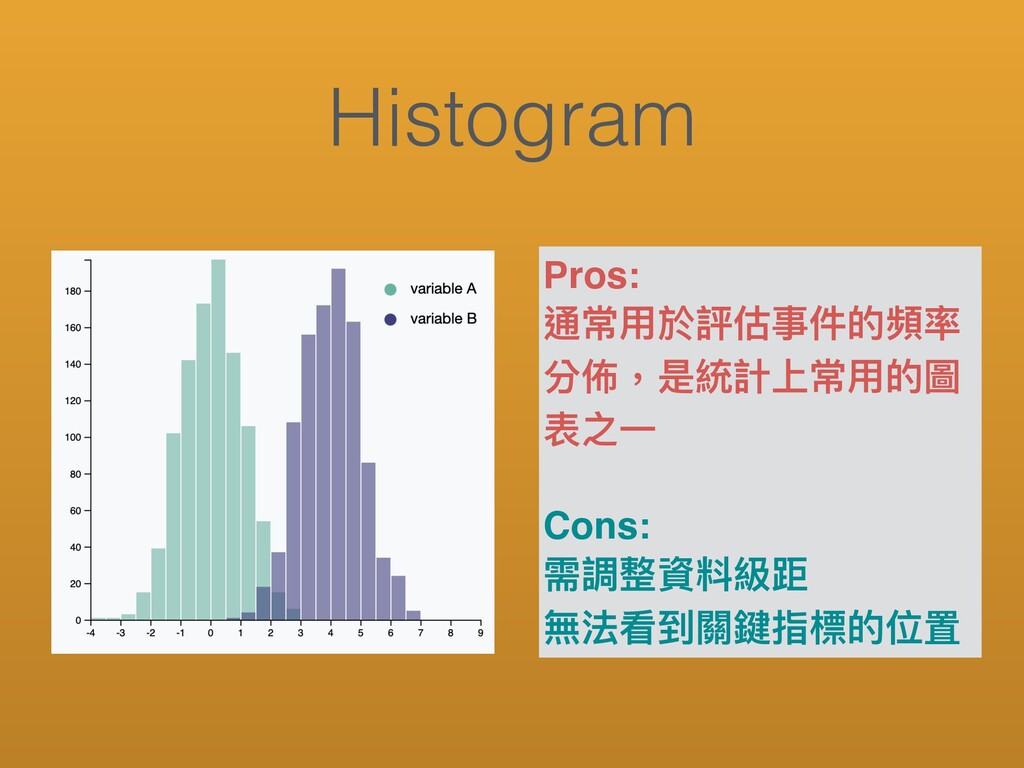
Histogram Pros: 通常⽤於評估事件的頻率 分佈,是統計上常⽤的圖 表之⼀ Cons: 需調整資料級距 無法看到關鍵指標的位置
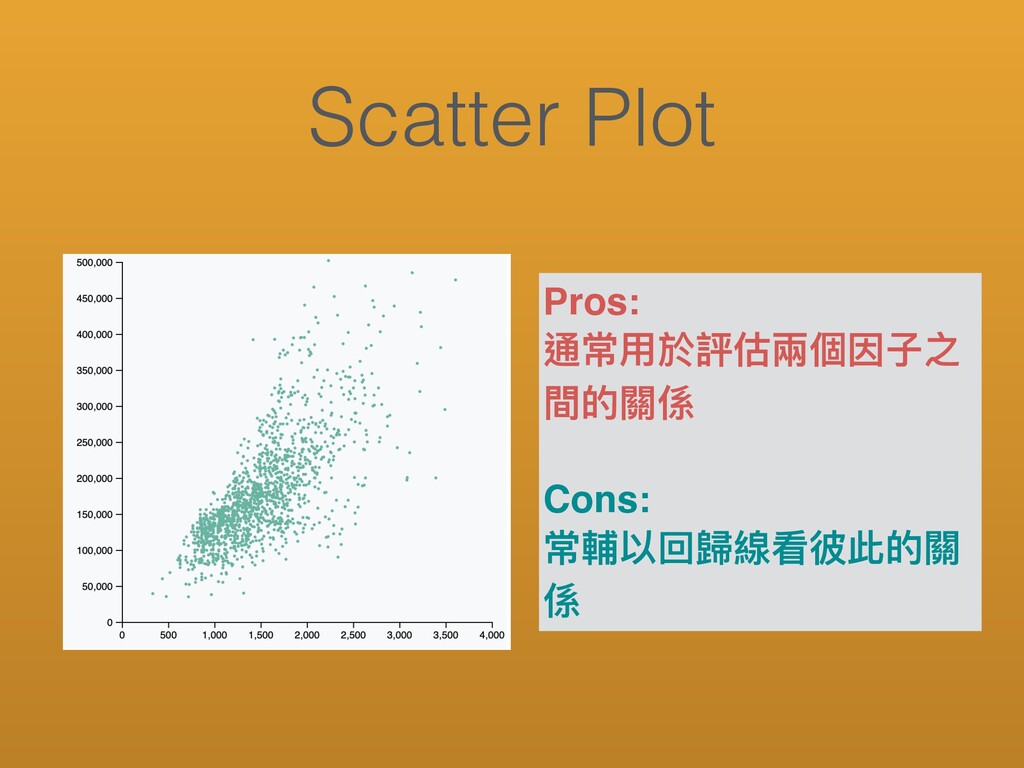
Scatter Plot Pros: 通常⽤於評估兩個因⼦之 間的關係 Cons: 常輔以回歸線看彼此的關 係
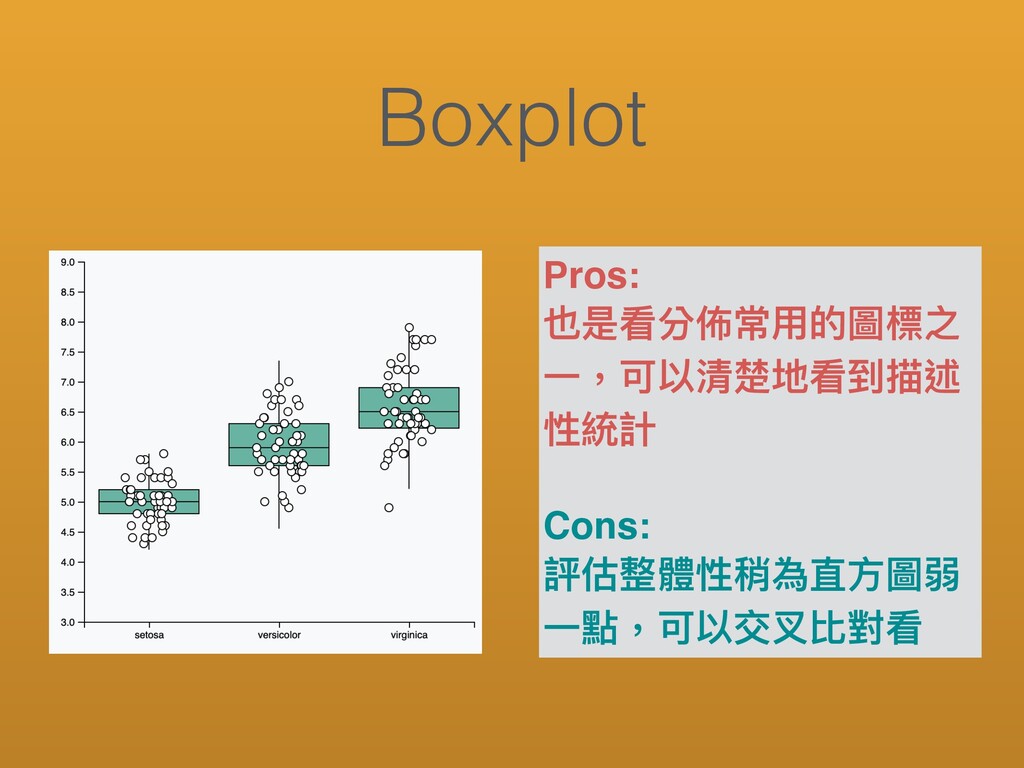
Boxplot Pros: 也是看分佈常⽤的圖標之 ⼀,可以清楚地看到描述 性統計 Cons: 評估整體性稍為直⽅圖弱 ⼀點,可以交叉比對看
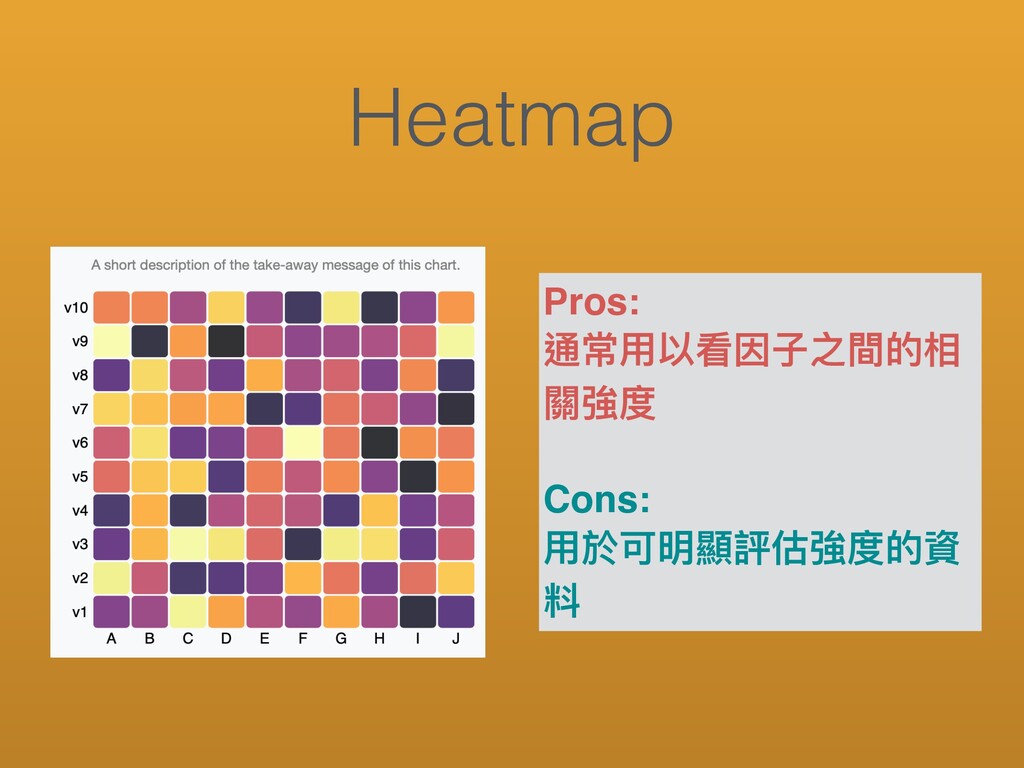
Heatmap Pros: 通常⽤以看因⼦之間的相 關強度 Cons: ⽤於可明顯評估強度的資 料
How to read package document?
Python in jupyter
Recap • How to analyze data • How to visualize
data and get insight • How to use documentation • How to explore data using python
Introduce Kaggle https://www.kaggle.com
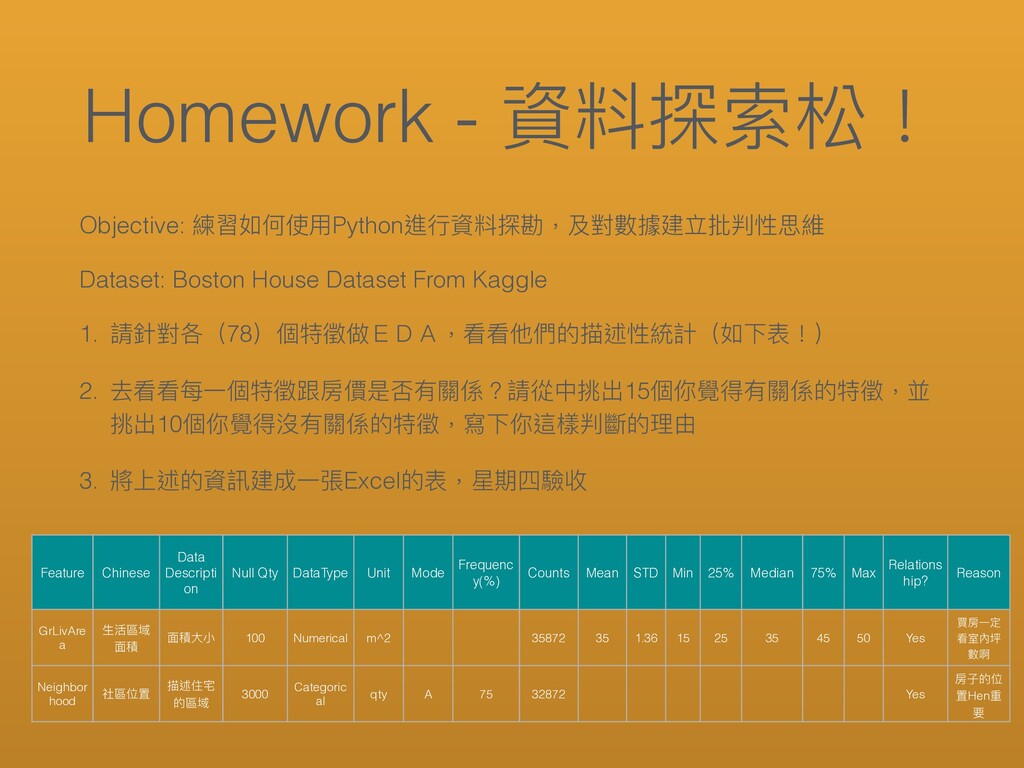
Homework - 資料探索松! Objective: 練習如何使⽤Python進⾏資料探勘,及對數據建立批判性思維 Dataset: Boston House Dataset From
Kaggle 1. 請針對各(78)個特徵做EDA,看看他們的描述性統計(如下表!) 2. 去看看每⼀個特徵跟房價是否有關係?請從中挑出15個你覺得有關係的特徵,並 挑出10個你覺得沒有關係的特徵,寫下你這樣判斷的理由 3. 將上述的資訊建成⼀張Excel的表,星期四驗收 Feature Chinese Data Descripti on Null Qty DataType Unit Mode Frequenc y(%) Counts Mean STD Min 25% Median 75% Max Relations hip? Reason GrLivAre a ⽣活區域 ⾯積 ⾯積⼤⼩ 100 Numerical m^2 35872 35 1.36 15 25 35 45 50 Yes 買房⼀定 看室內坪 數啊 Neighbor hood 社區位置 描述住宅 的區域 3000 Categoric al qty A 75 32872 Yes 房⼦的位 置Hen重 要