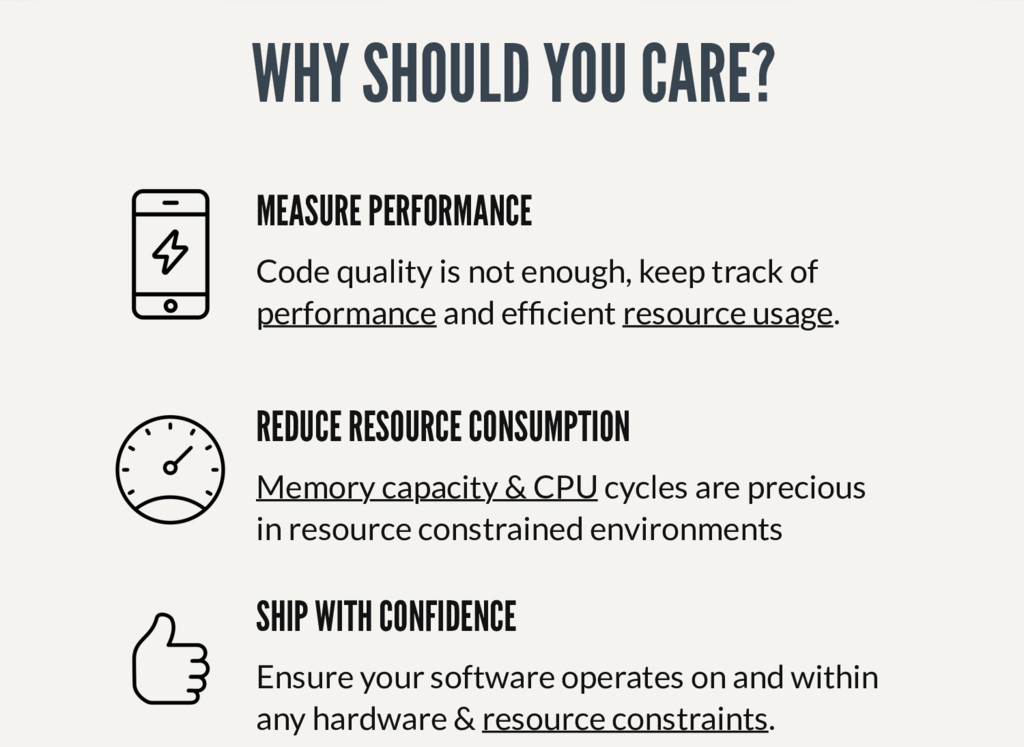
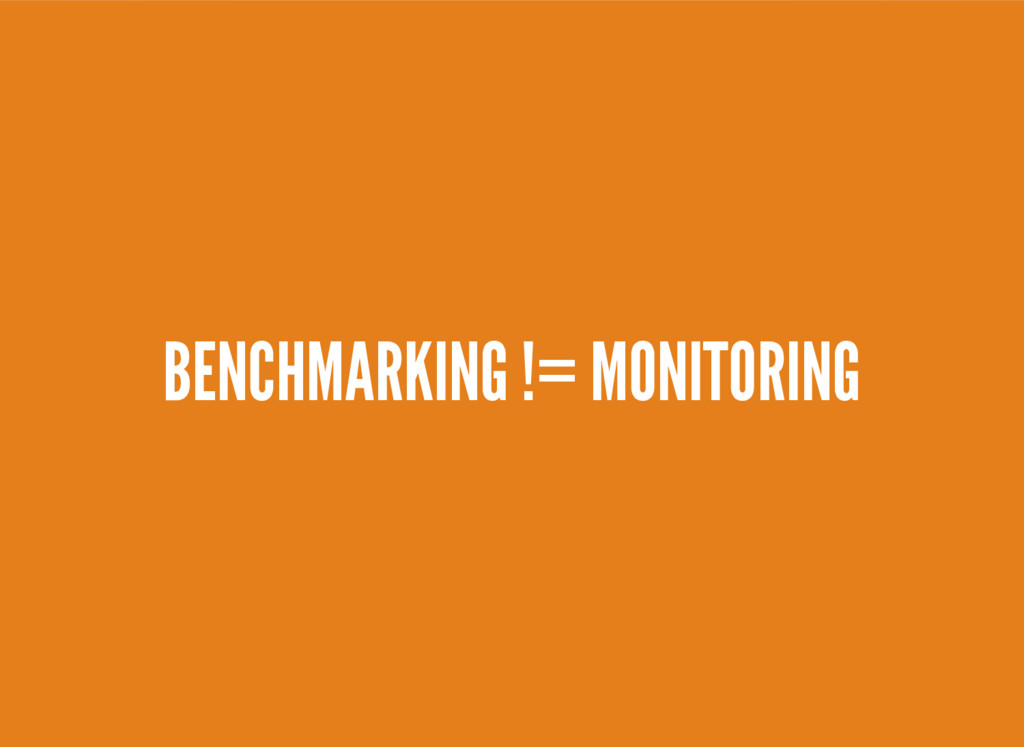
The past 10+ years of affordable and easy to scale cloud services & platforms has dulled our collective edge when it comes to matters of performance optimization and benchmarking our software creations.
While computing power goes higher costs go lower, and along with that, power and resource hungry software platforms, libraries and practices are becoming more common!
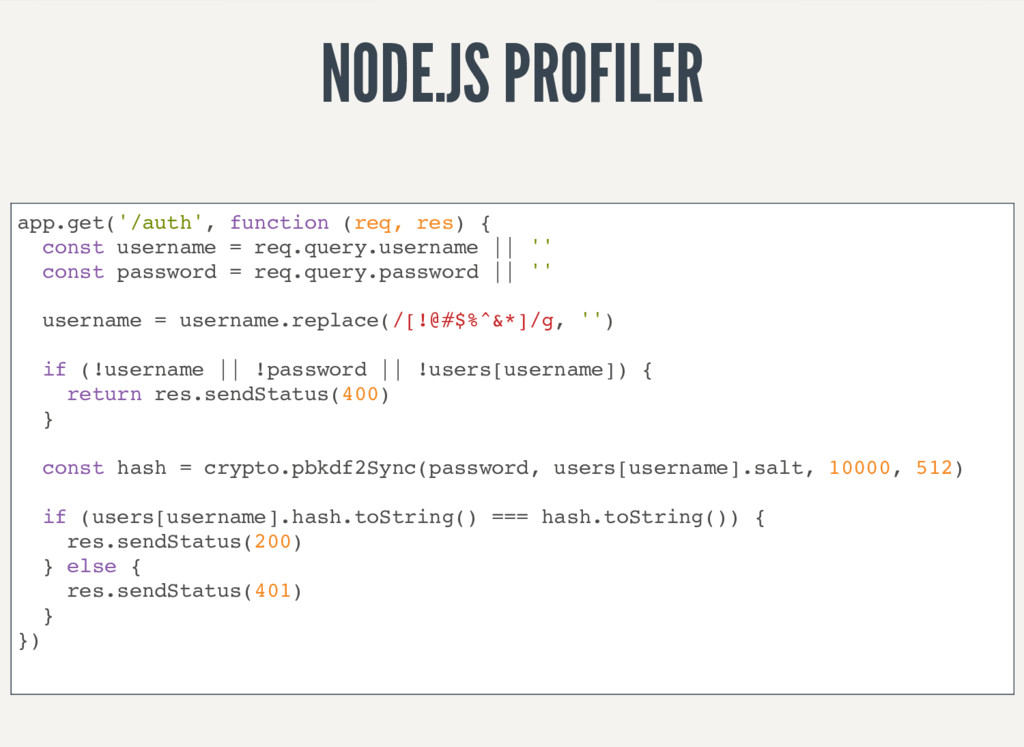
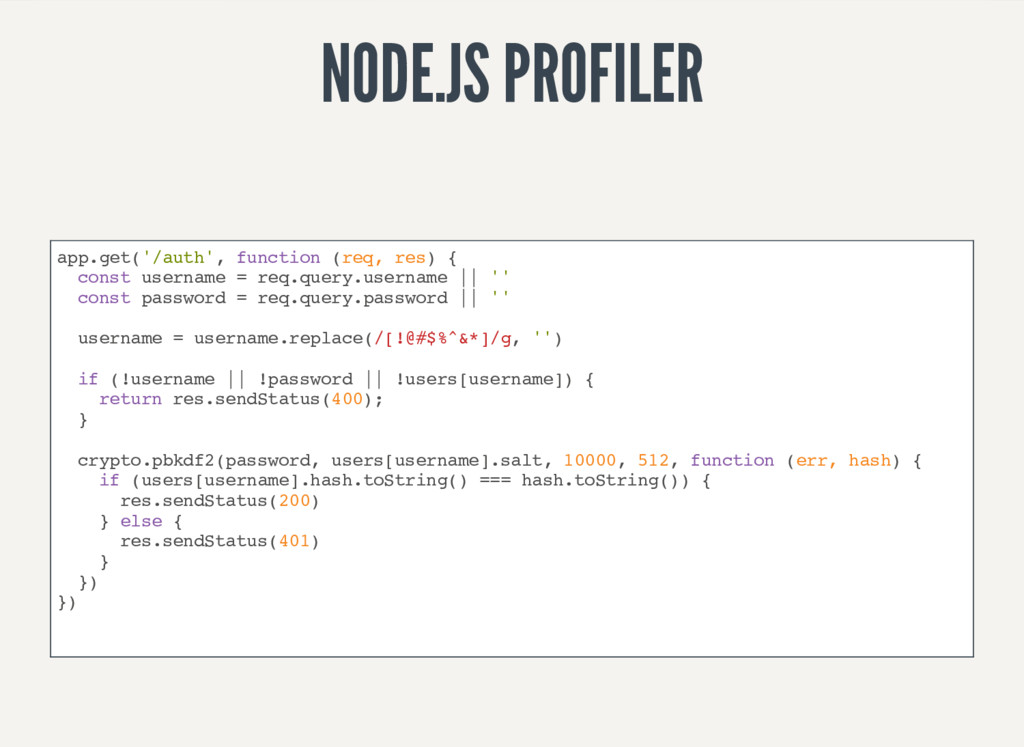
When was the last time you benchmarked the library you are using? how about all it's dependencies? come to think of it, when was the last time you inspected your dependency tree for inefficiencies? How deep does that rabbit hole go?
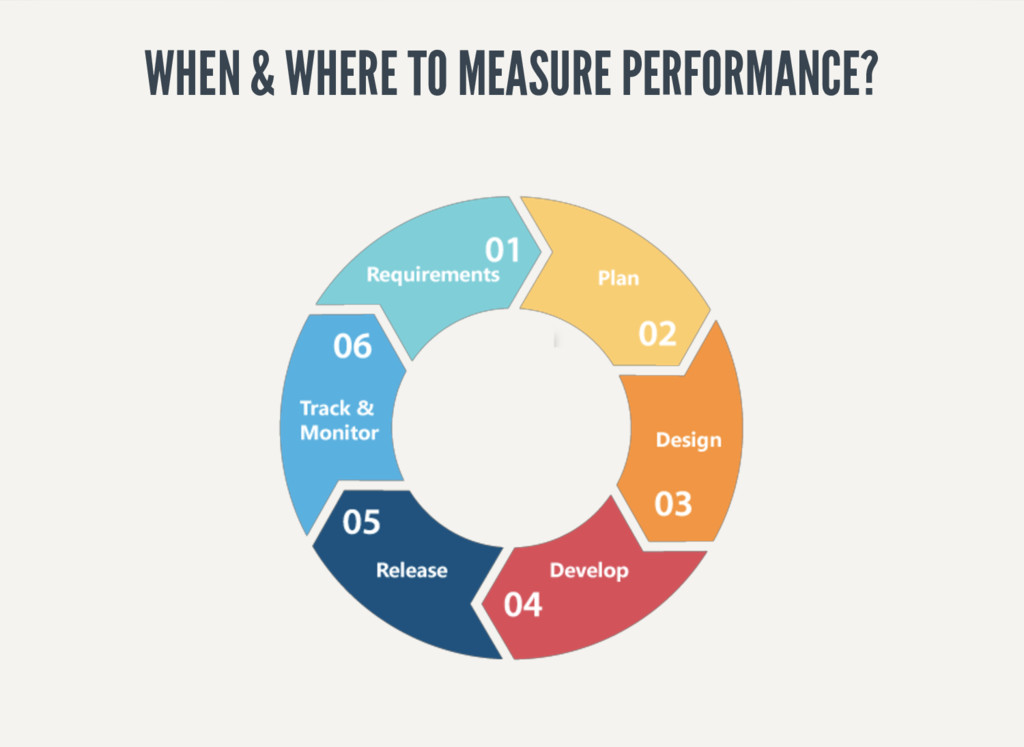
In this talk, I will showcase:
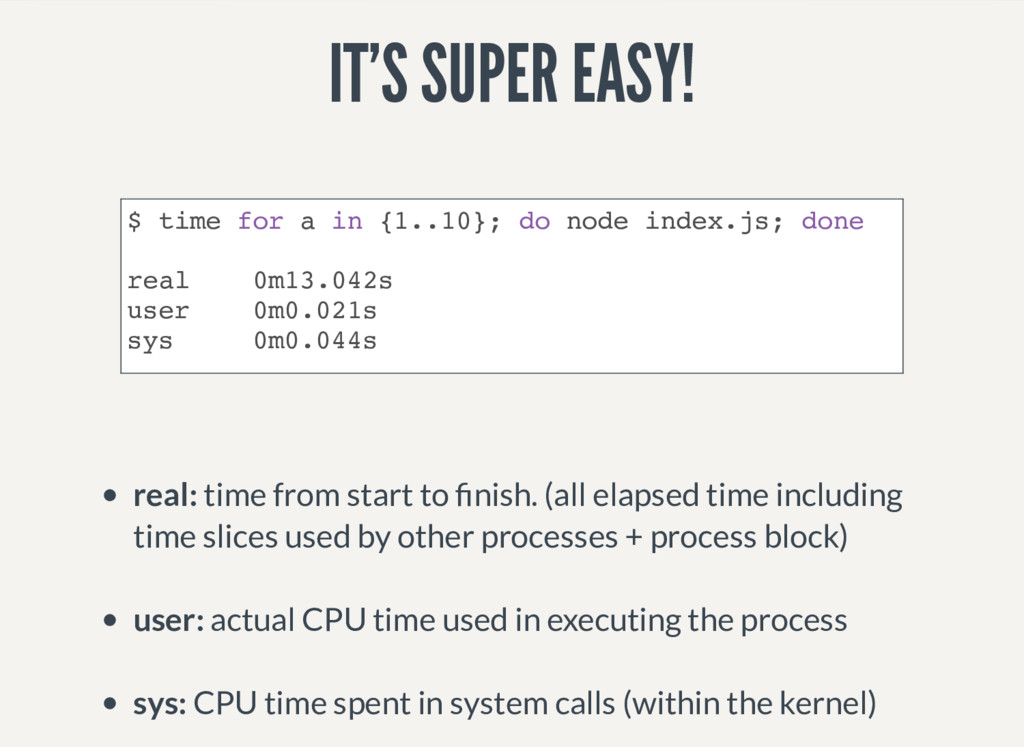
- How to accurately benchmark & measure your code
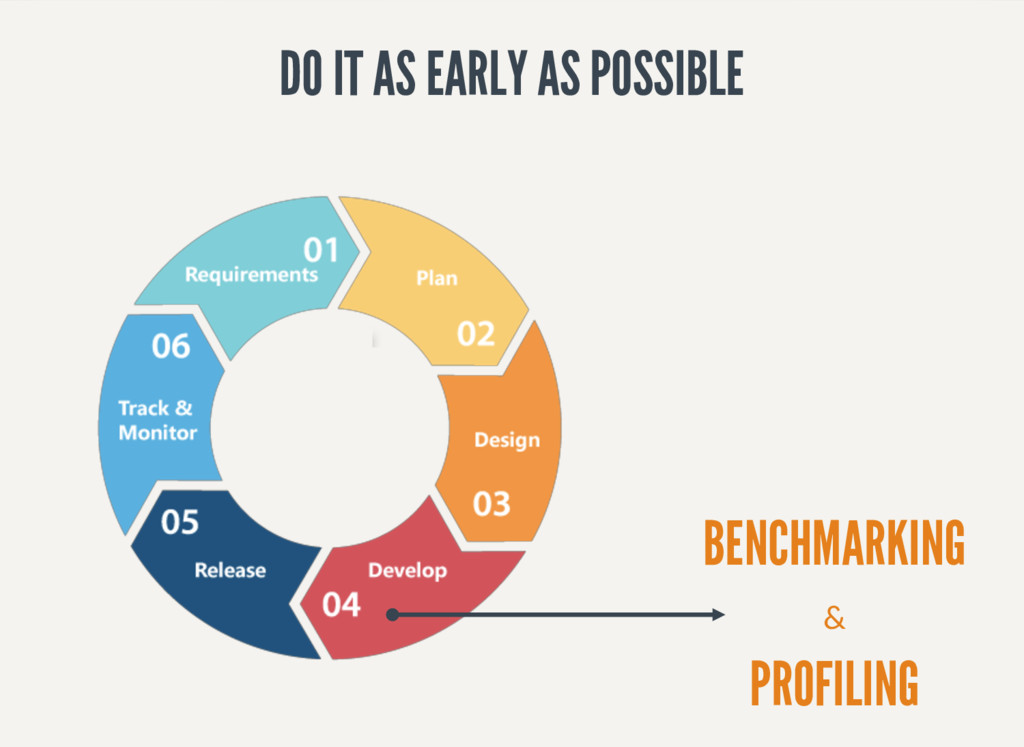
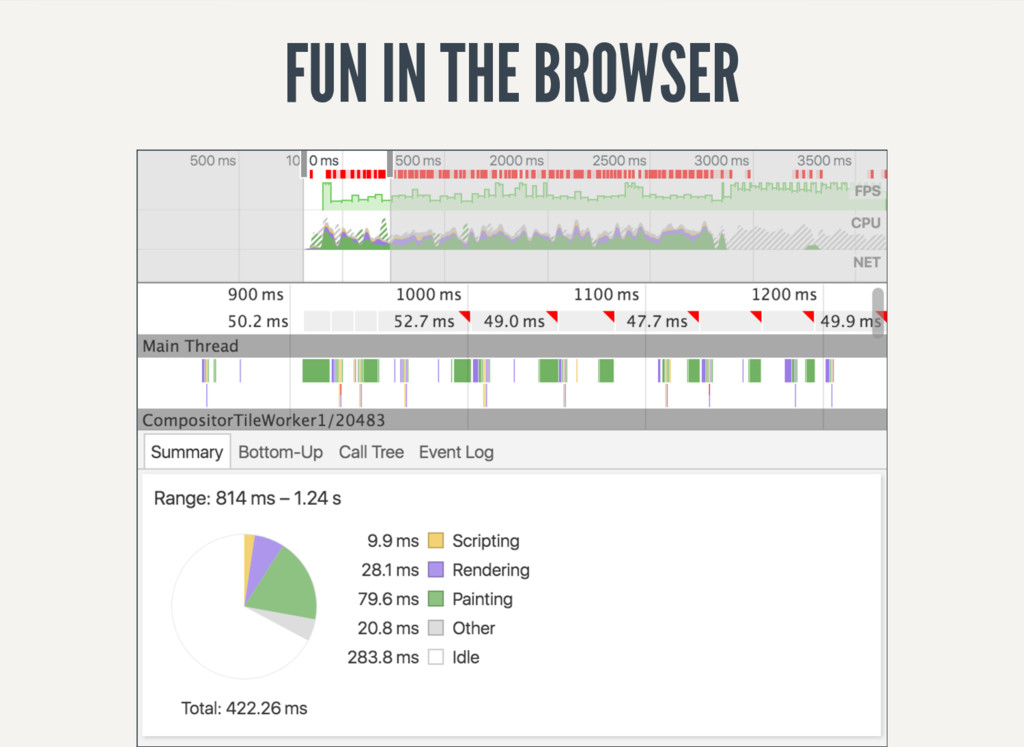
- Where to start in identifying bottlenecks inside and outside your project
- How to contribute your findings back to the community to improve our libraries ecosystem
![[Summary]: ticks total nonlib name 79 0.2% 0.2% JavaScript 36703](https://files.speakerdeck.com/presentations/6aa8dd38d0c342a6a8980d1a16c47ea5/slide_26.jpg)
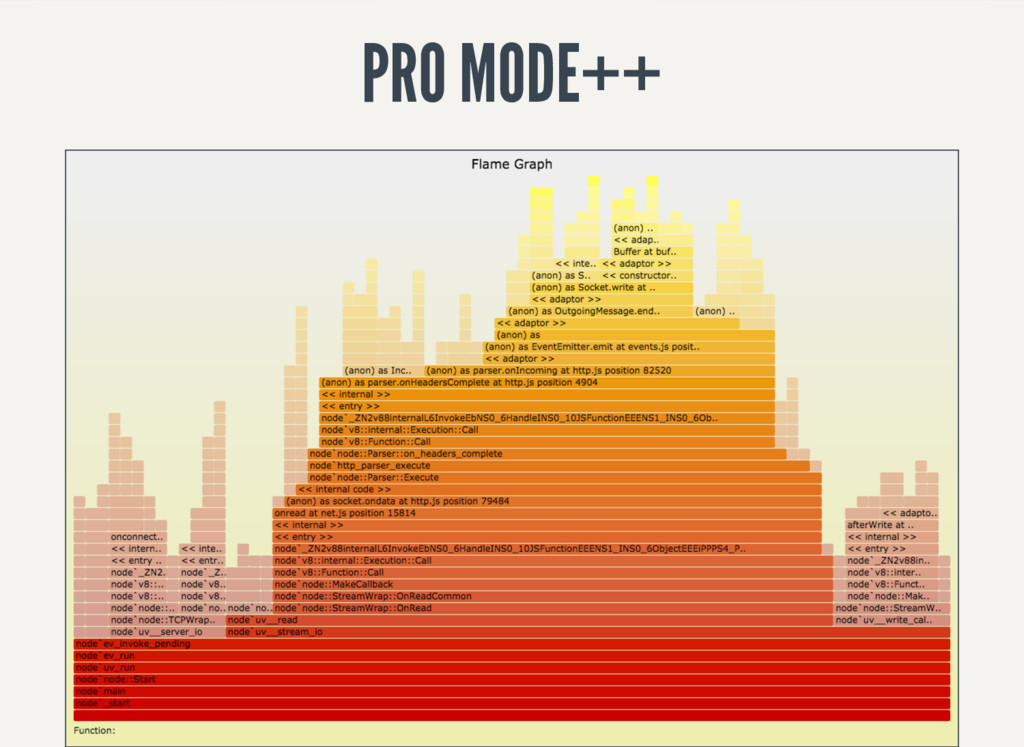
![[Bottom up (heavy) profile] ticks parent name 19557 51.8% node::crypto::PBKDF2(v8::FunctionCallbackInfo<v8::Value>](https://files.speakerdeck.com/presentations/6aa8dd38d0c342a6a8980d1a16c47ea5/slide_27.jpg)