Upgrade to Pro — share decks privately, control downloads, hide ads and more …

Prometheus 101 - Getting you started

Prometheus 101 - Getting you started

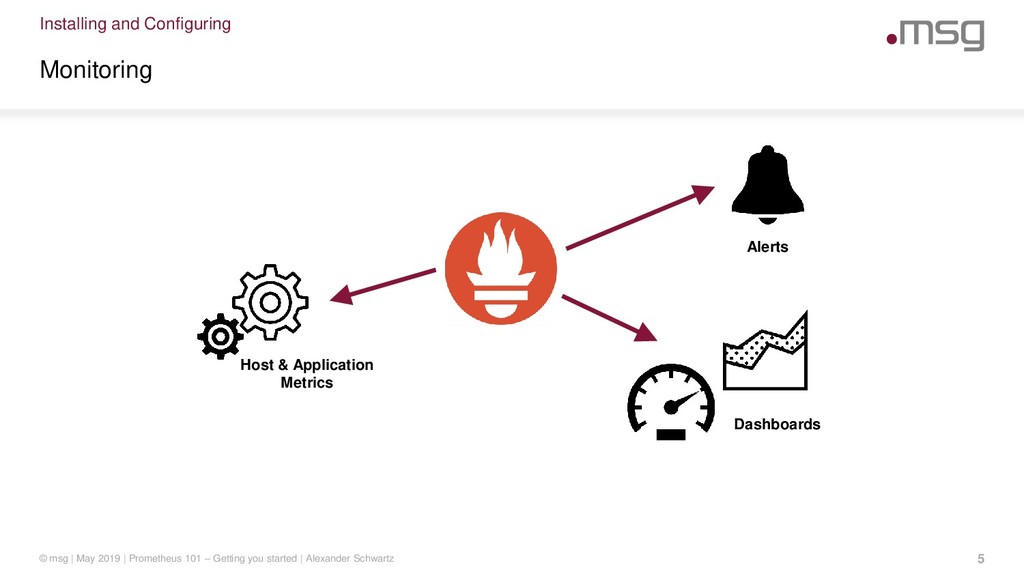
Monitoring the “up” status of your services is not enough if you want to know how your users experience them: you need to track response times, error rates, and throughput of your services. During incident investigation you want to correlate monitoring information from infrastructure and application level. For your business owners you want to create reports and dashboards to show the key performance indicators that matter.

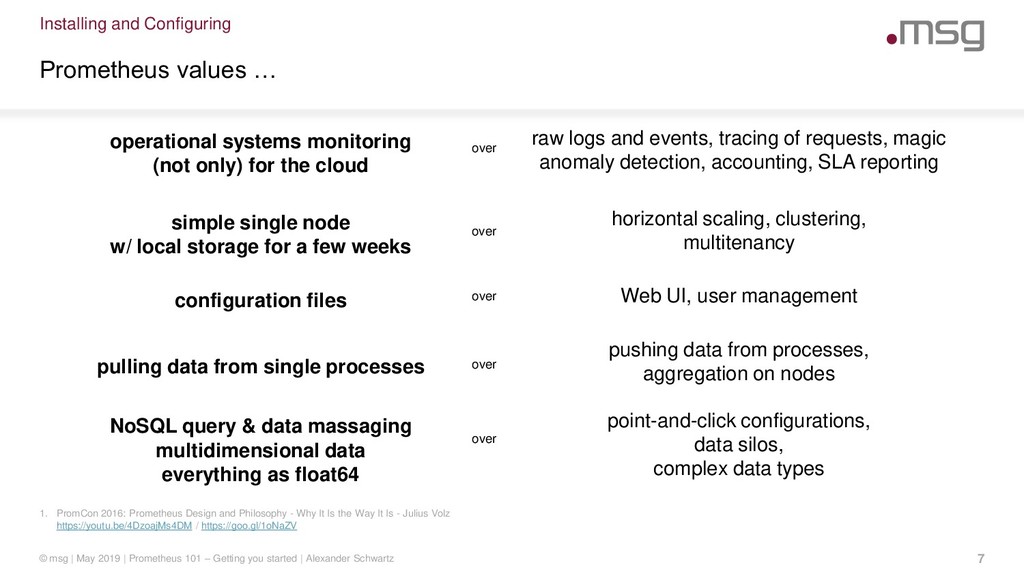
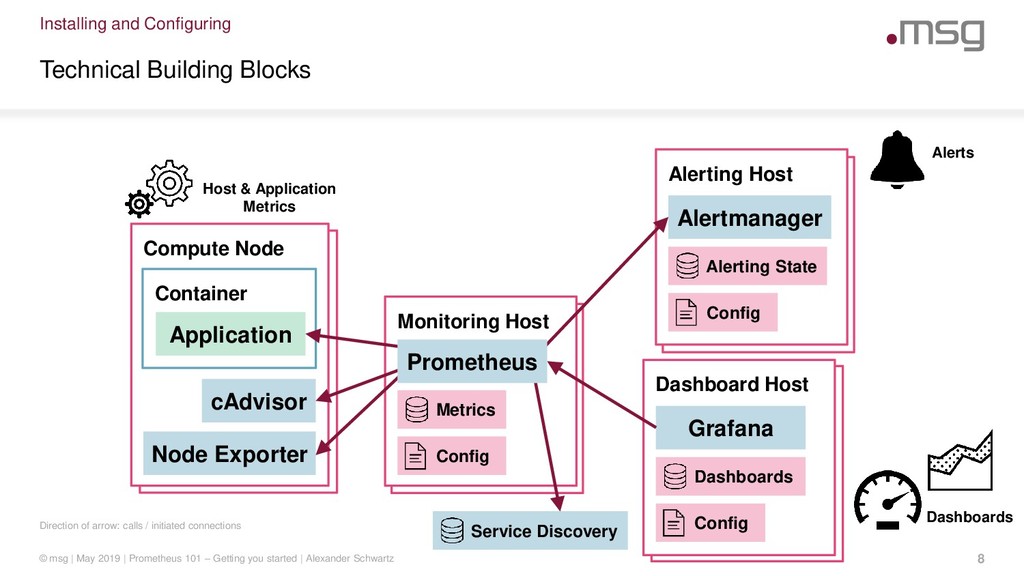
Prometheus has been designed to process metrics to deliver the alerts and dashboards you need in your day-to-day work. Over the last releases it matured, gained a broad adoption in cloud computing and is now a graduated project in the Cloud Native Computing Foundation. Its design focuses on simple and reliable operations.

Join this talk to learn about the basics of Prometheus, integrating it with your existing infrastructure, leveraging metrics at work, and to hear about its ecosystem and roadmap.

Alexander Schwartz

May 15, 2019
Tweet

More Decks by Alexander Schwartz

Other Decks in Technology

Transcript

  1. .consulting .solutions .partnership Prometheus 101 – Getting you started Alexander

    Schwartz, Principal IT Consultant Continuous Lifecycle London, 2019-05-15
  2. Prometheus 101 – Getting you started © msg | May

    2019 | Prometheus 101 – Getting you started | Alexander Schwartz 4 Installing and Configuring 1 Capturing Metrics 2 Creating Dashboards 3 Sending Alerts 4 Watching out for Pitfalls 5 Summary 6
  3. Installing and Configuring Monitoring © msg | May 2019 |

    Prometheus 101 – Getting you started | Alexander Schwartz 5 Host & Application Metrics Alerts Dashboards
  4. Installing and Configuring 1. https://prometheus.io/ Prometheus is a Monitoring System

    and Time Series Database © msg | May 2019 | Prometheus 101 – Getting you started | Alexander Schwartz 6 Prometheus is an opinionated solution for instrumentation, collection, storage, querying, alerting, dashboards, trending
  5. Installing and Configuring 1. PromCon 2016: Prometheus Design and Philosophy

    - Why It Is the Way It Is - Julius Volz https://youtu.be/4DzoajMs4DM / https://goo.gl/1oNaZV Prometheus values … © msg | May 2019 | Prometheus 101 – Getting you started | Alexander Schwartz 7 operational systems monitoring (not only) for the cloud simple single node w/ local storage for a few weeks horizontal scaling, clustering, multitenancy raw logs and events, tracing of requests, magic anomaly detection, accounting, SLA reporting over over over over over configuration files Web UI, user management pulling data from single processes pushing data from processes, aggregation on nodes NoSQL query & data massaging multidimensional data everything as float64 point-and-click configurations, data silos, complex data types
  6. Dashboard Host Alerting Host Compute Node Monitoring Host Compute Node

    Dashboard Host Installing and Configuring Direction of arrow: calls / initiated connections Technical Building Blocks © msg | May 2019 | Prometheus 101 – Getting you started | Alexander Schwartz 8 Monitoring Host Grafana Metrics Config Dashboards Config Node Exporter cAdvisor Application Container Alerting Host Alerting State Config Host & Application Metrics Dashboards Alerts Alertmanager Service Discovery Prometheus
  7. Installing and Configuring 1. https://www.percona.com/blog/2018/09/20/prometheus-2-times-series-storage-performance-analyses/ 2. https://github.com/prometheus/prombench Installing Prometheus ©

    msg | May 2019 | Prometheus 101 – Getting you started | Alexander Schwartz 9 • Prometheus is written in the Go programming language • Standalone binaries available for different operating systems • Run the binaries directly or within a Docker container • The target machine needs:  Fast local disk (SSD) to store the metrics history  RAM to cache metrics history Native binaries for: Linux, *BSD Windows, macOS
  8. Installing and Configuring 1. https://www.robustperception.io/how-much-ram-does-prometheus-2-x-need-for-cardinality-and-ingestion 2. https://www.percona.com/blog/2018/09/20/prometheus-2-times-series-storage-performance-analyses/ 3. https://github.com/Comcast/trickster 4.

    https://prometheus.io/docs/prometheus/latest/storage/ Sizing Prometheus © msg | May 2019 | Prometheus 101 – Getting you started | Alexander Schwartz 10 “Prometheus 2 TSDB offers impressive performance, being able to handle a cardinality of millions of time series, and also to handle hundreds of thousands of samples ingested per second on rather modest hardware. CPU and disk IO usage are both very impressive. I got up to 200K/metrics/sec per used CPU core!” “[…] a million series costs around 2GiB of RAM in terms of cardinality, plus with a 15s scrape interval and no churn around 2.5GiB for ingestion” “Running queries will require additional RAM, both for any additional chunks pulled in from disk and for evaluating the expression.” Cited from: Peter Zaitsev, Percona Blog “On average, Prometheus uses only around 1-2 bytes per sample [on disk].” needed_disk_space = retention_time_seconds * ingested_samples_per_second * bytes_per_sample Example: • 1000 exporters with 1000 metrics each polled every 15s: 66K metrics/sec • Retention 30 days: approx. 240 GB Cited from: Prometheus Docs Cited from: Brian Brazil, Robust Perception
  9. global: scrape_interval: 15s rule_files: - '/etc/prometheus/alert.rules' alerting: alertmanagers: - static_configs:

    - targets: - 172.17.0.1:9093 scrape_configs: - job_name: 'prometheus' scrape_interval: 5s static_configs: - targets: ['172.17.0.1:9090'] metrics_path: /metrics Installing and Configuring 1. https://prometheus.io/docs/prometheus/latest/configuration/configuration/ 2. https://prometheus.io/docs/prometheus/latest/configuration/configuration/#file_sd_config 3. https://www.robustperception.io/reloading-prometheus-configuration Configuring Prometheus © msg | May 2019 | Prometheus 101 – Getting you started | Alexander Schwartz 11 • YAML configuration file • Alerting rules separate • Alert managers to notify  in configuration file OR  via service discovery • Targets to scrape:  in configuration file OR  via service discovery (Kubernetes, Consul, …) OR  via separate YAML or JSON file (file_sd) • Web UI is read only (shows status and configuration) • Reloading configuration:  sending SIGHUP to the process  posting to special URL (if enabled on command line)
  10. Prometheus 101 – Getting you started © msg | May

    2019 | Prometheus 101 – Getting you started | Alexander Schwartz 12 Installing and Configuring 1 Capturing Metrics 2 Creating Dashboards 3 Sending Alerts 4 Watching out for Pitfalls 5 Summary 6
  11. Prometheus Metrics format © msg | May 2019 | Prometheus

    101 – Getting you started | Alexander Schwartz 13 Capturing Metrics # HELP node_cpu Seconds the cpus spent in each mode. # TYPE node_cpu counter node_cpu{cpu="cpu0",mode="guest"} 0 node_cpu{cpu="cpu0",mode="idle"} 4533.86 node_cpu{cpu="cpu0",mode="iowait"} 7.36 ... node_cpu{cpu="cpu0",mode="user"} 445.51 node_cpu{cpu="cpu1",mode="guest"} 0 node_cpu{cpu="cpu1",mode="idle"} 4734.47 ... node_cpu{cpu="cpu1",mode="iowait"} 7.41 node_cpu{cpu="cpu1",mode="user"} 576.91 ...
  12. Capturing Metrics Multidimensional Metric as stored by Prometheus © msg

    | May 2019 | Prometheus 101 – Getting you started | Alexander Schwartz 14 576.91 cpu: cpu1 instance: 172.17.0.1:9100 job: node-exporter __name__: node_cpu mode: user
  13. Capturing Metrics Calculations based on metrics using PromQL © msg

    | May 2019 | Prometheus 101 – Getting you started | Alexander Schwartz 15 Metric: node_cpu: Seconds the CPUs spent in each mode (Type: Counter). What percentage of a CPU is used per core? 1 - rate(node_cpu{mode='idle'} [5m]) What percentage of CPUs is used per instance? avg by (instance) (1 - rate(node_cpu{mode='idle'} [5m])) function filter parameter metric
  14. Capturing Metrics Overview of exporters (abbreviated) © msg | May

    2019 | Prometheus 101 – Getting you started | Alexander Schwartz 16 Name Use for… Cardinality Locality Node Exporter Host metrics on Linux systems one per Linux host on linux host cAdvisor Container metrics one per container host on container host Java Simple Client Java- and Application metrics one per Java application inside Java application JMX Exporter Java- and Application metrics one per Java application Java agent
  15. Capturing Metrics Overview of exporters (abbreviated) © msg | May

    2019 | Prometheus 101 – Getting you started | Alexander Schwartz 17 Name Use for… Cardinality Locality Node Exporter Host metrics on Linux systems one per Linux host on linux host cAdvisor Container metrics one per container host on container host Java Simple Client Java- and Application metrics one per Java application inside Java application JMX Exporter Java- and Application metrics one per Java application Java agent MySQL Exporter Database metrics one per database sidecar for database Graphite Exporter Converter for Graphite metrics single node independent SNMP Exporter Gateway to SNMP metrics single node independent Blackbox Exporter Probing remote endpoints (HTTP, DNS, TCP, …) single node independent Push Gateway Short-lived jobs that can’t be scraped single node independent
  16. Capturing Metrics Capturing application metrics with Micrometer © msg |

    May 2019 | Prometheus 101 – Getting you started | Alexander Schwartz 18 Micrometer [maɪˈkrɒm.ɪ.tər] is a facade (API), that allows to collect metrics in JVM applications independent of the metrics backend („SLF4J, but for metrics“). • Multidimensional metrics – a very good fit for Prometheus metrics model • Integrations for libraries and back ends (for example Prometheus, Datadog, Ganglia, Graphite) • Ready to use in Spring Boot 1.x and 2.x • Can also be used outside Spring Boot Homepage: https://micrometer.io/ License: Apache 2.0
  17. Prometheus 101 – Getting you started © msg | May

    2019 | Prometheus 101 – Getting you started | Alexander Schwartz 23 Installing and Configuring 1 Capturing Metrics 2 Creating Dashboards 3 Sending Alerts 4 Watching out for Pitfalls 5 Summary 6
  18. Creating Dashboards Grafana provides interactive dashboards © msg | May

    2019 | Prometheus 101 – Getting you started | Alexander Schwartz 24 • Query multiple sources (including Prometheus) • Provide interactive dashboards • Authentication/authorization to access/modify dashboards Homepage: https://grafana.com License: Apache 2.0
  19. © msg | May 2019 | Prometheus 101 – Getting

    you started | Alexander Schwartz 25
  20. © msg | May 2019 | Prometheus 101 – Getting

    you started | Alexander Schwartz 26
  21. Creating Dashboards Grafana Demo © msg | May 2019 |

    Prometheus 101 – Getting you started | Alexander Schwartz 27 • Adding Prometheus as a data source • Creating a dashboard • Using Grafana’s “Explore” perspective DEMO
  22. Prometheus 101 – Getting you started © msg | May

    2019 | Prometheus 101 – Getting you started | Alexander Schwartz 28 Installing and Configuring 1 Capturing Metrics 2 Creating Dashboards 3 Sending Alerts 4 Watching out for Pitfalls 5 Summary 6
  23. groups: - name: example rules: - alert: HighErrorRate expr: >-

    sum by (uri) (... {status!='200') / sum by (uri) (...) > 0.1 for: 30s labels: severity: page annotations: summary: >- URI {{ $labels.uri }} high error rate description: >- {{ $labels.uri }} has an error rate of {{ $value }}, that's more than 10% for more than 30 seconds. Installing and Configuring 1. https://prometheus.io/docs/prometheus/latest/configuration/alerting_rules/ 2. https://prometheus.io/docs/prometheus/latest/configuration/unit_testing_rules/ 3. https://landing.google.com/sre/sre-book/chapters/monitoring-distributed-systems/ 4. https://www.weave.works/blog/labels-in-prometheus-alerts-think-twice-before-using-them Configuring Alerts © msg | May 2019 | Prometheus 101 – Getting you started | Alexander Schwartz 29 • YAML configuration file for Prometheus • Expression can be any valid PromQL expression • Annotations are available for notification templates • Unit Tests for alerts with promtool Advice: Alert for symptoms that have a customer facing impact and require immediate human intervention
  24. route: receiver: 'alertmanager-bot' group_by: [alertname, datacenter, app] group_wait: 10s group_interval:

    10s receivers: - name: 'alertmanager-bot' webhook_configs: - send_resolved: true url: 'http://172.17.0.1:9201' Installing and Configuring 1. https://prometheus.io/docs/alerting/configuration/ 2. https://www.weave.works/blog/labels-in-prometheus-alerts-think-twice-before-using-them Configuring Alertmanager © msg | May 2019 | Prometheus 101 – Getting you started | Alexander Schwartz 30 • YAML configuration file • Multiple routes with different receivers and intervals possible • One notification bundles multiple alerts Not shown here: Notification templates for integrated receivers like for example slack
  25. Sending Alerts Direction of arrow: calls / initiated connections 1.

    https://github.com/free/jiralert 2. https://github.com/metalmatze/alertmanager-bot Technical Building Blocks © msg | May 2019 | Prometheus 101 – Getting you started | Alexander Schwartz 31 Monitoring Host Metrics Config Prometheus Alerts Pagerduty Slack jiralert alertmanager-bot JIRA Telegram (via Webhook) Alerting Host Alerting State Config Alertmanager (and other built in notifications)
  26. Prometheus 101 – Getting you started © msg | May

    2019 | Prometheus 101 – Getting you started | Alexander Schwartz 32 Installing and Configuring 1 Capturing Metrics 2 Creating Dashboards 3 Sending Alerts 4 Watching out for Pitfalls 5 Summary 6
  27. prometheus_notifications_total process_cpu_seconds_total http_request_duration_seconds Watching out for Pitfalls 1. https://prometheus.io/docs/practices/naming/ Naming

    Conventions for metrics © msg | May 2019 | Prometheus 101 – Getting you started | Alexander Schwartz 33 • Single Name Application Prefix • Single Base Unit • Suffix with base unit • Same logical thing across all dimensions (read: labels) Use these naming conventions provides self-documenting metric names that can be use safely in PromQL and Grafana.
  28. Watching out for Pitfalls 1. http://www.brendangregg.com/usemethod.html 2. https://rancher.com/red-method-for-prometheus-3-key-metrics-for-monitoring/ 3. https://landing.google.com/sre/sre-book/chapters/monitoring-distributed-systems/#xref_monitoring_golden-signals

    What to measure – USE vs. RED vs. Four Golden Signals (FGS) © msg | May 2019 | Prometheus 101 – Getting you started | Alexander Schwartz 34 Using a consistent methods helps you to have the metrics you need at hand when analysing problems. Examples: Database connection pool (resource perspective): measure max and active connections and errors HTTP endpoint (request perspective): measure requests, errors and duration
  29. Watching out for Pitfalls 1. http://www.brendangregg.com/usemethod.html 2. https://rancher.com/red-method-for-prometheus-3-key-metrics-for-monitoring/ 3. https://landing.google.com/sre/sre-book/chapters/monitoring-distributed-systems/#xref_monitoring_golden-signals

    What to measure – USE vs. RED vs. Four Golden Signals (FGS) © msg | May 2019 | Prometheus 101 – Getting you started | Alexander Schwartz 35 Using a consistent methods helps you to have the metrics you need at hand when analysing problems. Examples: Database connection pool (resource perspective): measure max and active connections and errors HTTP endpoint (request perspective): measure requests, errors and duration Request based (RED) Rate Errors Duration
  30. Watching out for Pitfalls 1. http://www.brendangregg.com/usemethod.html 2. https://rancher.com/red-method-for-prometheus-3-key-metrics-for-monitoring/ 3. https://landing.google.com/sre/sre-book/chapters/monitoring-distributed-systems/#xref_monitoring_golden-signals

    What to measure – USE vs. RED vs. Four Golden Signals (FGS) © msg | May 2019 | Prometheus 101 – Getting you started | Alexander Schwartz 36 Using a consistent methods helps you to have the metrics you need at hand when analysing problems. Examples: Database connection pool (resource perspective): measure max and active connections and errors HTTP endpoint (request perspective): measure requests, errors and duration Request based (RED) Resource based (USE) Rate Utilization Errors Saturation Duration Errors
  31. Watching out for Pitfalls 1. http://www.brendangregg.com/usemethod.html 2. https://rancher.com/red-method-for-prometheus-3-key-metrics-for-monitoring/ 3. https://landing.google.com/sre/sre-book/chapters/monitoring-distributed-systems/#xref_monitoring_golden-signals

    What to measure – USE vs. RED vs. Four Golden Signals (FGS) © msg | May 2019 | Prometheus 101 – Getting you started | Alexander Schwartz 37 Using a consistent methods helps you to have the metrics you need at hand when analysing problems. Examples: Database connection pool (resource perspective): measure max and active connections and errors HTTP endpoint (request perspective): measure requests, errors and duration Request based (RED) Resource based (USE) Service based (FGS) Rate Utilization Latency Errors Saturation Traffic Duration Errors Errors Saturation
  32. http_server_requests_total{uri="/user/001"} 1.0 http_server_requests_total{uri="/user/002"} 1.0 http_server_requests_total{uri="/user/003"} 1.0 http_server_requests_total{uri="/user/004"} 1.0 ... Watching

    out for Pitfalls 1. https://github.com/open-fresh/bomb-squad 2. https://www.robustperception.io/using-sample_limit-to-avoid-overload Metrics Explosion © msg | May 2019 | Prometheus 101 – Getting you started | Alexander Schwartz 38 • Each label value will create its on time series in Prometheus • High-cardinality labels on metrics will lead to a metrics explosion • Too many metrics will slow down Prometheus and Dashboards and make both unusable To avoid this: Use the configuration parameter sample_limit or use a tool like bomb-squad to automatically re-configure Prometheus.
  33. groups: - name: example rules: - alert: MyJobMissingMyMetric expr: up{job="myjob"}

    == 1 unless my_metric for: 10m Watching out for Pitfalls 1. https://www.robustperception.io/absent-alerting-for-scraped-metrics Alerting on missing metric © msg | May 2019 | Prometheus 101 – Getting you started | Alexander Schwartz 39 • If an alerting rule doesn’t match any metric, it will not alert To avoid this: Use unless operator
  34. groups: - name: example rules: - alert: MyJobMissing expr: absent(up{job="myjob"})

    for: 10m Watching out for Pitfalls 1. https://www.robustperception.io/absent-alerting-for-jobs Alerting on no node available © msg | May 2019 | Prometheus 101 – Getting you started | Alexander Schwartz 40 • If no node is available, a count and other operators will return no value To avoid this: Use absent operator
  35. Watching out for Pitfalls 1. https://prometheus.io/docs/practices/naming/ High Availability © msg

    | May 2019 | Prometheus 101 – Getting you started | Alexander Schwartz 41 • Use multiple Prometheus servers to scrape the same targets to provide high availability • Use multiple Alert Managers to de-duplicate alerts sent from Prometheus, but to ensure each alert is sent at least once Pros: Shared nothing infrastructure, moderate complexity Cons: Each Prometheus might have a different view Prometheus Slack Alertmanager Alertmanager Prometheus Application
  36. Prometheus 101 – Getting you started © msg | May

    2019 | Prometheus 101 – Getting you started | Alexander Schwartz 42 Installing and Configuring 1 Capturing Metrics 2 Creating Dashboards 3 Sending Alerts 4 Watching out for Pitfalls 5 Summary 6
  37. Summary © msg | May 2019 | Prometheus 101 –

    Getting you started | Alexander Schwartz 43 • Prometheus can ingest lots of metrics efficiently and stores them in its own time series database. • PromQL, the query language of Prometheus, can relate infrastructure and application metrics. It is the basis for dashboards and alerts. • Prometheus can run natively on multiple platforms and inside Docker containers. • For best results run with a fast local disk and enough RAM. • Metrics are pulled (“scraped”) from exporters; for short-lived jobs there is a push gateway. • Create a highly available, shared nothing infrastructure for production. • Use service discovery to pull metrics from new instances without manual re-configuration.
  38. Links © msg | May 2019 | Prometheus 101 –

    Getting you started | Alexander Schwartz 44 Prometheus https://prometheus.io/ Grafana https://grafana.com/ Robust Perception’s blog https://www.robustperception.io/blog Google’s SRE Book https://landing.google.com/sre/sre-book/chapters/monitoring-distributed-systems/ Chrome Prometheus Formatter https://landing.google.com/sre/sre-book/chapters/monitoring-distributed-systems @ahus1de PromCon https://promcon.io/ Micrometer http://micrometer.io/ My Blog Posts https://www.ahus1.de/post/micrometer https://www.ahus1.de/post/prometheus-and-grafana-talks
  39. .consulting .solutions .partnership Alexander Schwartz Principal IT Consultant +49 171

    5625767 [email protected] msg systems ag Mergenthalerallee 73-75, 65760 Eschborn Deutschland www.msg.group