Upgrade to Pro
— share decks privately, control downloads, hide ads and more …
Speaker Deck
Features
Speaker Deck
PRO
Sign in
Sign up for free
Search
Search
Datavisualisation automatique de grand jeux de ...
Search
Sponsored
·
Ship Features Fearlessly
Turn features on and off without deploys. Used by thousands of Ruby developers.
→
visualisation de données
November 16, 2017
Technology
330
0
Share
Embed
Copy iframe code
Copy JS code
Copy link
Start on current slide
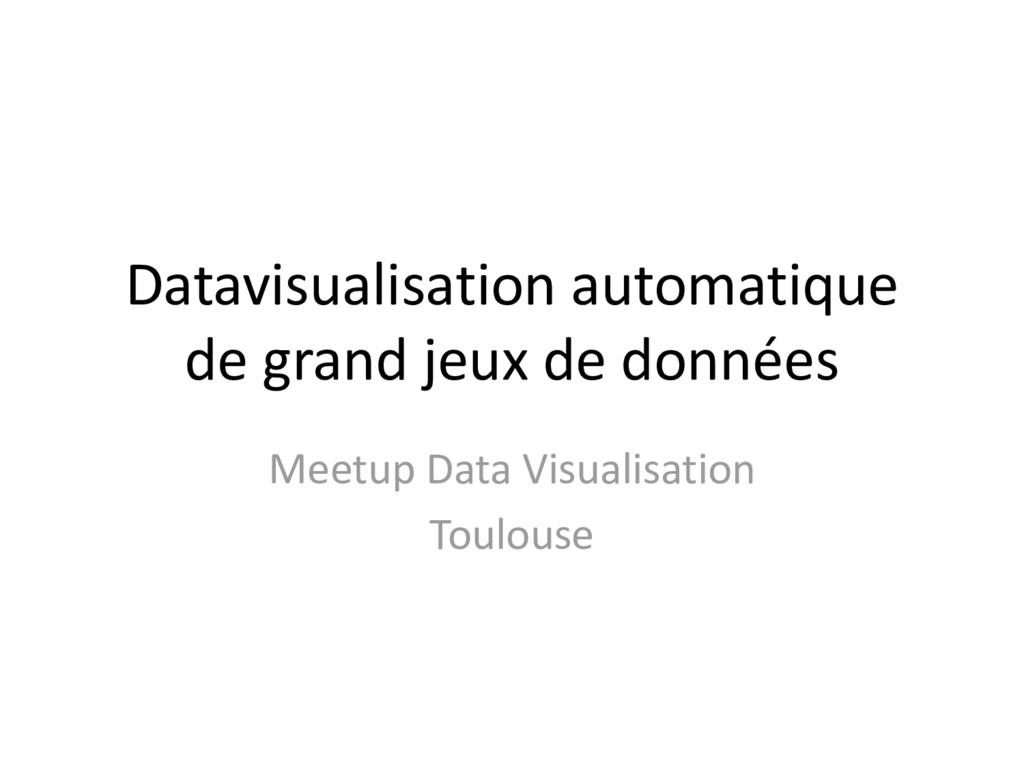
Datavisualisation automatique de grand jeux de données
Meetup visualisation de données Toulouse
visualisation de données
November 16, 2017
More Decks by visualisation de données
See All by visualisation de données
Arabesque : Explorer et visualiser facilement vos flux géo-localisés sur le web
alaino
0
390
Meetup TDV - 4/02/21 -Valoriser les données très hétérogènes d'Open Street Map
alaino
0
360
Optimisation des prix : Techniques et Visualisation
alaino
0
310
Mobiliscope
alaino
0
300
CREER DES CARTES AVEC QGIS ET DES OPEN DATA
alaino
0
490
The Vistorian & the Bertifier
alaino
0
700
La représentation des données en neuroscience cognitive
alaino
0
460
La représentation des données en neuroscience cognitive
alaino
0
400
Histoire de dataviz -(Eugénie Clement)
alaino
0
350
Other Decks in Technology
See All in Technology
Vポイント分析基盤におけるデータモデリング20年史
taromatsui_cccmkhd
4
780
AI エージェント時代のデジタルアイデンティティ
fujie
0
280
コンポーネント名には何を含めるべきなのか? / what-should-be-included-in-component-names
airrnot1106
0
140
副作用のある Lambda でも Lambda Power Tuning は使えるのか / lambda-power-tuning-side-effects
koukihosaka
2
160
Webの技術とガジェットで子どもも大人も楽しめるワクワク体験を提供する / Qiita Tech Festa Day 2026
you
PRO
1
300
論語・武士道・産業革命から見る かわるもの、かわらないもの
ichimichi
8
1.4k
なぜ、あなたのエージェントは言うことを聞かないのか
segavvy
1
540
41歳でAWSが好きすぎてITエンジニアになったおっさんの話
yama3133
1
780
変更し続けられるシステムをどう保つか — AI時代のSSoTという設計原則
kawauso
1
1.4k
オートマトンと字句解析でRoslynを読む
tomokusaba
0
110
Git 研修【MIXI 26新卒技術研修】#2
mixi_engineers
PRO
1
360
StepFunctionsとGraphRAGを活用した暗黙知活用のためのRAG基盤
yakumo
0
180
Featured
See All Featured
Fantastic passwords and where to find them - at NoRuKo
philnash
52
3.8k
A Guide to Academic Writing Using Generative AI - A Workshop
ks91
PRO
1
360
Designing Experiences People Love
moore
143
24k
Future Trends and Review - Lecture 12 - Web Technologies (1019888BNR)
signer
PRO
0
3.6k
A better future with KSS
kneath
240
18k
Visual Storytelling: How to be a Superhuman Communicator
reverentgeek
2
600
Speed Design
sergeychernyshev
33
1.9k
Unsuck your backbone
ammeep
672
58k
Winning Ecommerce Organic Search in an AI Era - #searchnstuff2025
aleyda
1
2.1k
How to Align SEO within the Product Triangle To Get Buy-In & Support - #RIMC
aleyda
2
1.7k
Tips & Tricks on How to Get Your First Job In Tech
honzajavorek
1
630
Game over? The fight for quality and originality in the time of robots
wayneb77
1
230
Transcript
Datavisualisation automatique de grand jeux de données Meetup Data Visualisation
Toulouse
None
La data-visualisation pour explorer les données
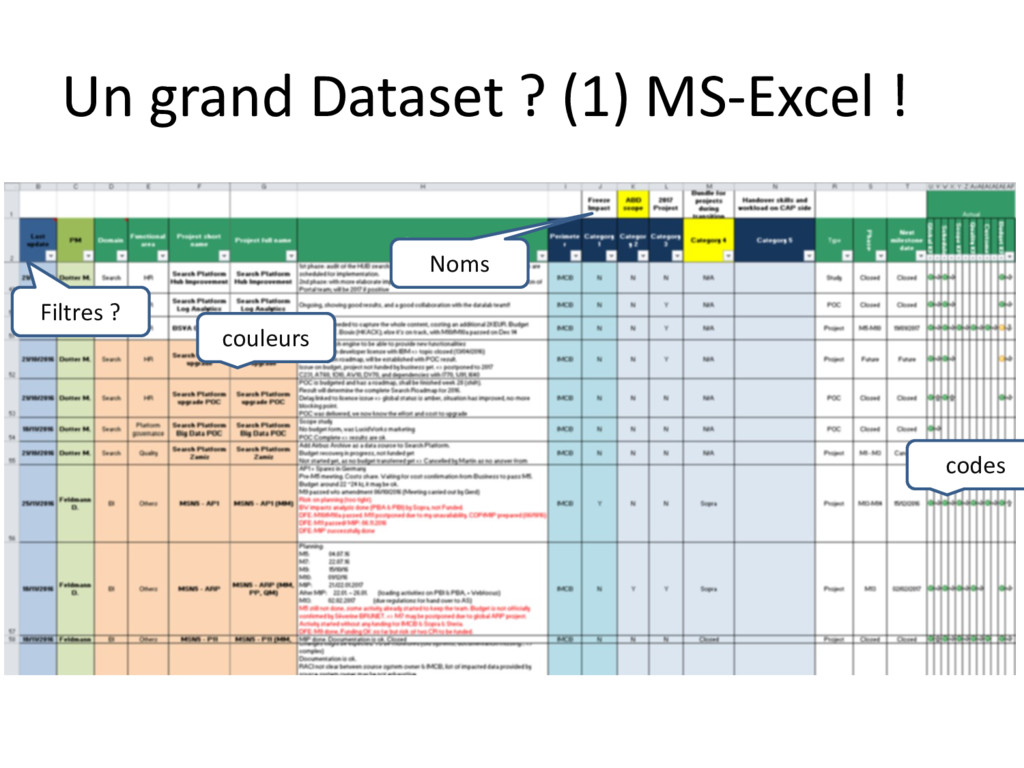
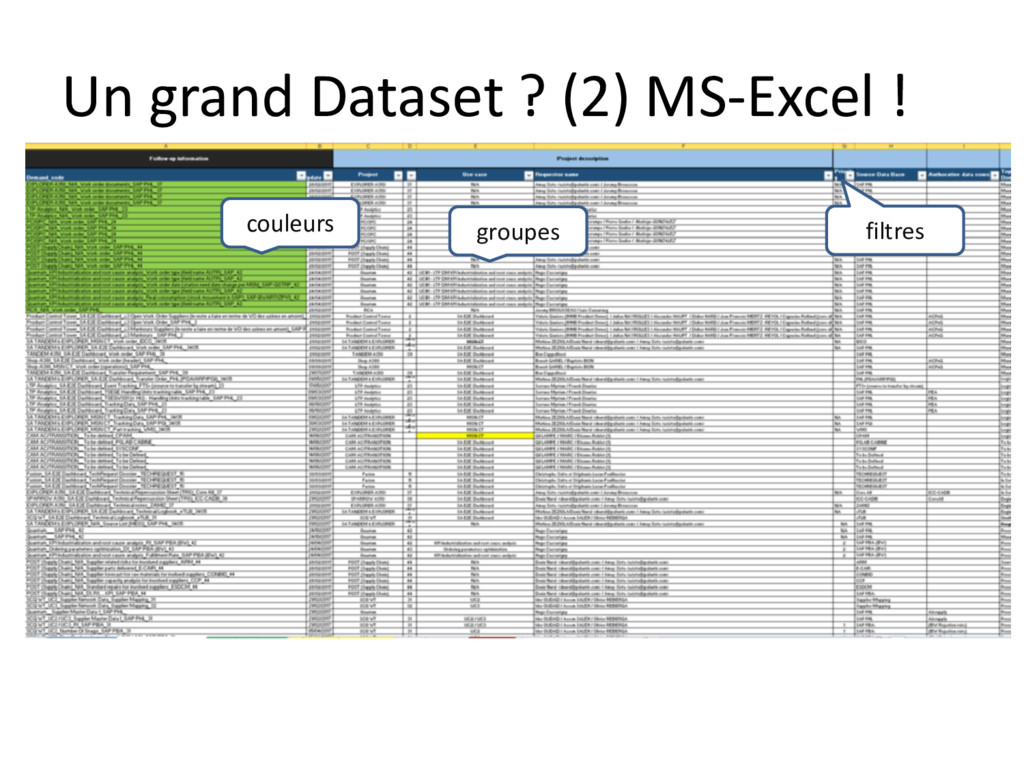
Un grand Dataset ? (1) MS-Excel ! couleurs codes Filtres
? Noms
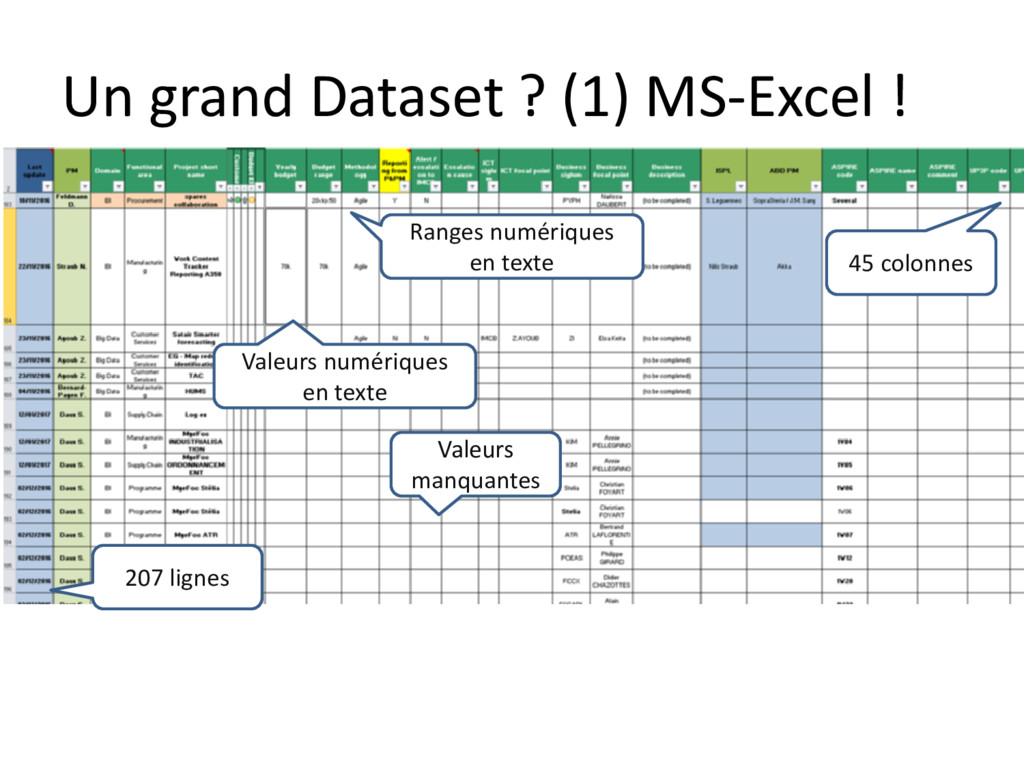
Un grand Dataset ? (1) MS-Excel ! Valeurs manquantes 45
colonnes 207 lignes Valeurs numériques en texte Ranges numériques en texte
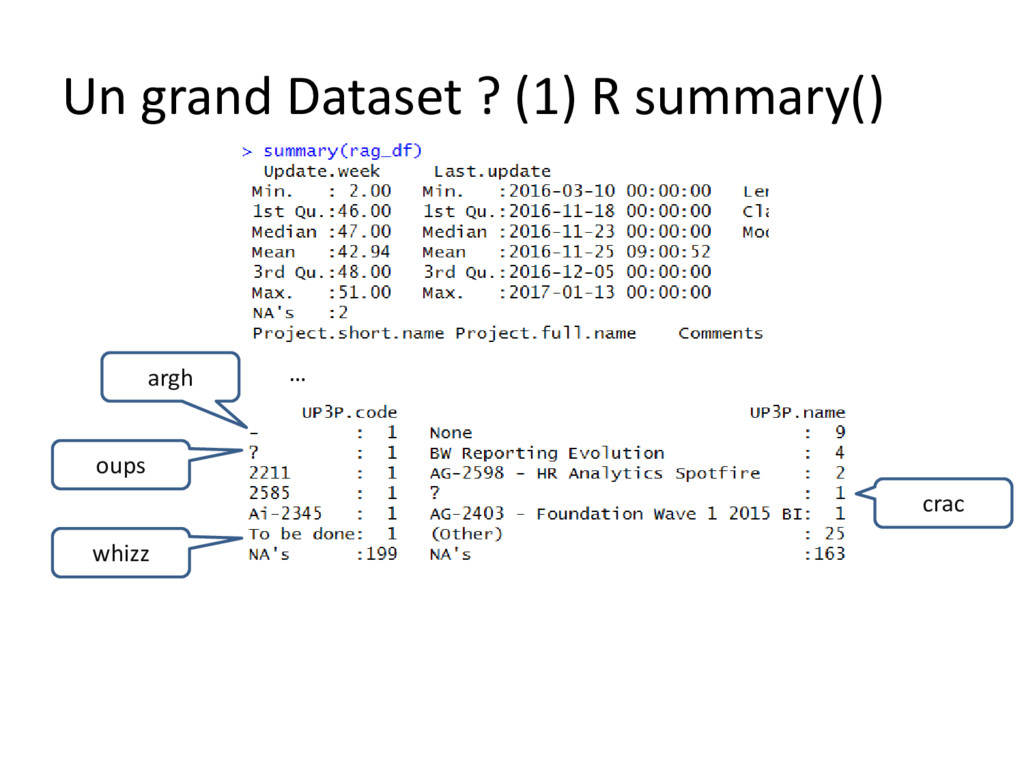
Un grand Dataset ? (1) R summary() argh oups whizz
crac …
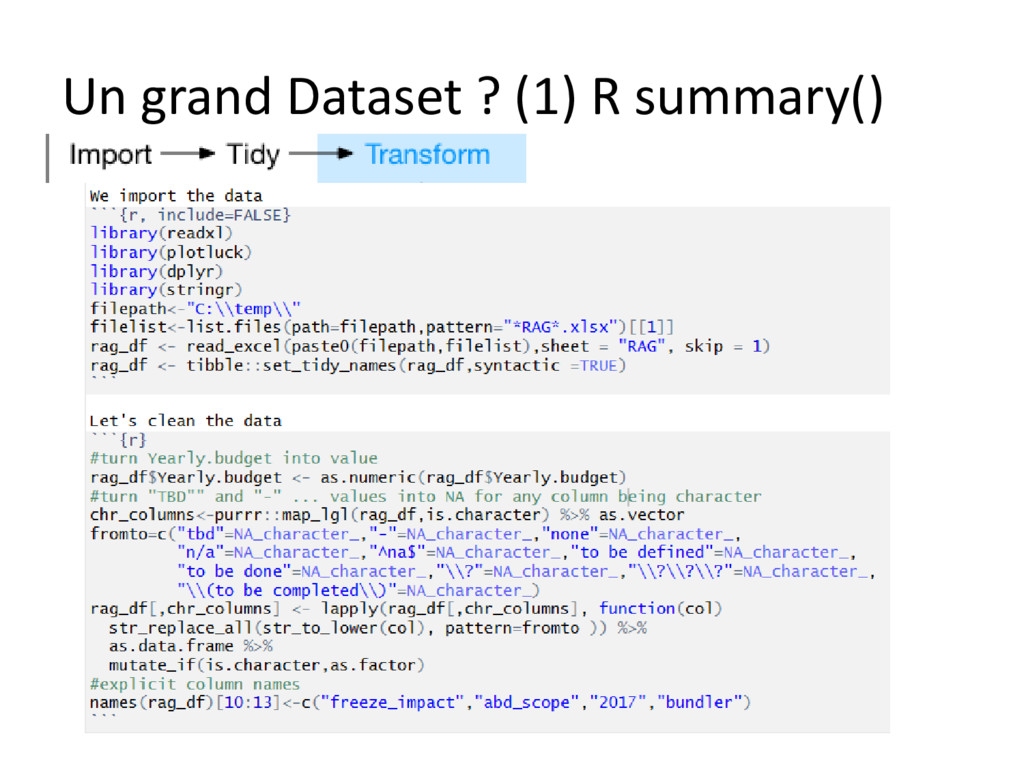
Un grand Dataset ? (1) R summary()
Un grand Dataset ? (1) R summary()
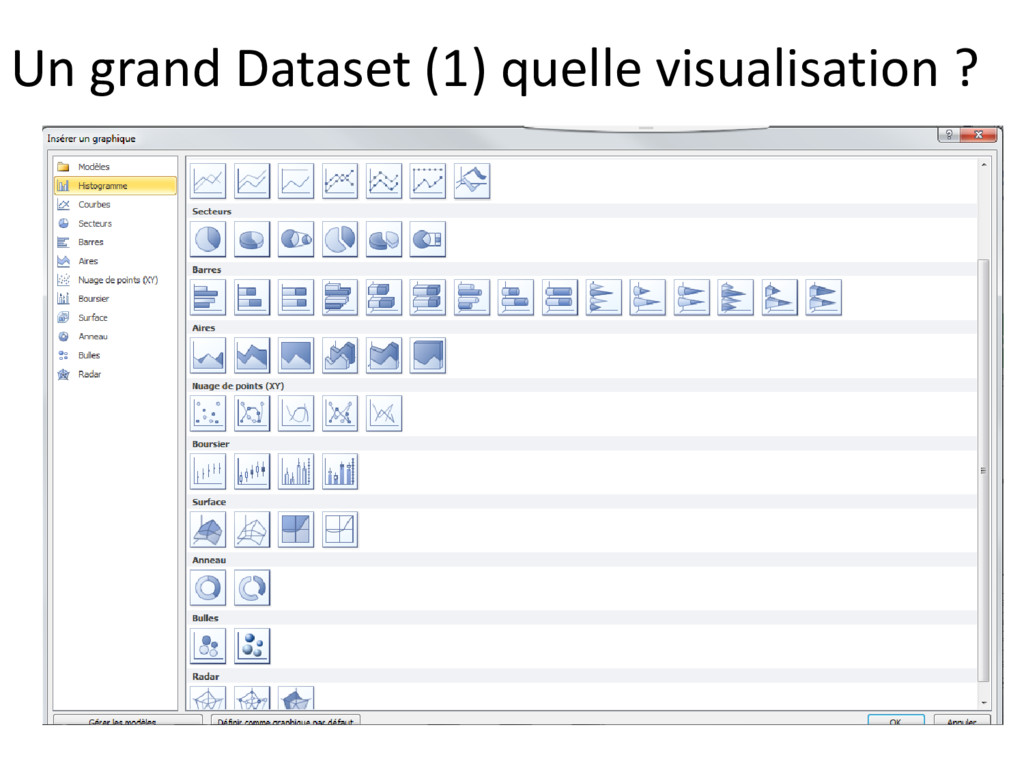
Un grand Dataset (1) quelle visualisation ?
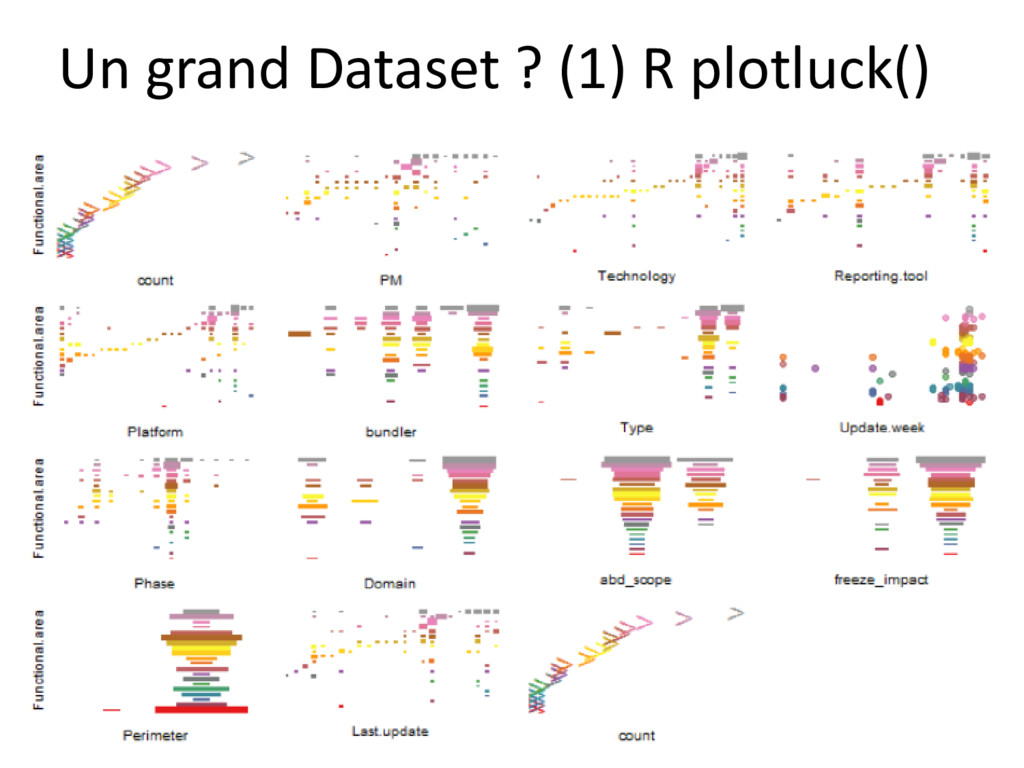
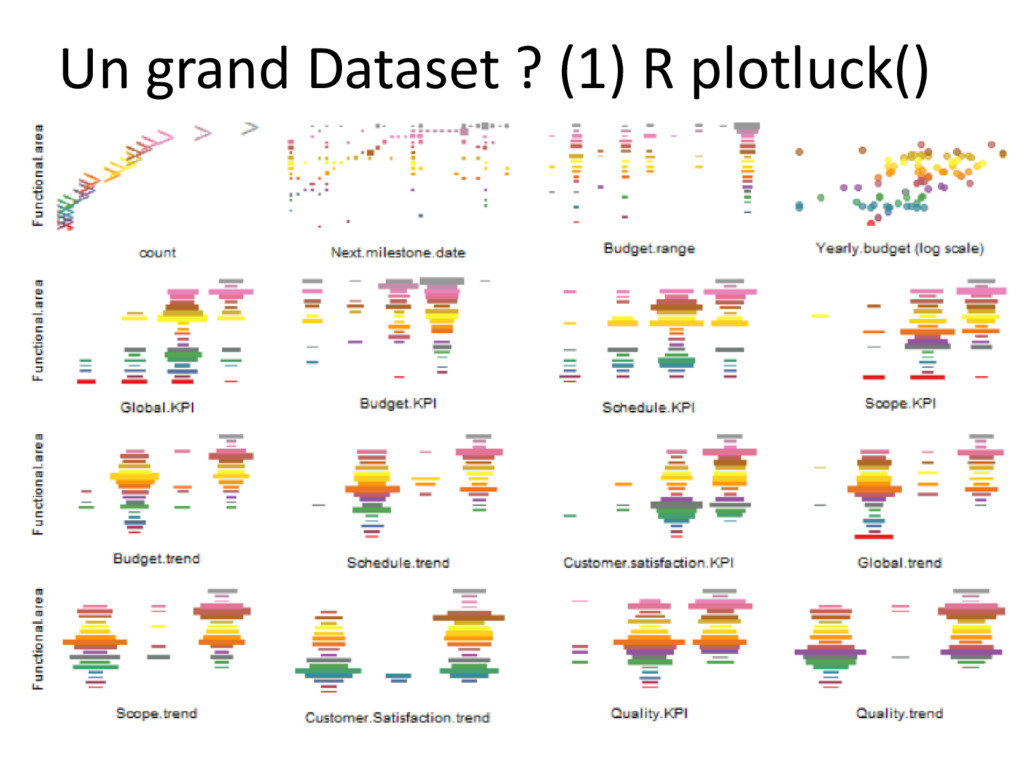
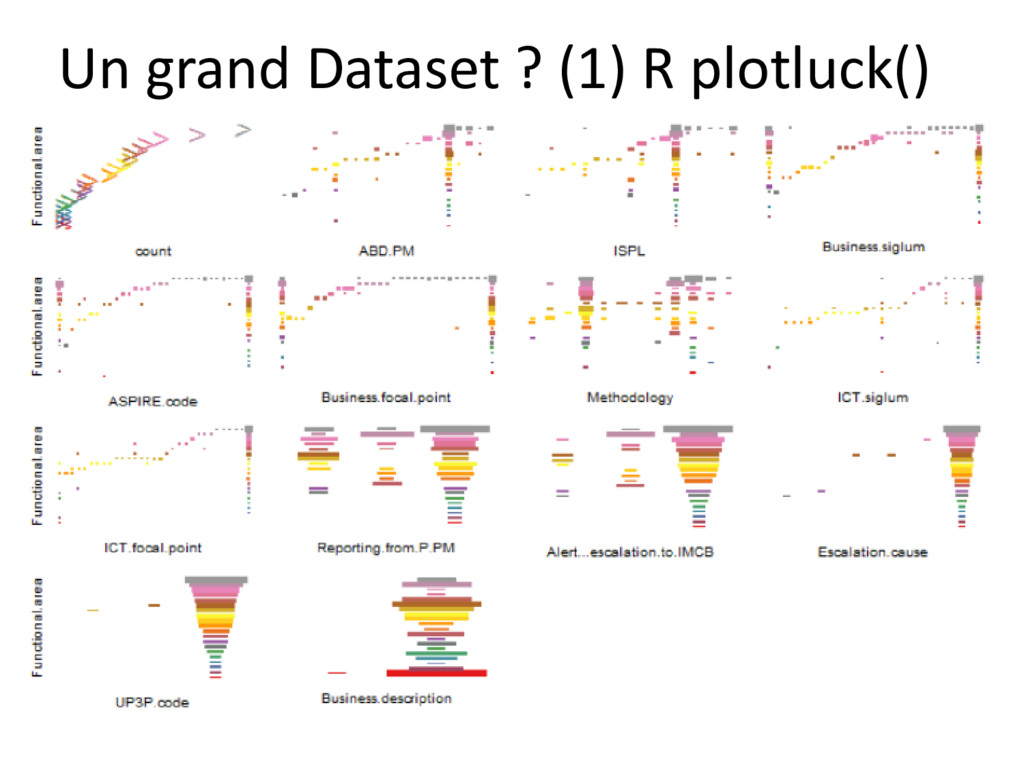
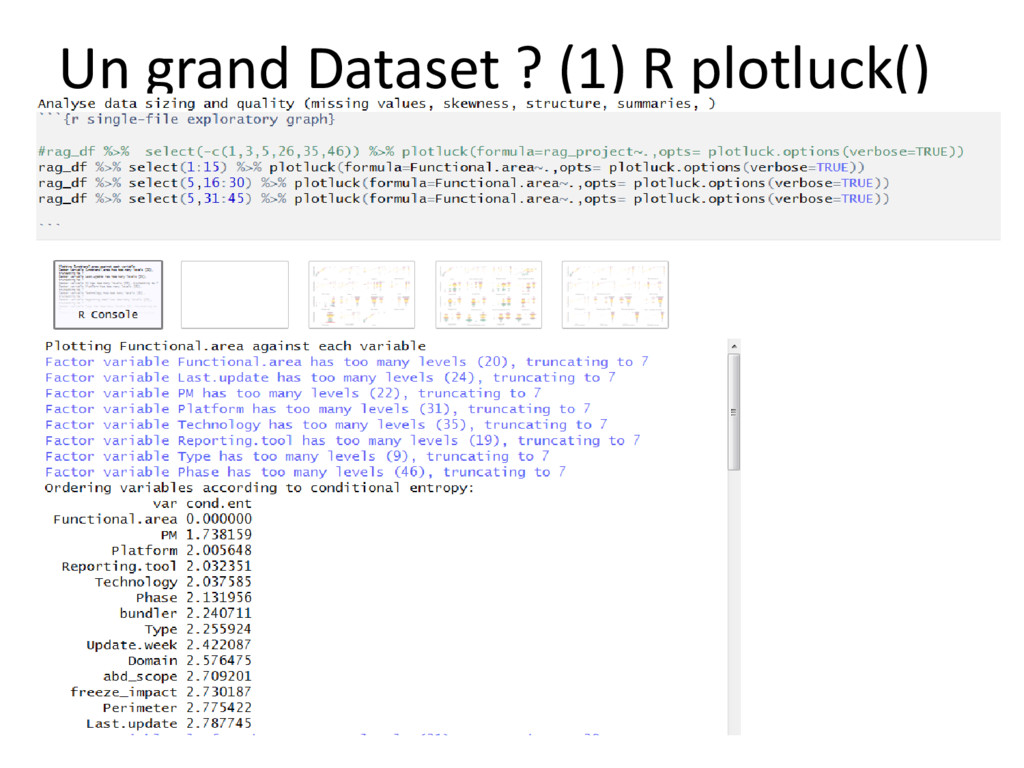
Un grand Dataset ? (1) R plotluck()
Un grand Dataset ? (1) R plotluck()
Un grand Dataset ? (1) R plotluck()
Un grand Dataset ? (1) R plotluck()
Un grand Dataset ? (2) MS-Excel ! couleurs groupes filtres
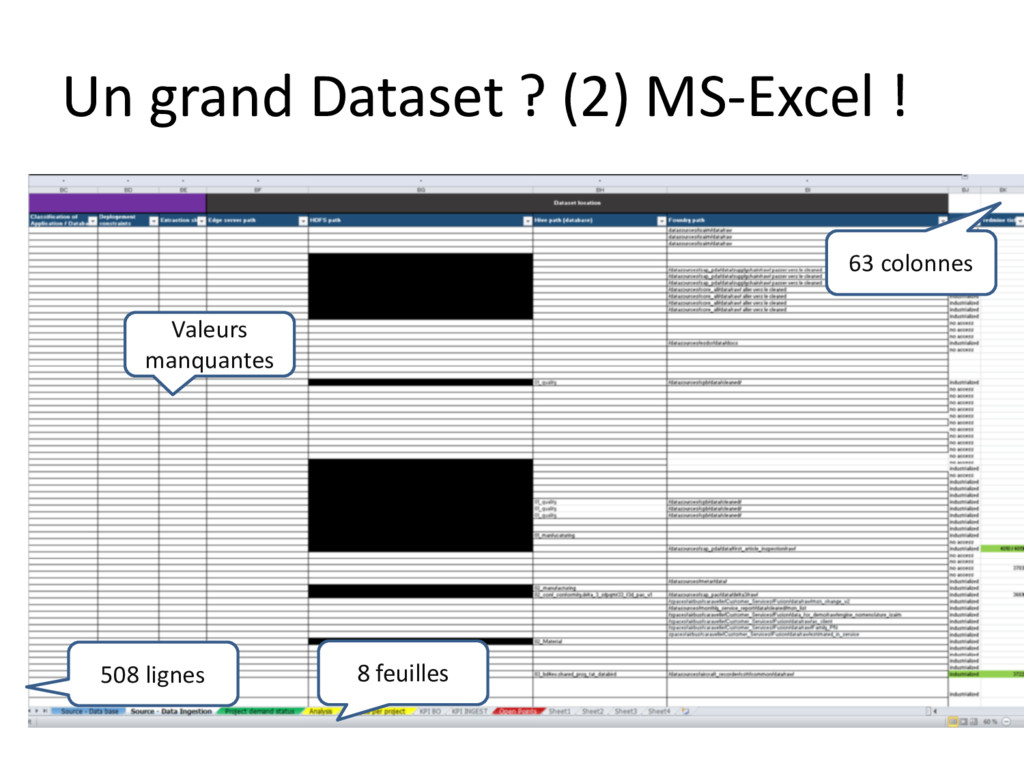
Un grand Dataset ? (2) MS-Excel ! Valeurs manquantes 63
colonnes 508 lignes 8 feuilles
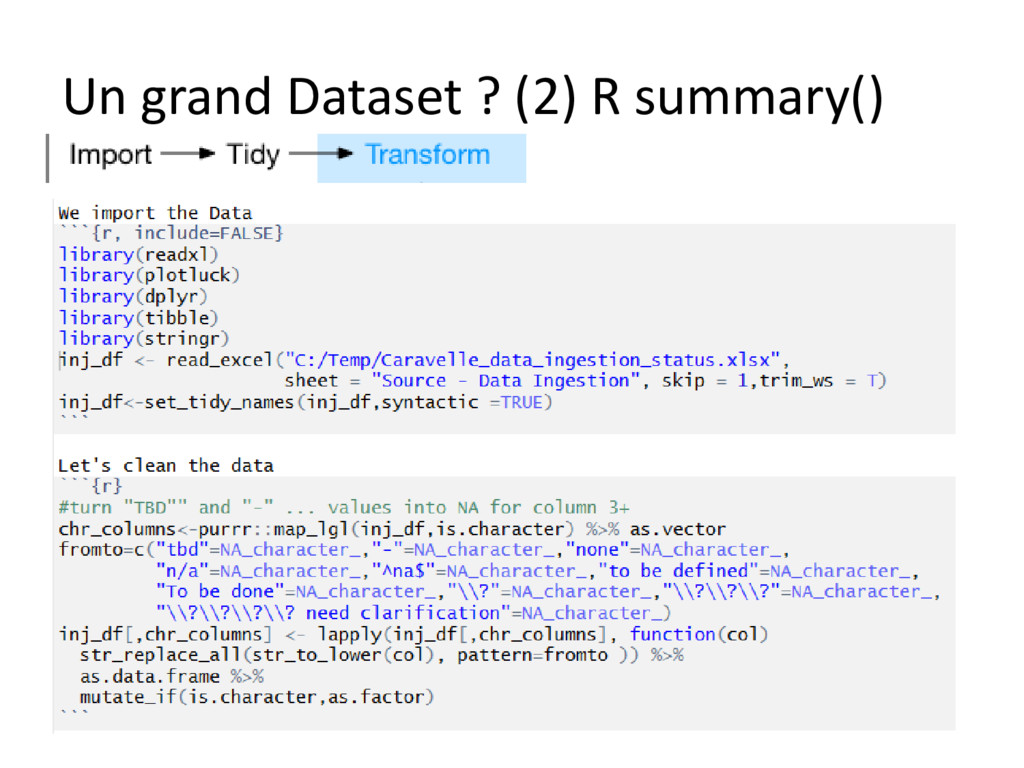
Un grand Dataset ? (2) R summary() argh oups whizz
crac
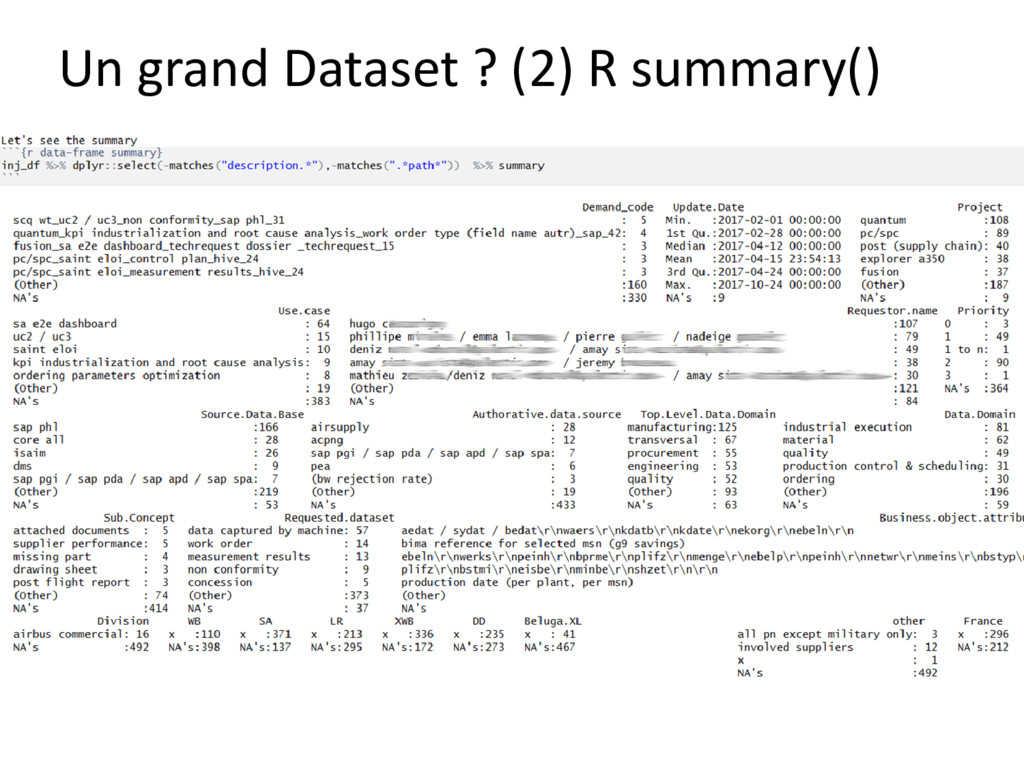
Un grand Dataset ? (2) R summary()
Un grand Dataset ? (2) R summary()
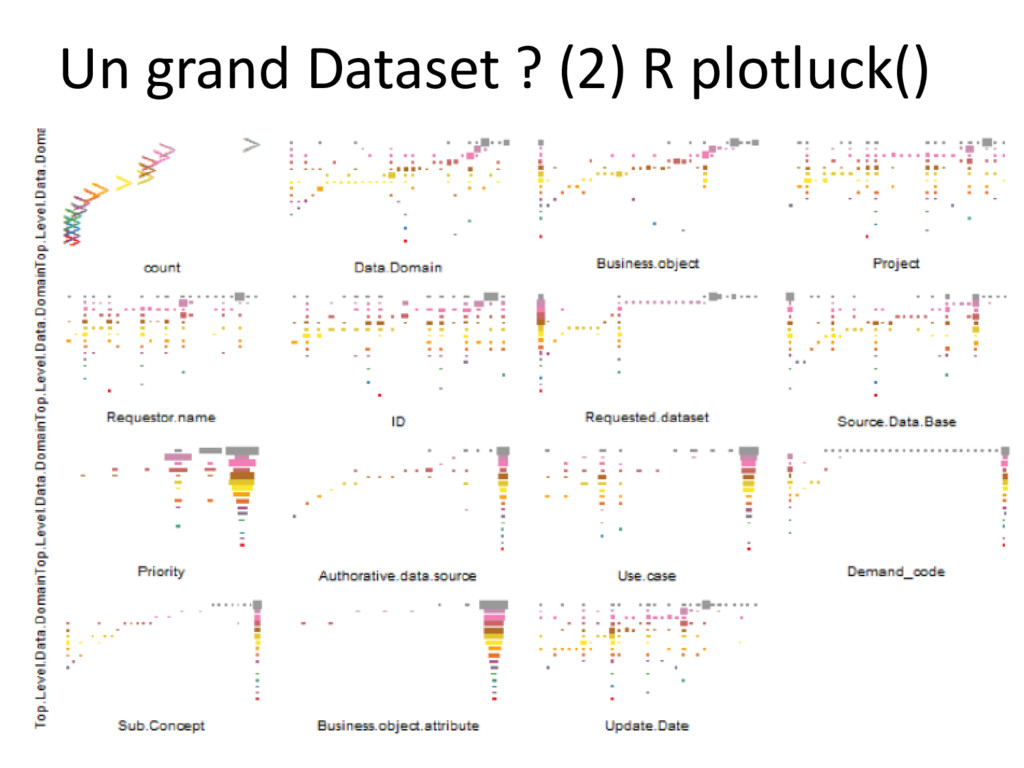
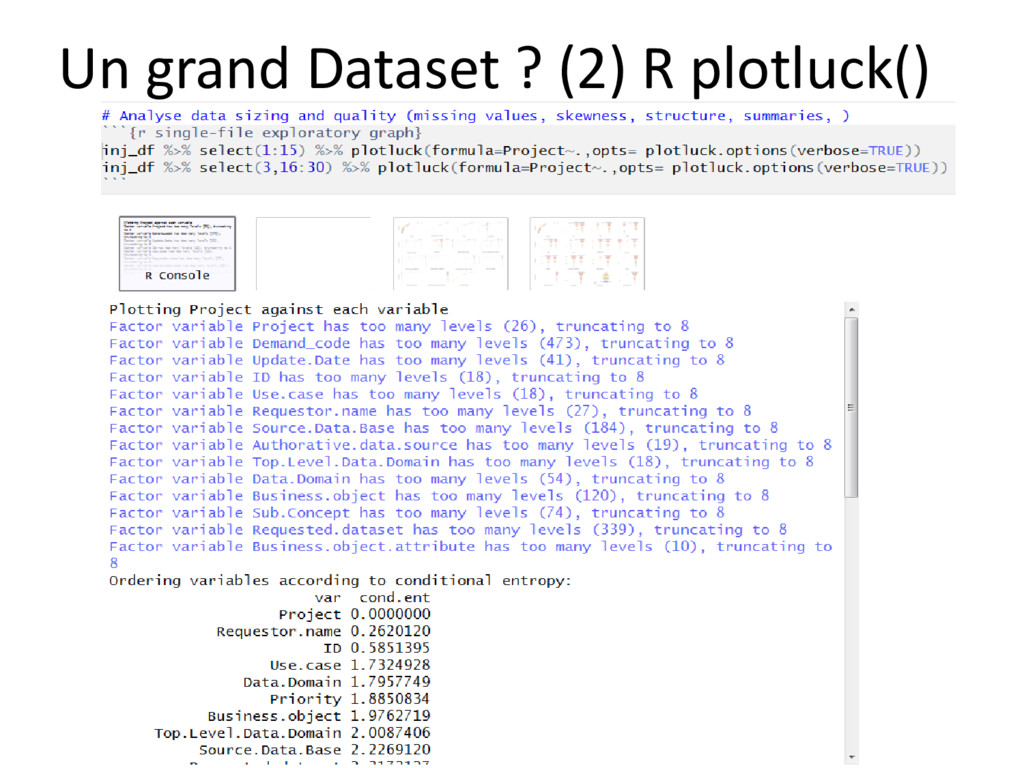
Un grand Dataset ? (2) R plotluck()
Un grand Dataset ? (2) R plotluck()
Un grand Dataset ? (2) R plotluck()
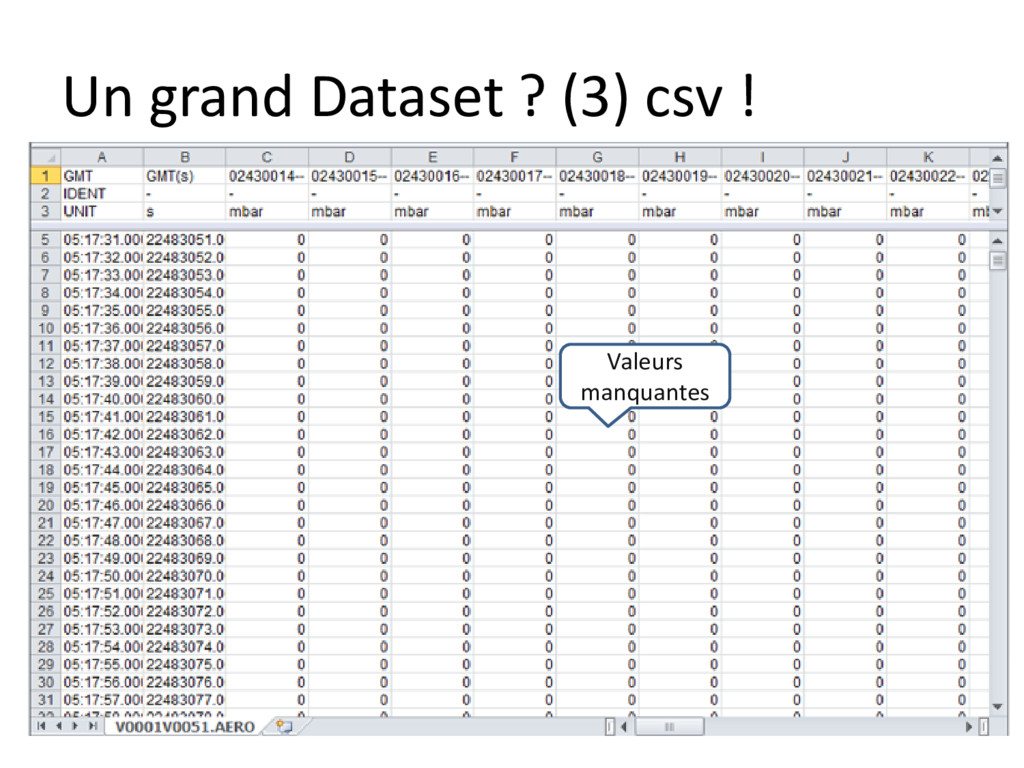
Un grand Dataset ? (3) csv ! Valeurs manquantes
Un grand Dataset ? (3) csv ! 51 colonnes 18000
lignes
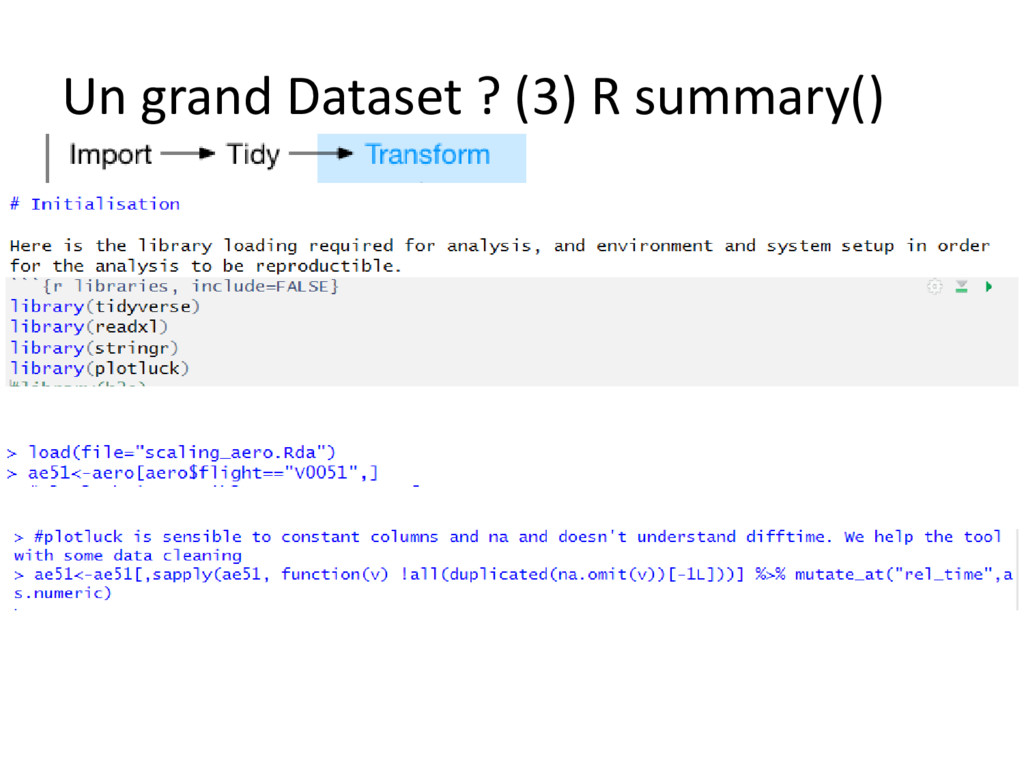
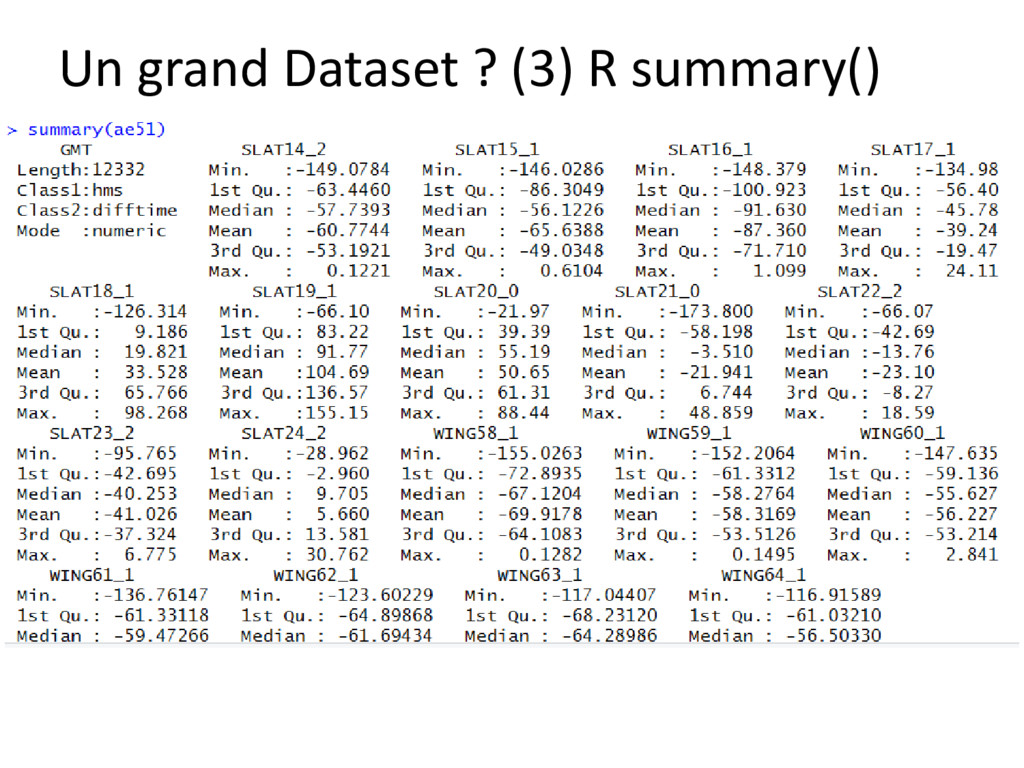
Un grand Dataset ? (3) R summary()
Un grand Dataset ? (3) R summary()
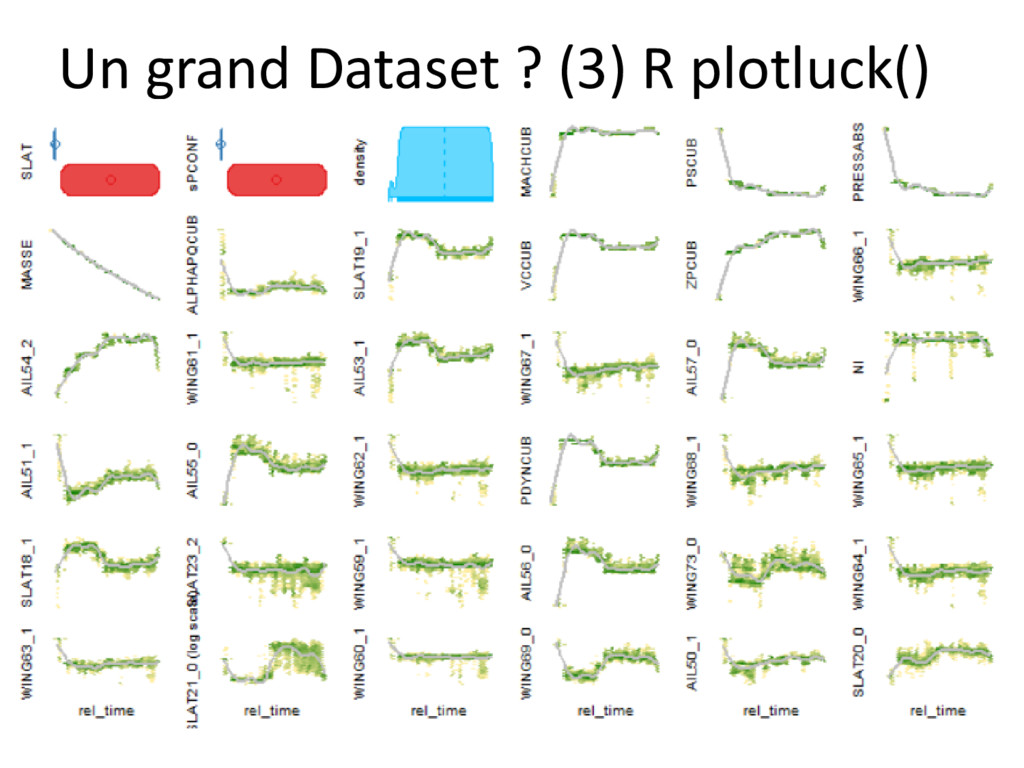
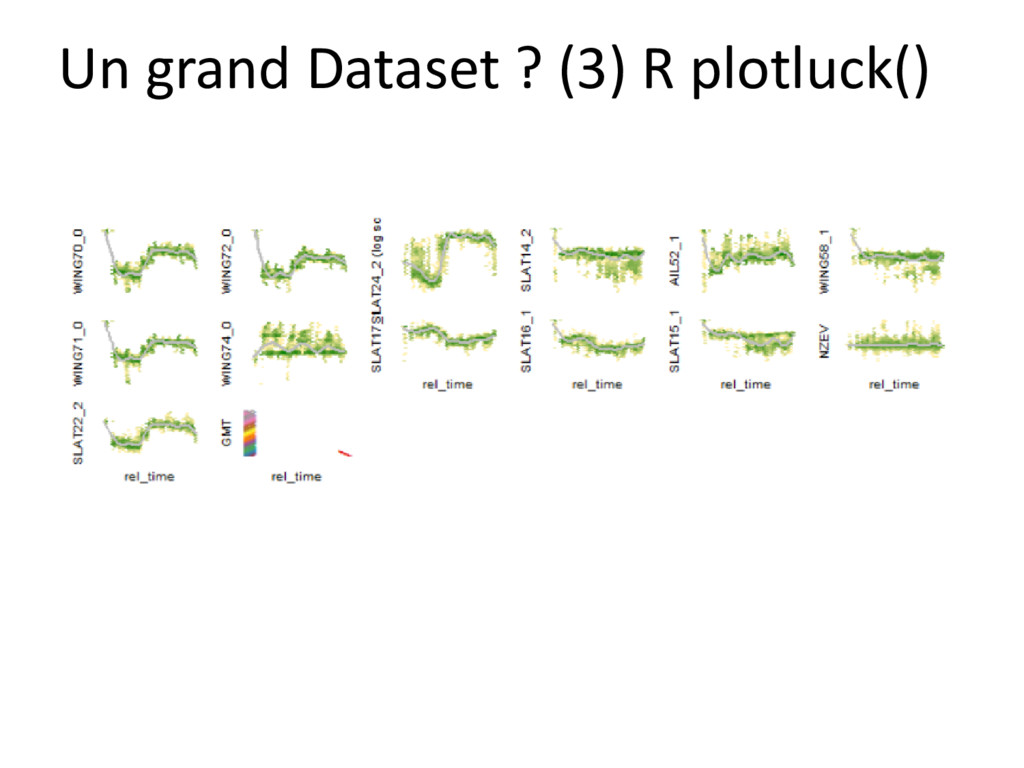
Un grand Dataset ? (3) R plotluck()
Un grand Dataset ? (3) R plotluck()
Un grand Dataset ? (3) R plotluck()
Un grand Dataset ? (3) R plotluck()
Et vous, quel est votre outil ?