Upgrade to Pro
— share decks privately, control downloads, hide ads and more …
Speaker Deck
Features
Speaker Deck
PRO
Sign in
Sign up for free
Search
Search
Tableau study group - 5
Search
Alberto Lusoli
January 13, 2021
Education
190
0
Share
Embed
Copy iframe code
Copy JS code
Copy link
Start on current slide
Tableau study group - 5
Alberto Lusoli
January 13, 2021
More Decks by Alberto Lusoli
See All by Alberto Lusoli
AI and Creativity - Professional Responsibility and Technical Writing (CMPT 376W)
albertolusoli
0
180
Make Fail Repeat - Digital Democracies Institute - University of Korea symposium
albertolusoli
0
120
CMNS201 - Lab 8. Assignment 3
albertolusoli
0
100
Remote work and the redrawing of the US rural imaginary during the COVID-19 Pandemic
albertolusoli
0
560
CMNS201 - Lab 7. SPSS Multivariate Analysis
albertolusoli
0
270
CMNS201 - Lab 6. SPSS Bivariate Analysis, Crosstab
albertolusoli
0
450
CMNS201 - Lab 5. Charts in SPSS
albertolusoli
1
410
CMNS201 - Lab 4. SPSS Univariate Analysis
albertolusoli
0
360
CMNS201 - Lab 3. SPSS Variables recoding
albertolusoli
0
360
Other Decks in Education
See All in Education
Portable & Reproducible Research Environments in the Age of AI Agents
denkiwakame
0
550
2026年度春学期 統計学 第13回 不確かな測定の不確かさを測る ― 不偏分散とt分布 (2026. 6. 25)
akiraasano
PRO
1
140
Where Data Meets Storytelling
georgesinnott
0
140
生成AI時代の情報発信
molmolken
0
150
!コスパよくインターンに受かる方法!
ruribou
1
310
2026年度春学期 統計学 第10回 分布の推測とは - 標本調査,度数分布と確率分布 (2026. 6. 4)
akiraasano
PRO
0
160
【デザイナー就活講座】 デザイナー就活市場・企業探し・ポートフォリオのポイント
koheihasebe
0
350
現場最前線から教えるデータサイエンス1 -ITベンダーにおけるデータサイエンティスト-
hidetoshikawaguchi
0
140
BITCOIN : Les fondamentaux !
rlifchitz
0
200
プログラミング言語において文字列を複数行にわたって だらだらと記載するアレ
sapi_kawahara
0
180
Visionary Initiative: Materials-Positive Society 「モノの進化をポジティブな社会の原動力に」|Science Tokyo(東京科学大学)
sciencetokyo
PRO
0
820
Info Session MSc Computer Science & MSc Applied Informatics
signer
PRO
0
300
Featured
See All Featured
The innovator’s Mindset - Leading Through an Era of Exponential Change - McGill University 2025
jdejongh
PRO
1
230
How to Grow Your eCommerce with AI & Automation
katarinadahlin
PRO
1
230
Balancing Empowerment & Direction
lara
6
1.2k
Joys of Absence: A Defence of Solitary Play
codingconduct
1
420
Digital Projects Gone Horribly Wrong (And the UX Pros Who Still Save the Day) - Dean Schuster
uxyall
1
2.1k
Why Your Marketing Sucks and What You Can Do About It - Sophie Logan
marketingsoph
0
330
Chrome DevTools: State of the Union 2024 - Debugging React & Beyond
addyosmani
10
1.3k
The Psychology of Web Performance [Beyond Tellerrand 2023]
tammyeverts
49
3.5k
It's Worth the Effort
3n
188
29k
Odyssey Design
rkendrick25
PRO
2
740
Skip the Path - Find Your Career Trail
mkilby
1
170
4 Signs Your Business is Dying
shpigford
187
22k
Transcript
study group
Table Calculations
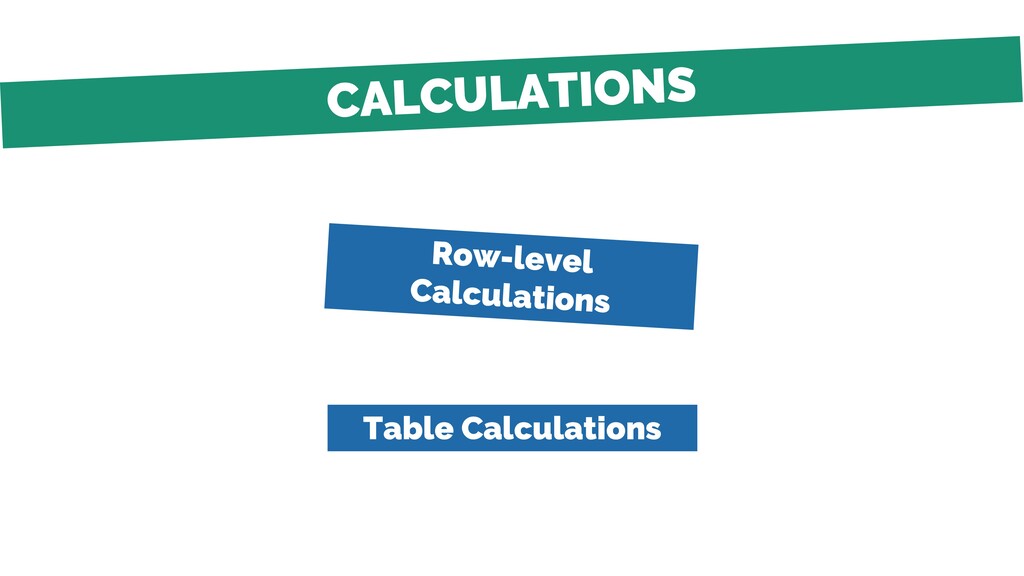
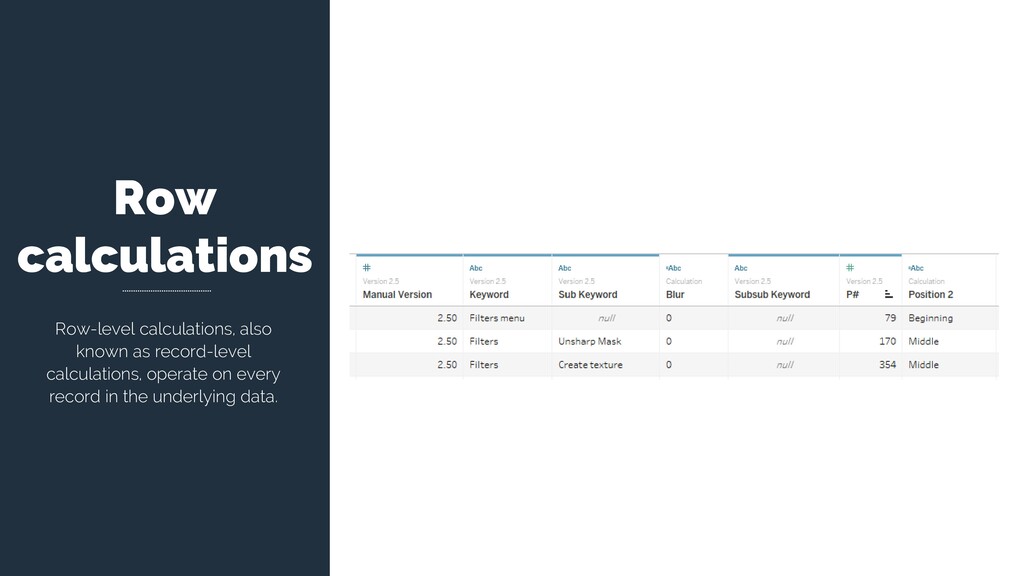
Row calculations Row-level calculations, also known as record-level calculations, operate
on every record in the underlying data.
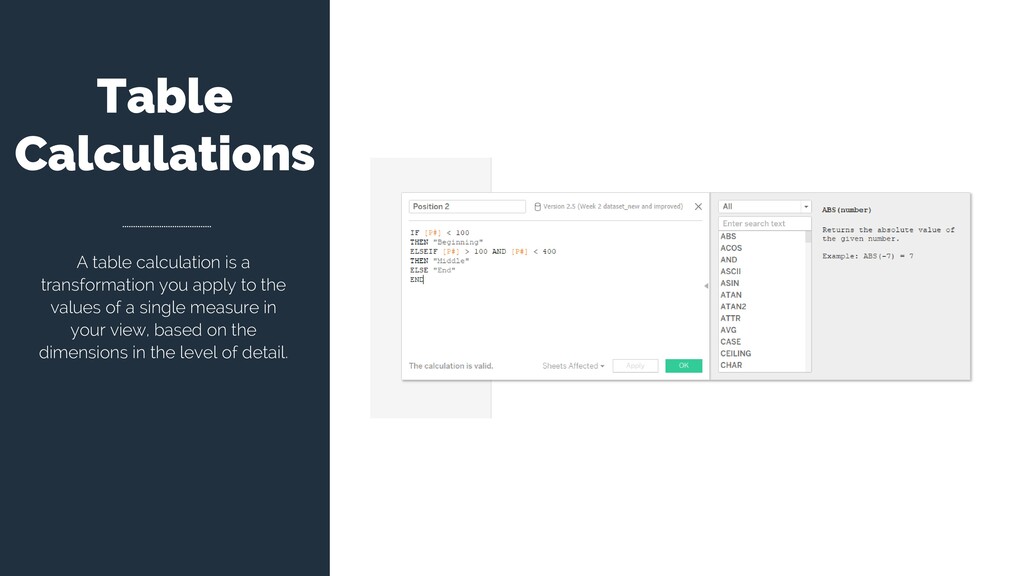
Table Calculations A table calculation is a transformation you apply
to the values of a single measure in your view, based on the dimensions in the level of detail.
None
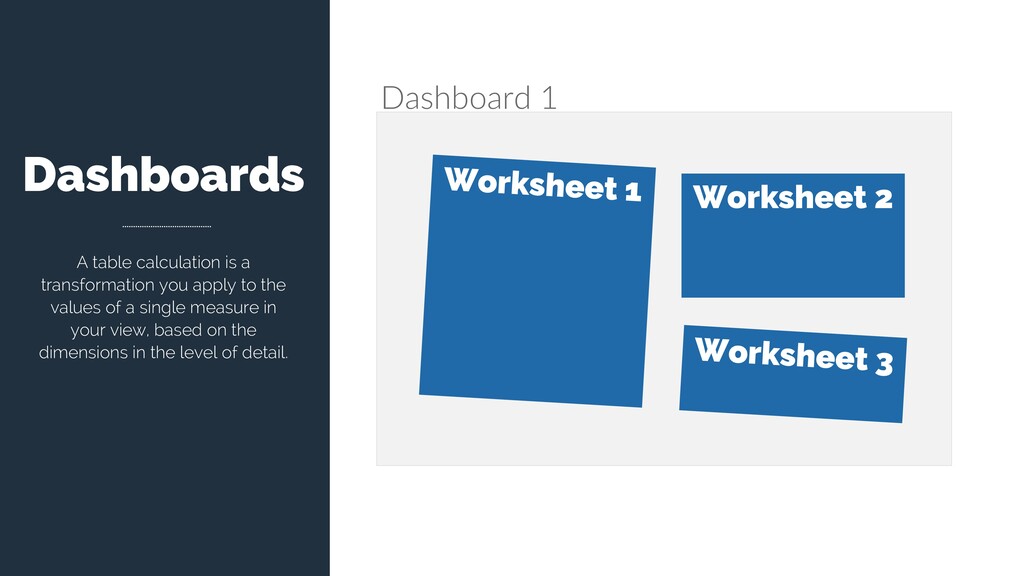
Dashboards A table calculation is a transformation you apply to
the values of a single measure in your view, based on the dimensions in the level of detail. Worksheet 2 Dashboard 1
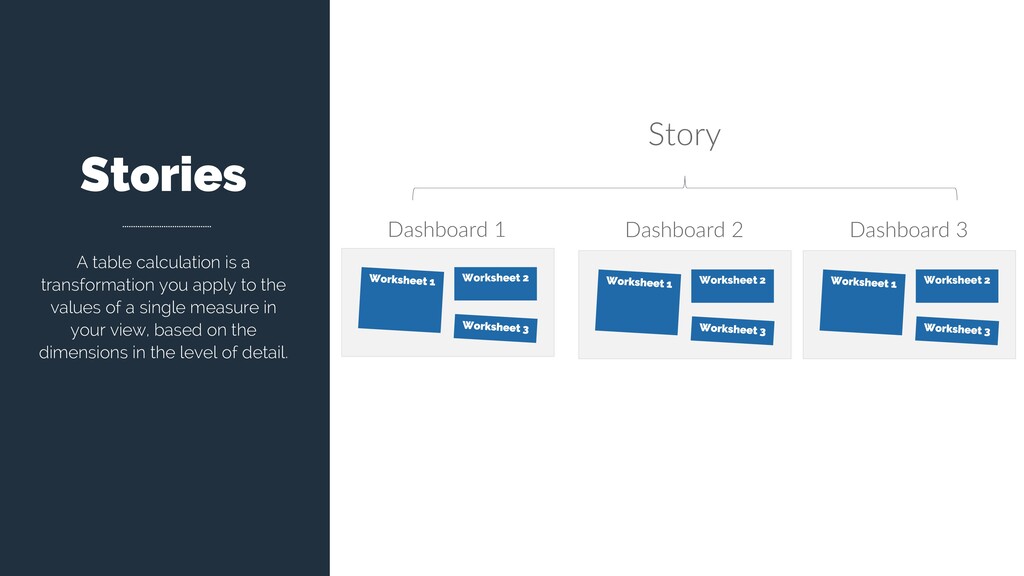
Stories A table calculation is a transformation you apply to
the values of a single measure in your view, based on the dimensions in the level of detail. Worksheet 2 Dashboard 1 Worksheet 2 Dashboard 2 Worksheet 2 Dashboard 3 Story
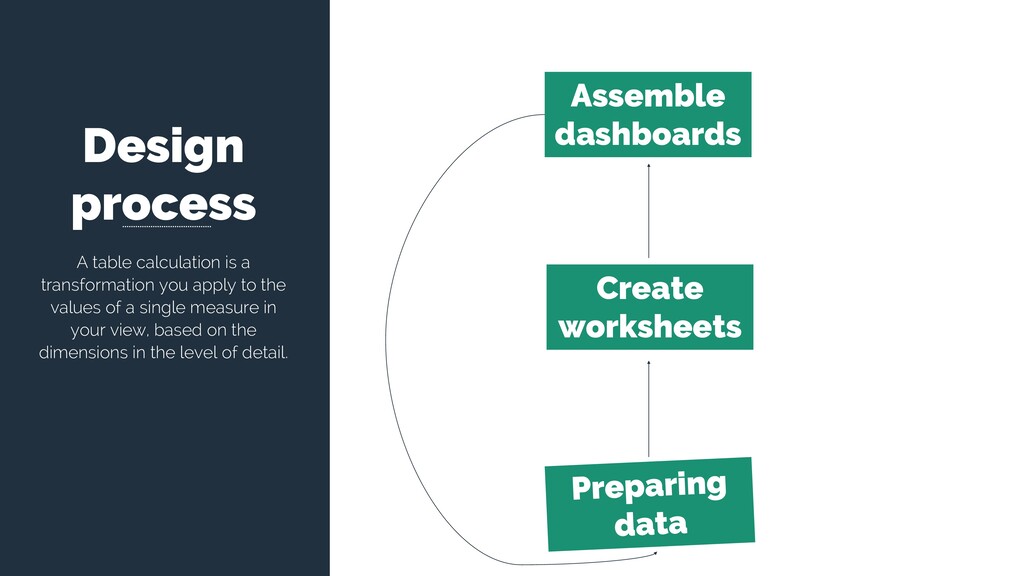
Design process A table calculation is a transformation you apply
to the values of a single measure in your view, based on the dimensions in the level of detail. Create worksheets Assemble dashboards
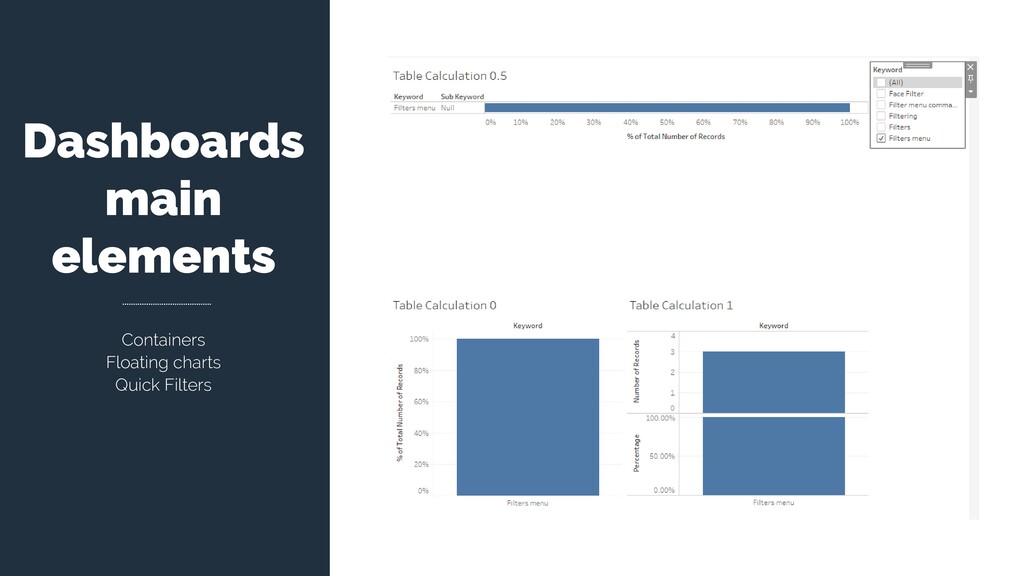
Dashboards main elements Containers Floating charts Quick Filters
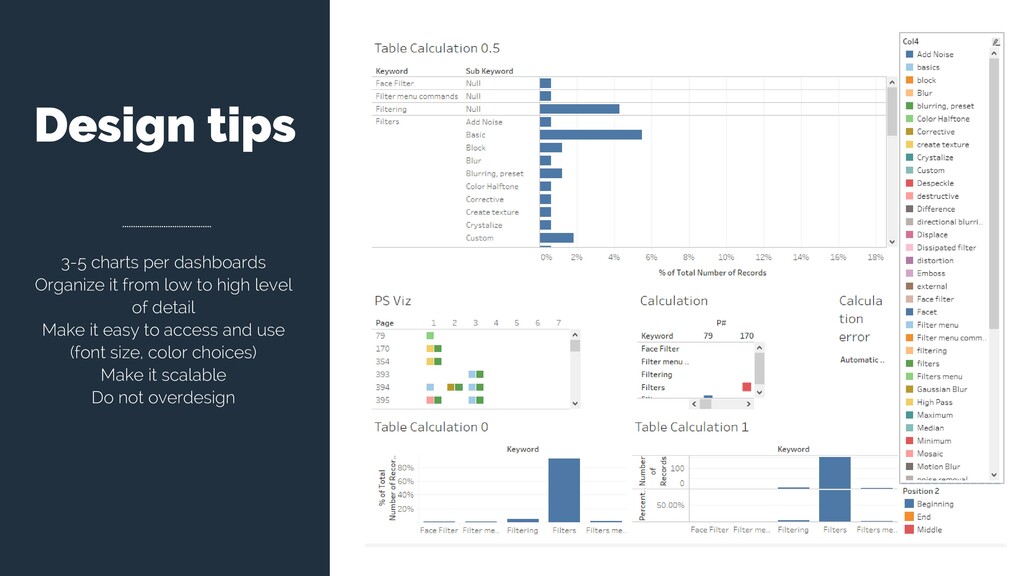
Design tips 3-5 charts per dashboards Organize it from low
to high level of detail Make it easy to access and use (font size, color choices) Make it scalable Do not overdesign
For questions or help, write me at:
[email protected]
THANK YOU
![For questions or help, write me at: [email protected] THANK YOU](https://files.speakerdeck.com/presentations/cba3b96db9c24e6b86a8498619798e39/slide_10.jpg)