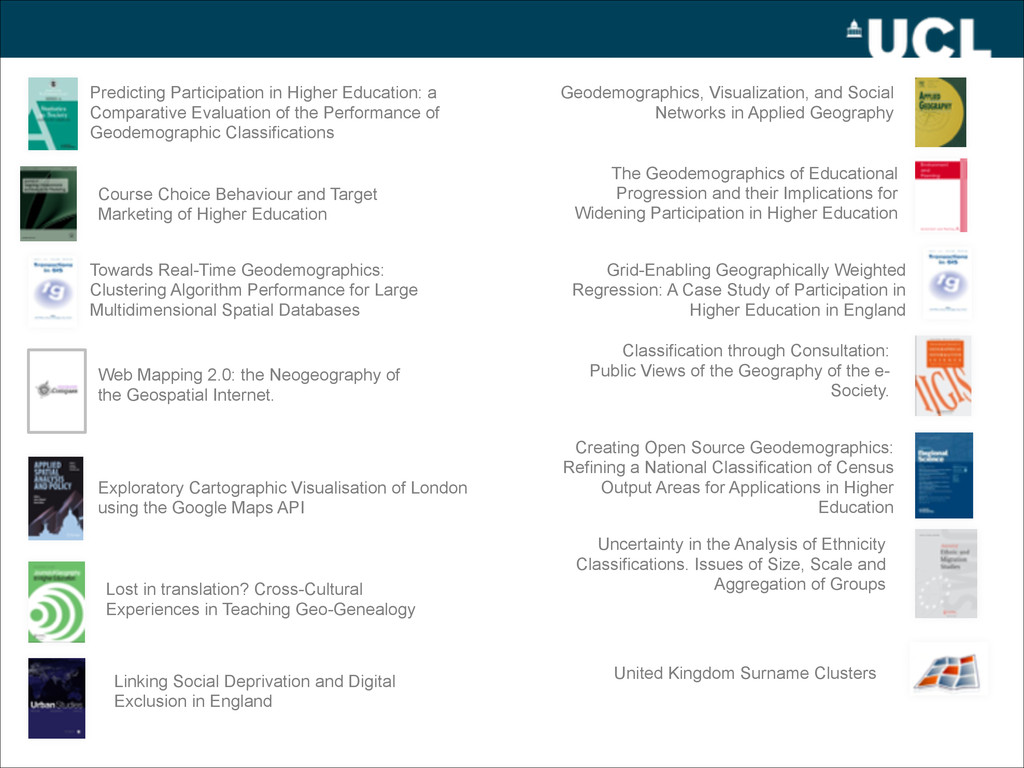
Performance of Geodemographic Classifications Towards Real-Time Geodemographics: Clustering Algorithm Performance for Large Multidimensional Spatial Databases Grid-Enabling Geographically Weighted Regression: A Case Study of Participation in Higher Education in England Course Choice Behaviour and Target Marketing of Higher Education Creating Open Source Geodemographics: Refining a National Classification of Census Output Areas for Applications in Higher Education Geodemographics, Visualization, and Social Networks in Applied Geography Classification through Consultation: Public Views of the Geography of the e- Society. Web Mapping 2.0: the Neogeography of the Geospatial Internet. Exploratory Cartographic Visualisation of London using the Google Maps API Lost in translation? Cross-Cultural Experiences in Teaching Geo-Genealogy Uncertainty in the Analysis of Ethnicity Classifications. Issues of Size, Scale and Aggregation of Groups The Geodemographics of Educational Progression and their Implications for Widening Participation in Higher Education Linking Social Deprivation and Digital Exclusion in England United Kingdom Surname Clusters
Performance of Geodemographic Classifications Towards Real-Time Geodemographics: Clustering Algorithm Performance for Large Multidimensional Spatial Databases Grid-Enabling Geographically Weighted Regression: A Case Study of Participation in Higher Education in England Course Choice Behaviour and Target Marketing of Higher Education Creating Open Source Geodemographics: Refining a National Classification of Census Output Areas for Applications in Higher Education Geodemographics, Visualization, and Social Networks in Applied Geography Classification through Consultation: Public Views of the Geography of the e- Society. Web Mapping 2.0: the Neogeography of the Geospatial Internet. Exploratory Cartographic Visualisation of London using the Google Maps API Lost in translation? Cross-Cultural Experiences in Teaching Geo-Genealogy Uncertainty in the Analysis of Ethnicity Classifications. Issues of Size, Scale and Aggregation of Groups The Geodemographics of Educational Progression and their Implications for Widening Participation in Higher Education Linking Social Deprivation and Digital Exclusion in England United Kingdom Surname Clusters
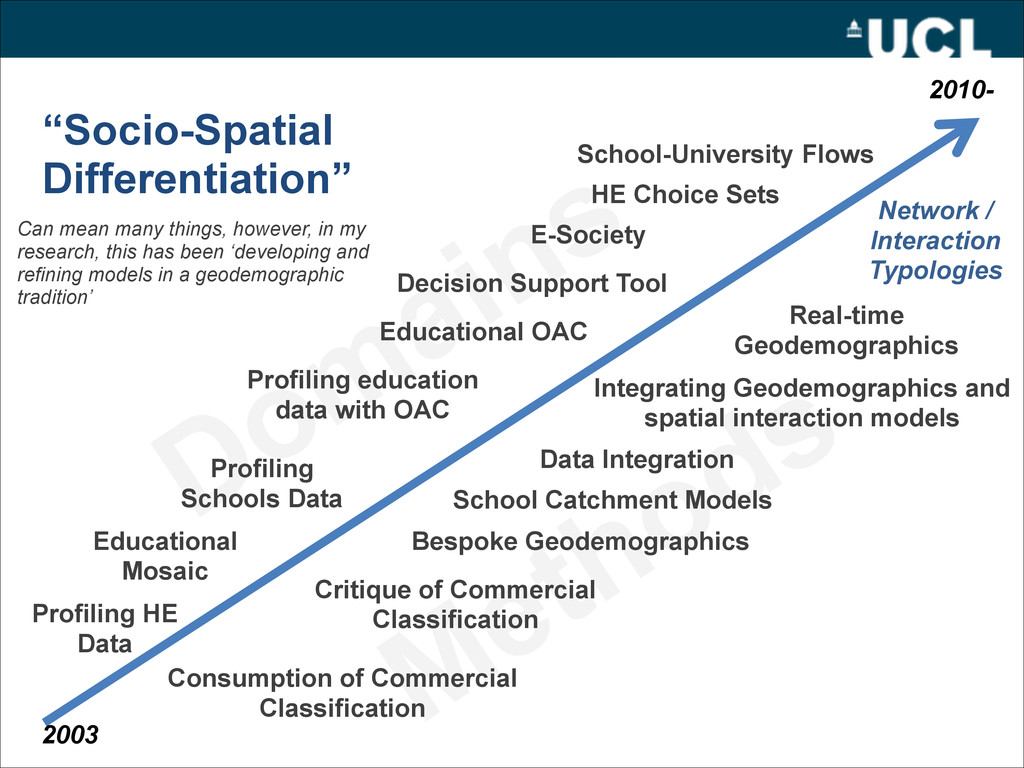
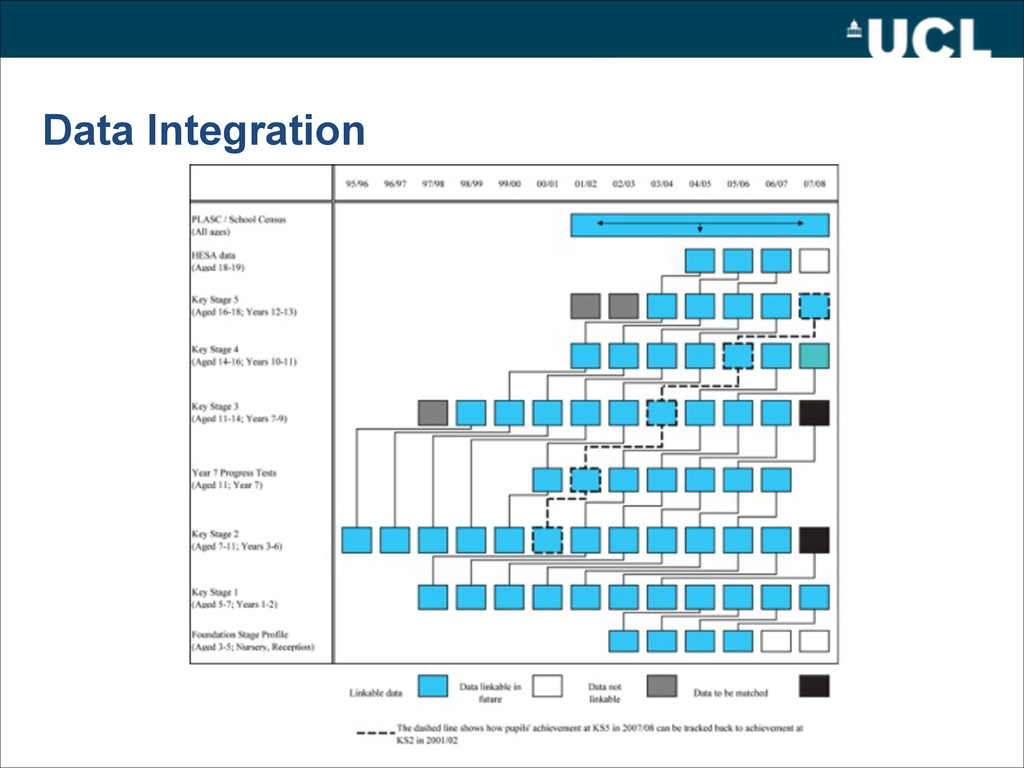
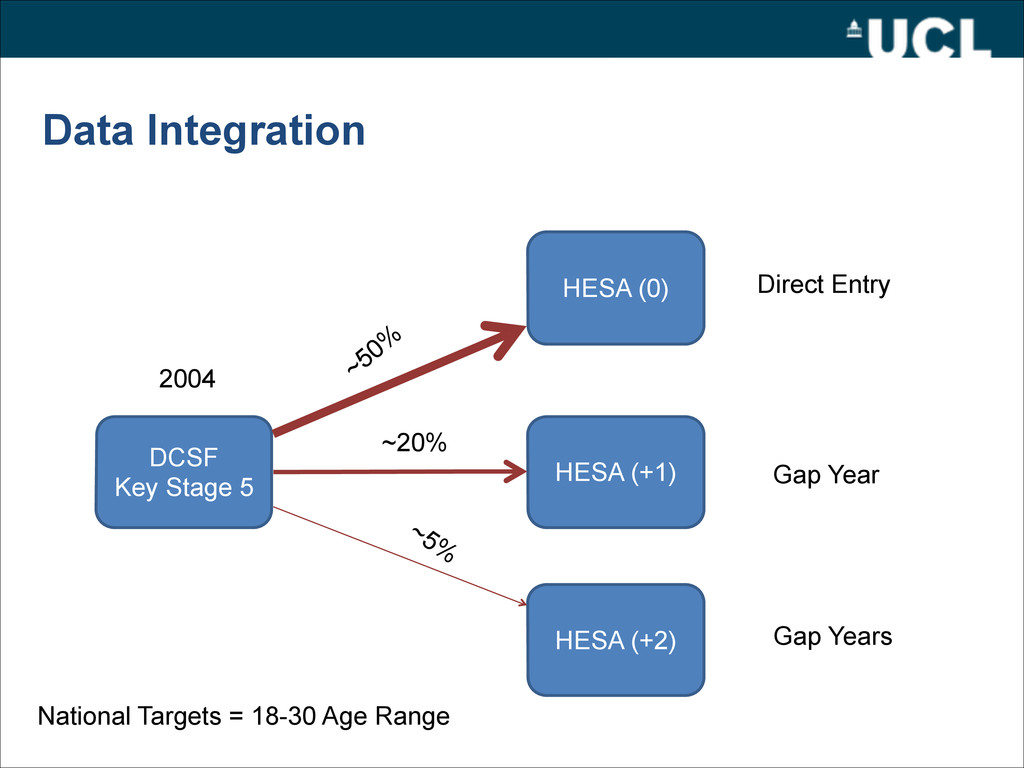
my research, this has been ‘developing and refining models in a geodemographic tradition’ Methods Consumption of Commercial Classification Critique of Commercial Classification Bespoke Geodemographics Real-time Geodemographics Network / Interaction Typologies Integrating Geodemographics and spatial interaction models Profiling HE Data Profiling Schools Data Educational Mosaic Profiling education data with OAC Decision Support Tool Data Integration Educational OAC E-Society HE Choice Sets School-University Flows School Catchment Models 2003 2010-
casual. Chronic want. LIGHT BLUE: Poor. 18s. to 21s. a week for a moderate family PURPLE: Mixed. Some comfortable others poor PINK: Fairly comfortable. Good ordinary earnings. RED: Middle class. Well-to-do. YELLOW: Upper-middle and Upper classes. Wealthy. Walk with Police Constable Robert Turner, 12 July 1898 Charles Booth Maps – 1889-1892
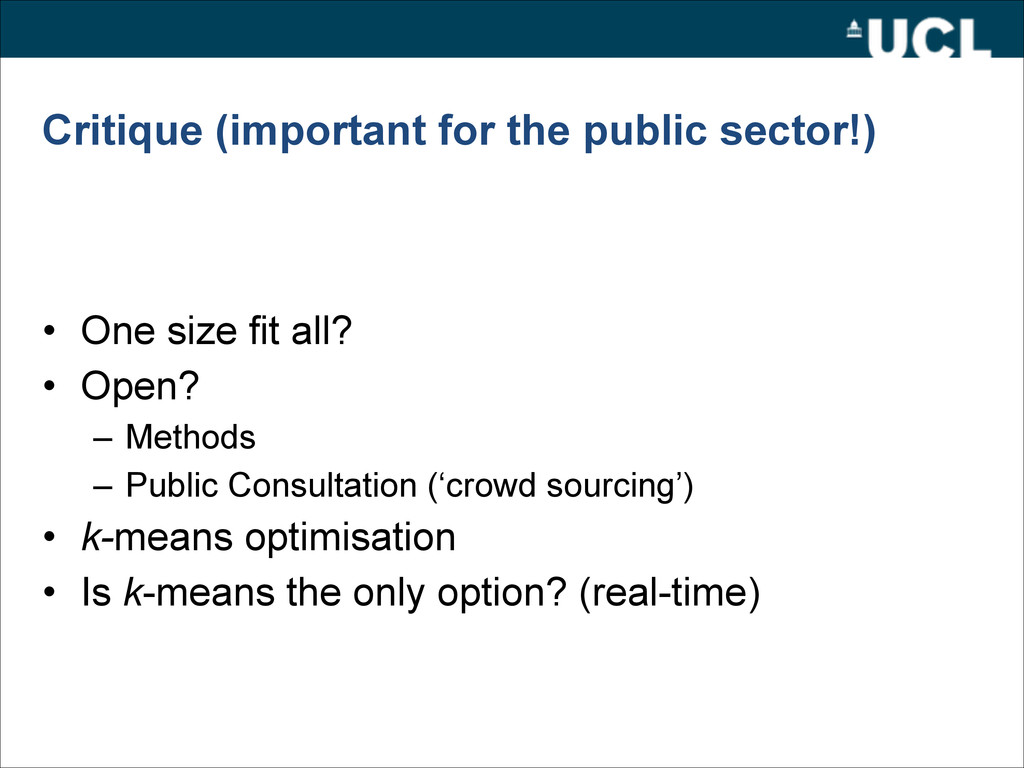
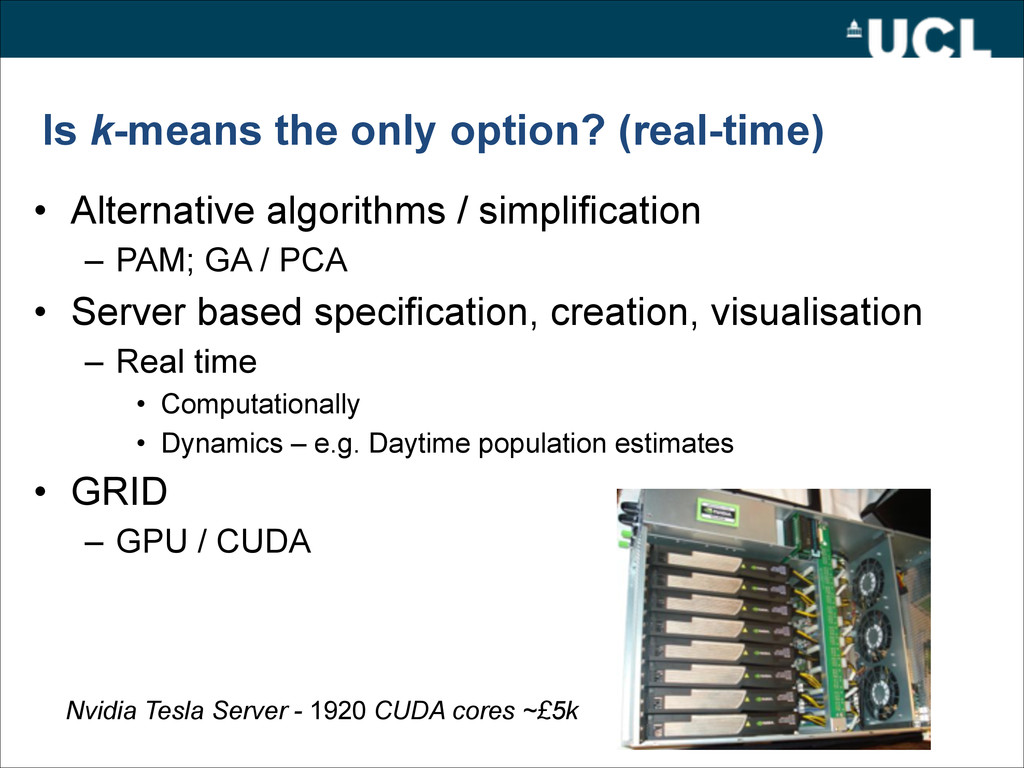
simplification – PAM; GA / PCA • Server based specification, creation, visualisation – Real time • Computationally • Dynamics – e.g. Daytime population estimates • GRID – GPU / CUDA Nvidia Tesla Server - 1920 CUDA cores ~£5k
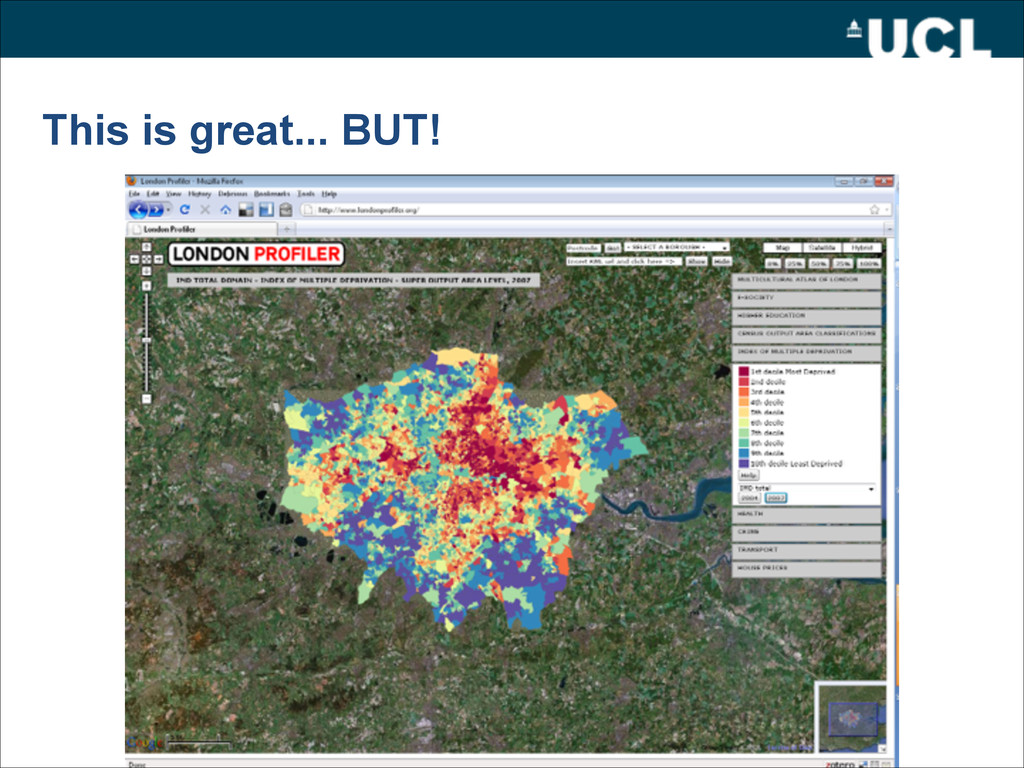
margins – Position paper (with Muki, Chris Parker – OS) – Encyclopaedia entry (Barney Warf) – Couple of magazine articles • My view – The technology to make great maps exists – Next challenge is to link this with better analytical functionality • Utilise real-time data feeds • Generalisations on the fly • Make predictions
England & Wales (HEFCE) • 2008 – 396,630 Degree Acceptances UK (UCAS) • 50% Participation by 2010 - ~43% (07-08) • Fees – Top Up – Office of Fair Access – Access Agreements • Monitoring – WP Benchmarks • HECE allocated £141 million directly to institutions for widening participation in 2009-10
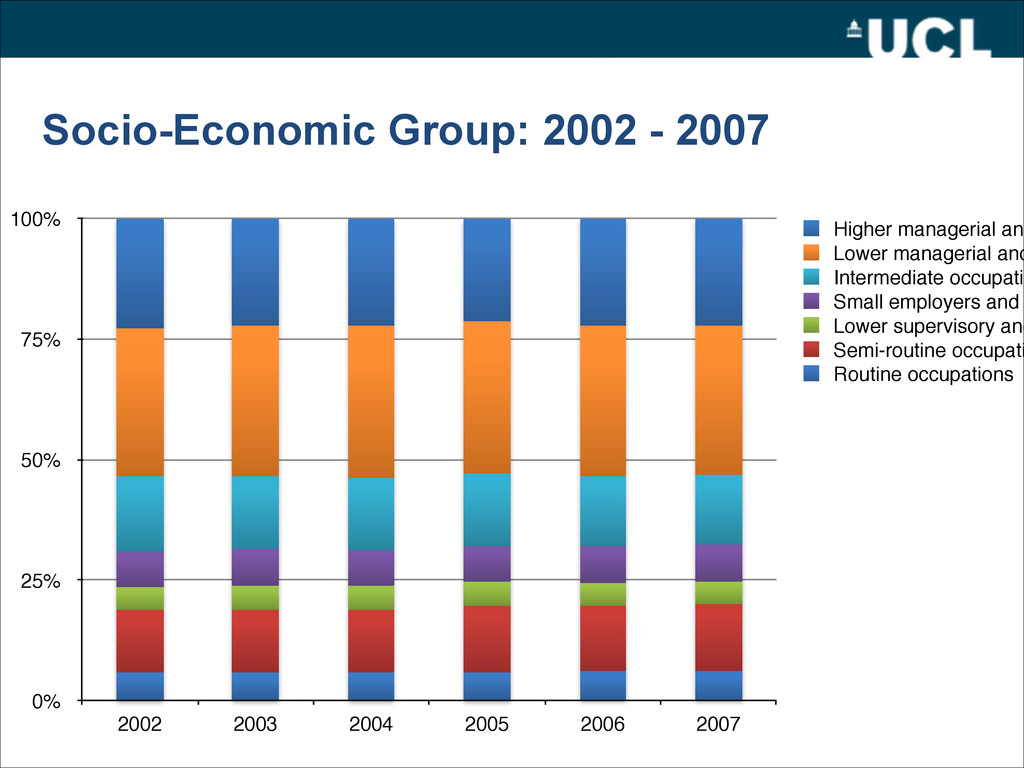
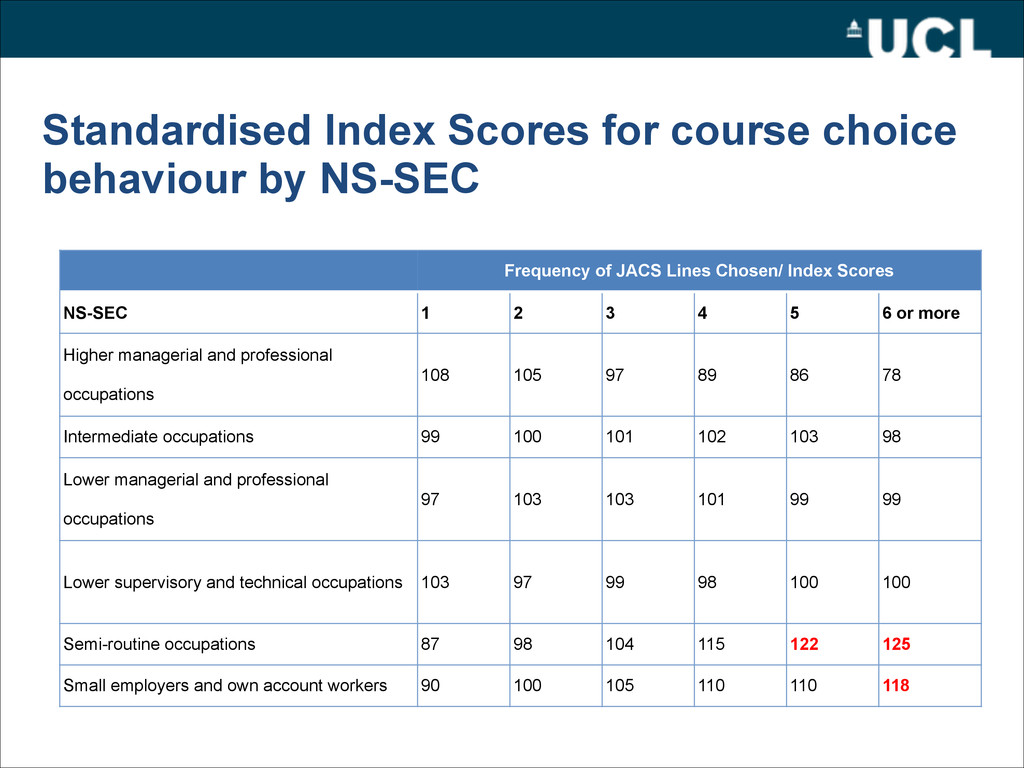
2002 2003 2004 2005 2006 2007 Routine occupations Semi-routine occupati Lower supervisory and Small employers and Intermediate occupatio Lower managerial and Higher managerial and
250 300 0 0 0 0 0 0 0 Global Connections Cultural Leadership Corporate Chieftains Golden Empty Nesters Provincial Privilege High Technologists Semi-Rural Seclusion Just Moving In Fledgling Nurseries Upscale New Owners Families Making Good Middle Rung Families Burdened Optimists In Military Quarters Close to Retirement Conservative Values Small Time Business Sprawling Subtopia Original Suburbs Asian Enterprise Respectable Rows Affluent Blue Collar Industrial Grit Coronation Street Town Centre Refuge South Asian Industry Settled Minorities Counter Cultural Mix City Adventurers New Urban Colonists Caring Professionals Dinky Developments Town Gown Transition University Challenge Bedsit Beneficiaries Metro Multiculture Upper Floor Families Tower Block Living Dignified Dependency Sharing a Staircase Families on Benefits Low Horizons Ex-industrial Legacy Rustbelt Resilience Older Right to Buy White Van Culture New Town Materialism Old People in Flats Low Income Elderly Cared for Pensioners Sepia Memories Childfree Serenity High Spending Elders Bungalow Retirement Small Town Seniors Tourist Attendants Summer Playgrounds Greenbelt Guardians Parochial Villagers Pastoral Symphony Upland Hill Farmers Mosaic Type / Group Symbols of Success Happy Families Suburban Comfort Ties of Community Urban Intelligence Welfare Borderline Municipal Dependency Blue Collar Enterprise Tw ilight Subsistence Grey Perspectives Rural Isolation Who goes to university? Symbols of Success Urban Intelligence - Higher Age Profile Welfare Borderline Municipal Dependency Twilight Subsistence Blue Collar Enterprise Metro Multiculture Key Widening Participation Groups
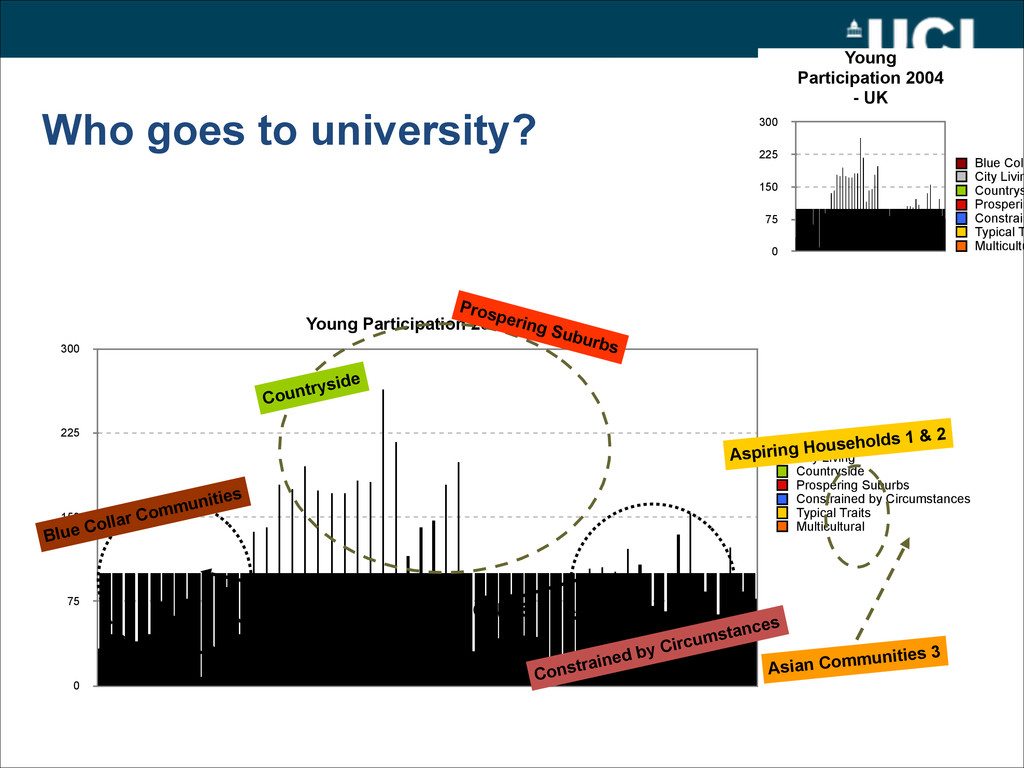
75 150 225 300 Blue Collar Communities City Living Countryside Prospering Suburbs Constrained by Circumstances Typical Traits Multicultural Young Participation 2004 - UK 0 75 150 225 300 Blue Coll City Livin Countrys Prosperin Constrain Typical T Multicultu Prospering Suburbs Countryside Aspiring Households 1 & 2 Asian Communities 3 Key WP Groups Blue Collar Communities Constrained by Circumstances
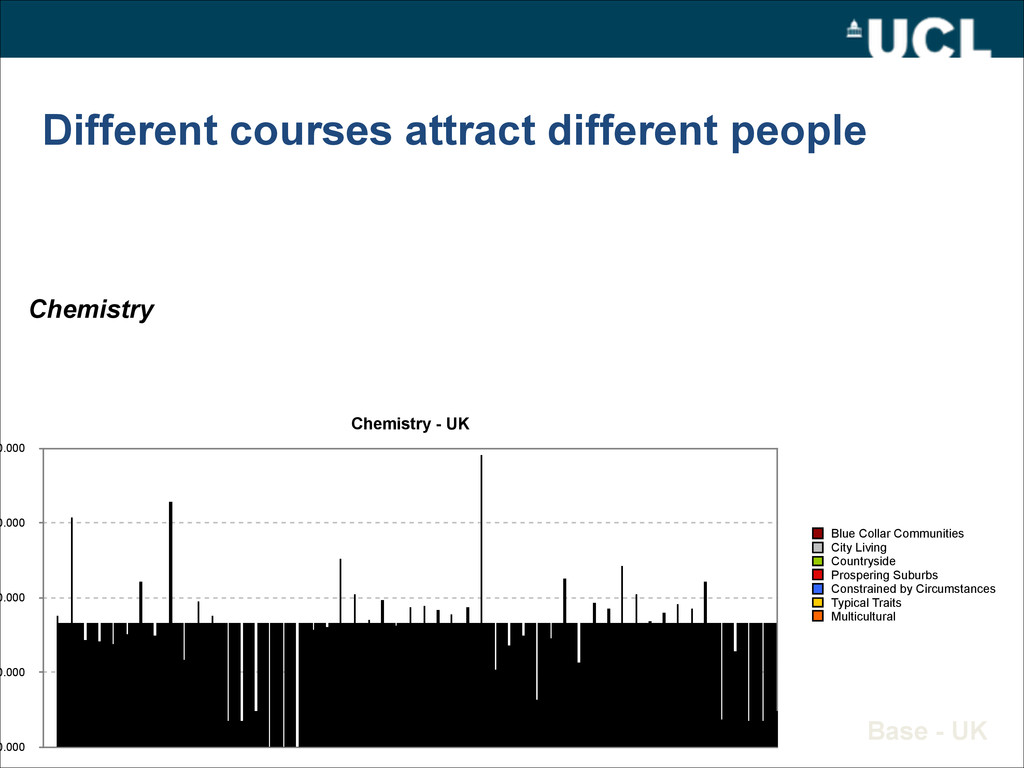
0.000 0.000 0.000 Blue Collar Communities City Living Countryside Prospering Suburbs Constrained by Circumstances Typical Traits Multicultural Base - UK Chemistry
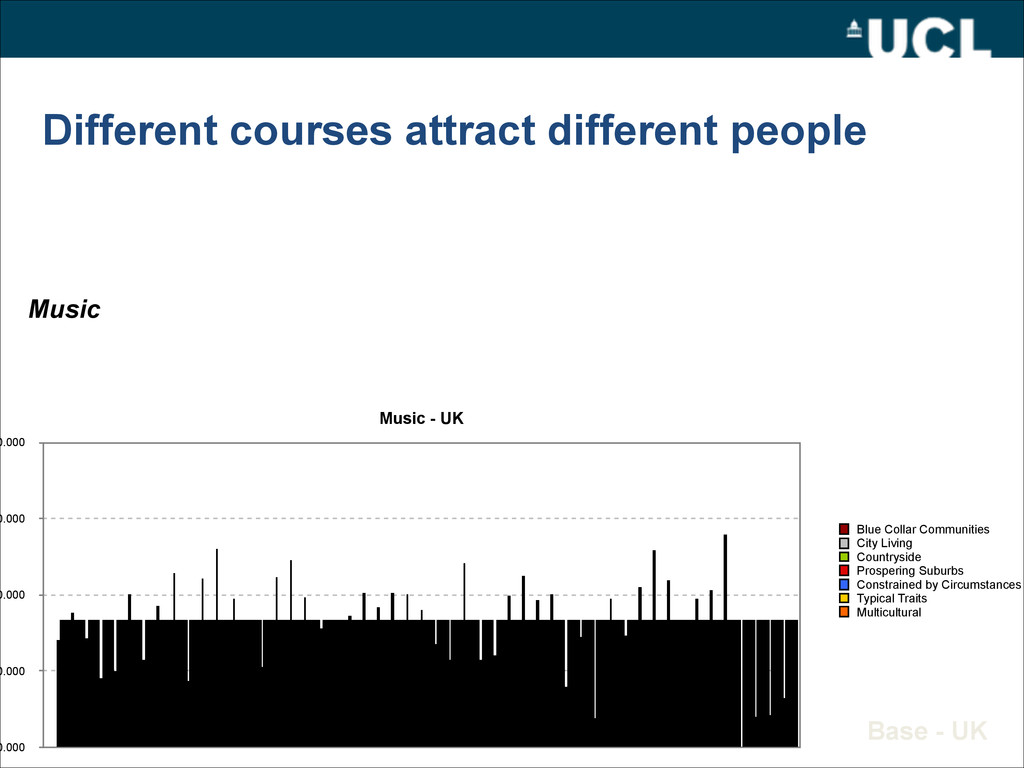
0.000 0.000 0.000 Blue Collar Communities City Living Countryside Prospering Suburbs Constrained by Circumstances Typical Traits Multicultural Base - UK Music
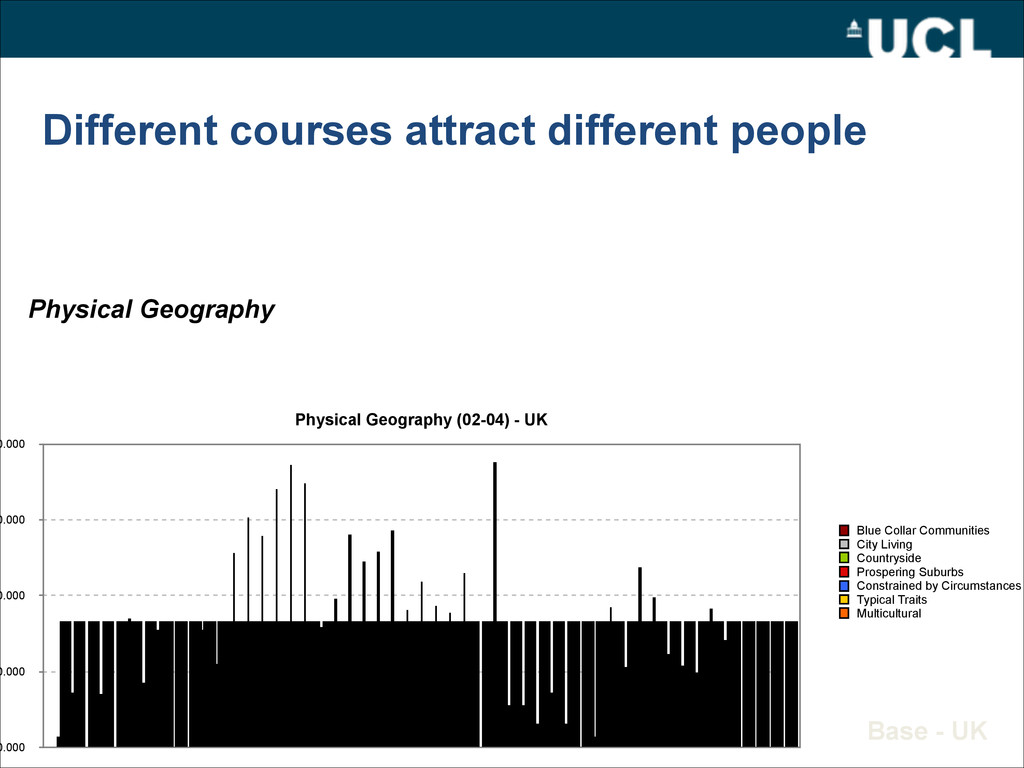
0.000 0.000 0.000 0.000 0.000 Blue Collar Communities City Living Countryside Prospering Suburbs Constrained by Circumstances Typical Traits Multicultural Base - UK Physical Geography
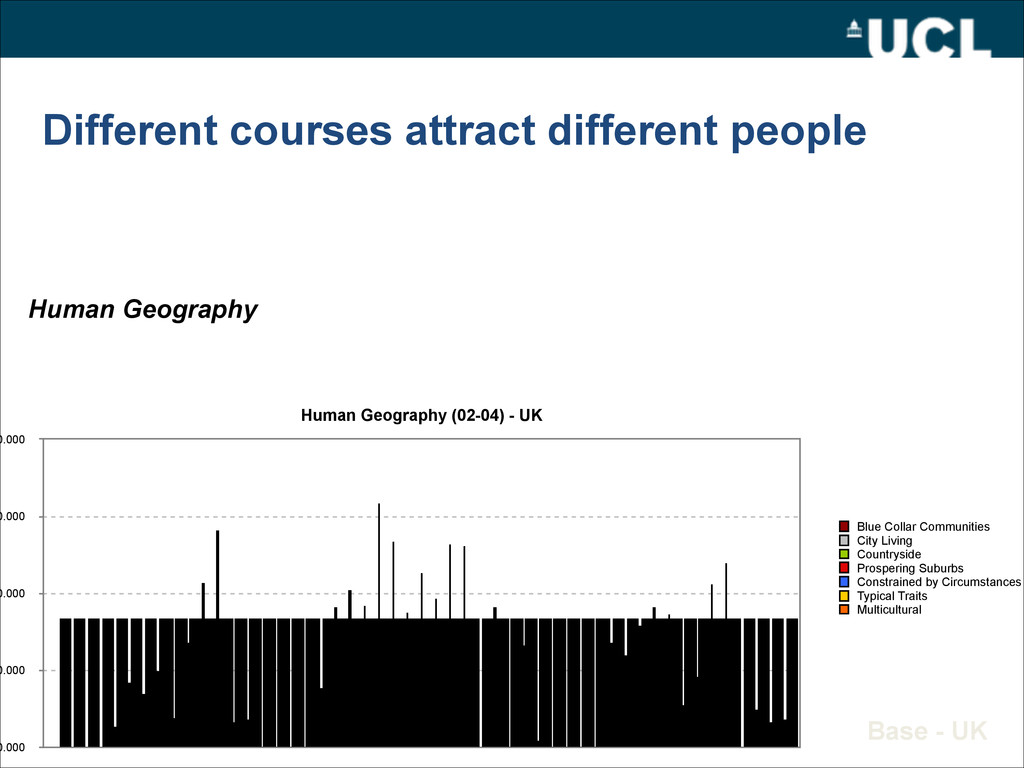
0.000 0.000 0.000 0.000 0.000 Blue Collar Communities City Living Countryside Prospering Suburbs Constrained by Circumstances Typical Traits Multicultural Base - UK Human Geography
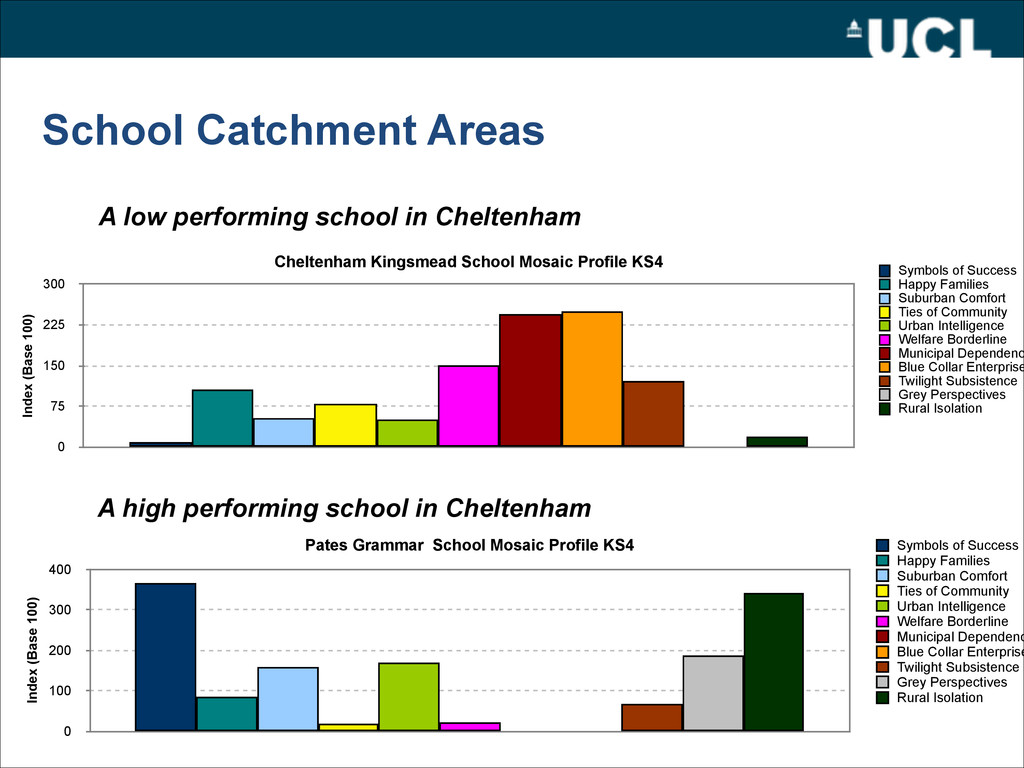
(Base 100) 0 75 150 225 300 Symbols of Success Happy Families Suburban Comfort Ties of Community Urban Intelligence Welfare Borderline Municipal Dependenc Blue Collar Enterprise Twilight Subsistence Grey Perspectives Rural Isolation Pates Grammar School Mosaic Profile KS4 Index (Base 100) 0 100 200 300 400 Symbols of Success Happy Families Suburban Comfort Ties of Community Urban Intelligence Welfare Borderline Municipal Dependenc Blue Collar Enterprise Twilight Subsistence Grey Perspectives Rural Isolation A high performing school in Cheltenham A low performing school in Cheltenham
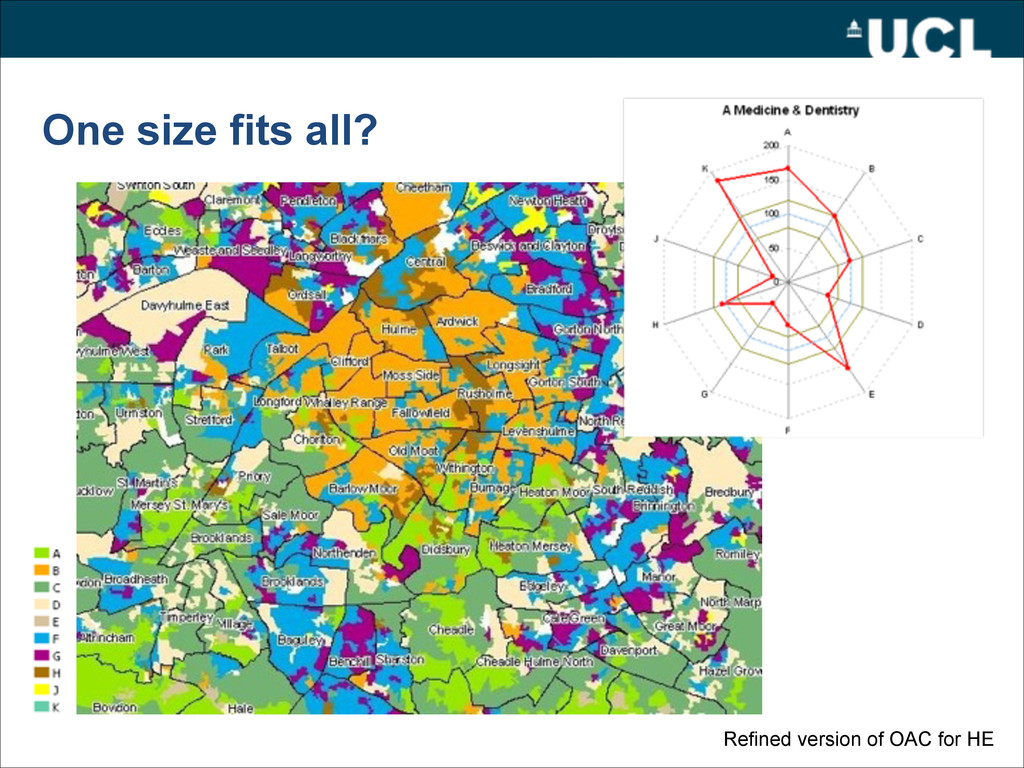
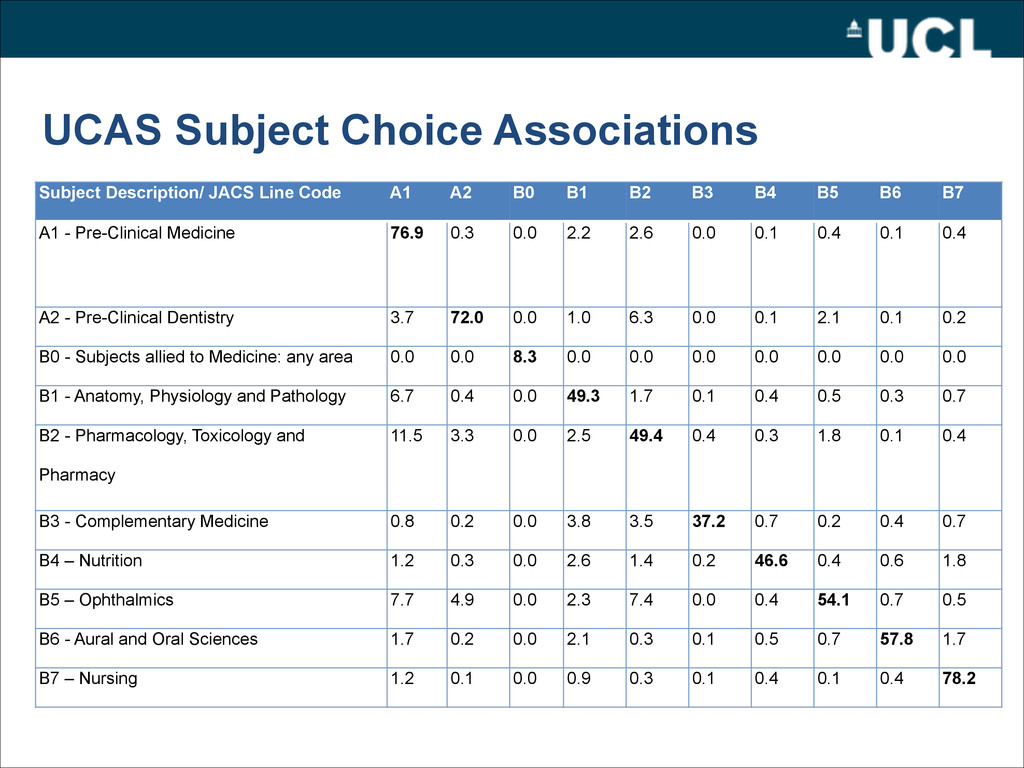
– A1 - Pre-clinical Medicine – A2 - Pre-clinical Dentistry – M1 - Law by Area – D1 - Pre-clinical Veterinary Medicine – K1 - Architecture – V1 - History by Period – Q8 - Classical studies – B8 - Medical Technology – B6 - Aural and Oral Sciences
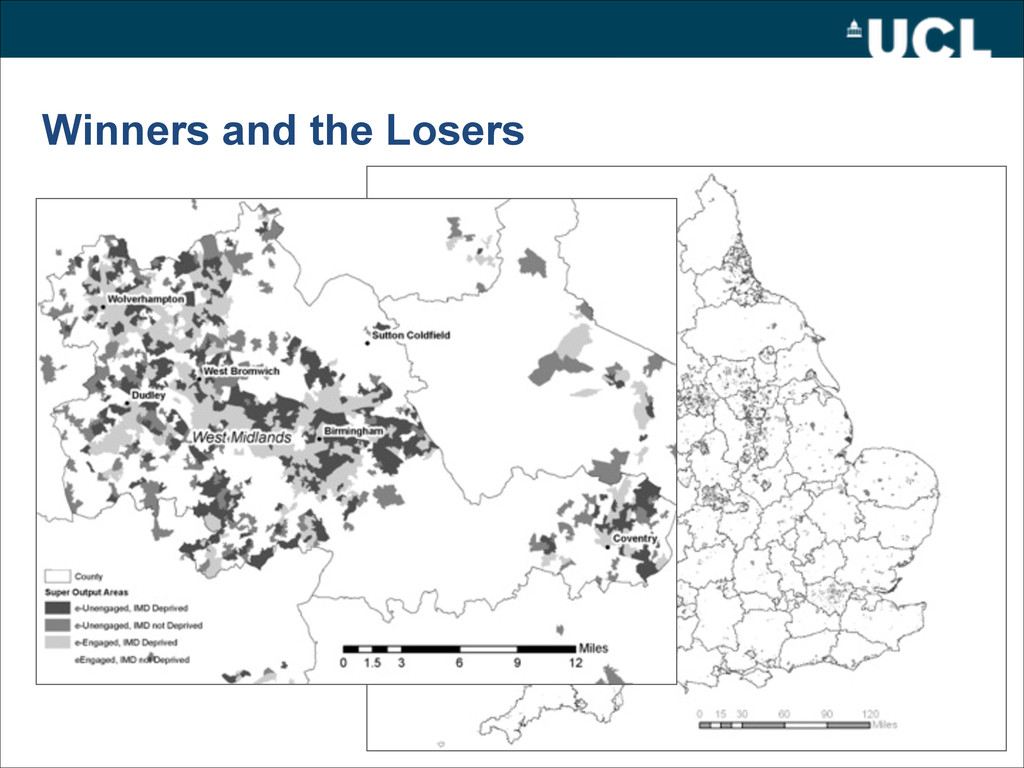
data into classification • Geographic – Spatial weighting • Network Typologies – Social Flows / Interaction • Neogeography and Digital Exclusion – Updated small area estimates of digital differentiation – Socio-spatial implications of GPS routing • ‘Social Routing’ – Sociology of the OSM community • Implications for data quality (Spatial & Temporal) • Widening Access to Higher Education – Continual update to integrated data model – New HE & Schools Classifications – Decision Support Tools for WP / School Choice