Upgrade to Pro — share decks privately, control downloads, hide ads and more …

Spatial Analysis Using the National Pupil Database

Spatial Analysis Using the National Pupil Database

This is a talk I gave for the 2011 PLUG conference: http://www.bris.ac.uk/cmpo/events/2011/plug/index.html

alexsingleton

April 06, 2011
Tweet

More Decks by alexsingleton

Other Decks in Education

Transcript

  1. Dr Alex D Singleton Spatial Analysis using the School of

    Environmental Sciences Spatial Analysis using the National Pupil Database
  2. Content • Geographic referencing and the NPD • Indicators and

    Geodemographics • Catchment models • Mapping and the Geoweb • Mapping and the Geoweb
  3. Building Blocks • School locations – Derived from postcode +

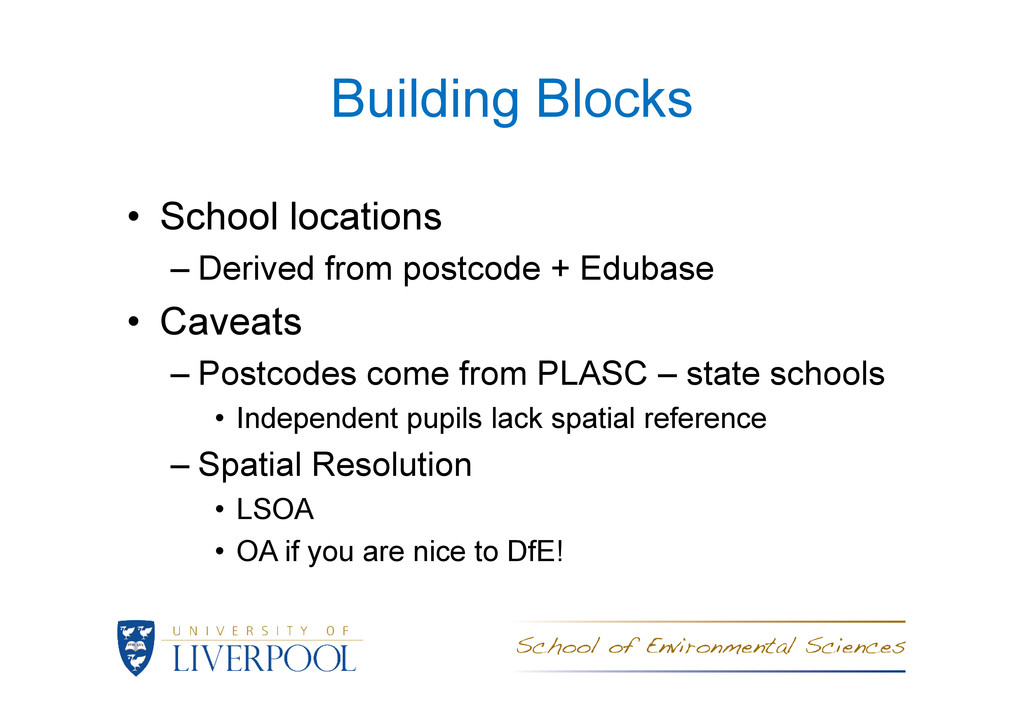
    Edubase • Caveats – Postcodes come from PLASC – state schools – Postcodes come from PLASC – state schools • Independent pupils lack spatial reference – Spatial Resolution • LSOA • OA if you are nice to DfE!
  4. Indicators and Geodemographics • Linked to NPD – Composite Measures:

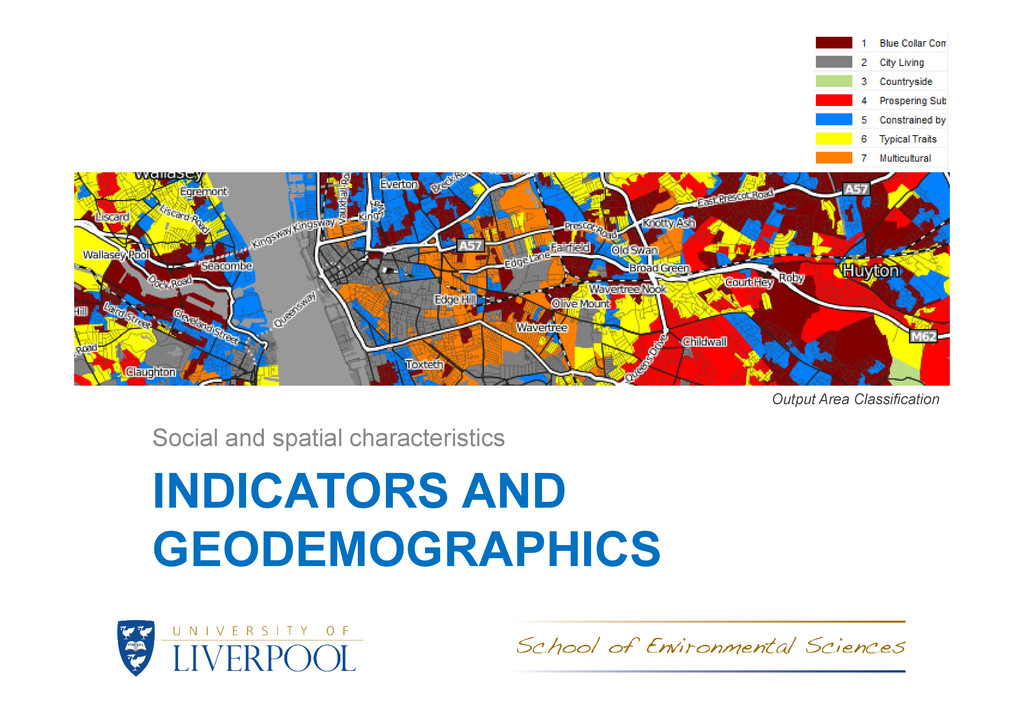
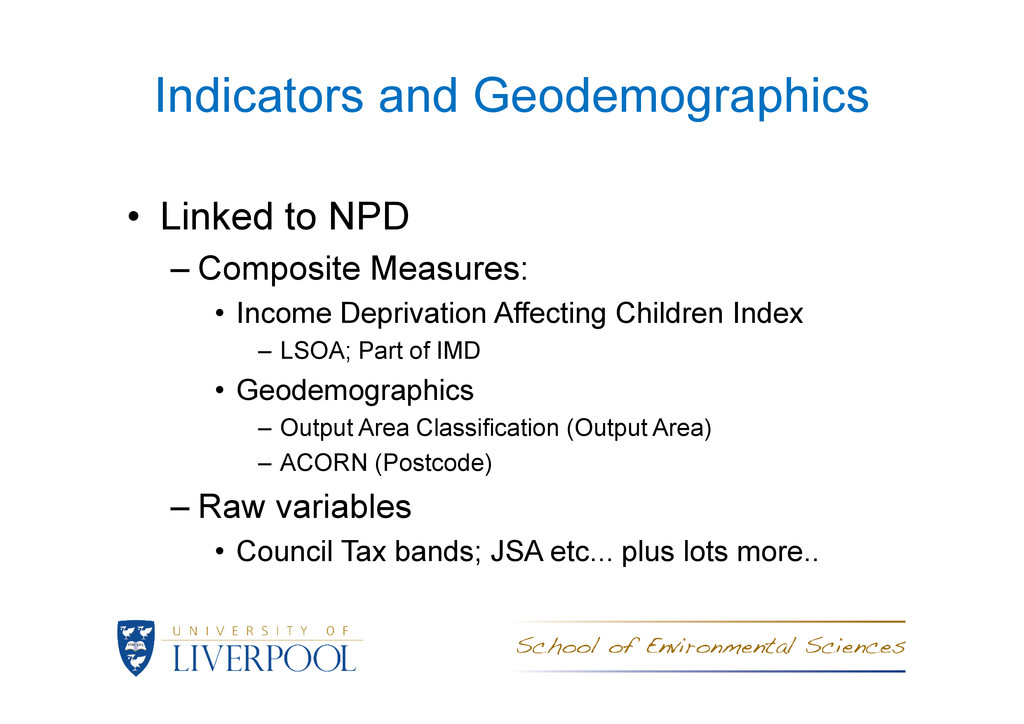
    • Income Deprivation Affecting Children Index – LSOA; Part of IMD – LSOA; Part of IMD • Geodemographics – Output Area Classification (Output Area) – ACORN (Postcode) – Raw variables • Council Tax bands; JSA etc... plus lots more..
  5. Example: GCSE Grade Profiles 2009 GCSE Grade A* 15 20

    25 30 % E Wealthy Achievers Hard Pressed 0 5 10 E Entries A*
  6. Data Link DCSF HESA (0) HESA (+1) ~20% Direct Entry

    Gap Year Key Stage 5 HESA (+1) HESA (+2) Gap Year Gap Years National Targets = 18-30 Age Range
  7. 40 50 60 70 80 HE Progression Rate with 95%

    Confidence Intervals (%) Wealthy Achievers Urban Prosperity Comfortably Off Moderate Means Hard Pressed Inner City Adversity Asian Communities Home owning Asian family areas 0 10 20 30 1 2 3 4 5 6 7 8 9 10 11 12 13 14 15 16 17 18 19 20 21 22 23 24 25 26 27 28 29 30 31 32 33 34 35 36 37 38 39 40 41 42 43 44 45 46 47 48 49 50 51 52 53 54 55 56 HE Progression Rate with 95% Confidence Intervals (%) Low income, singles, small rented flats Low income, singles, small rented flats Flows – KS4
  8. 1.0 2.0 3.0 4.0 5.0 6.0 1A:Wealthy Executives 1B:Affluent Greys

    1C:Flourishing Families 2A:Prosperous Professionals 2B:Educated Urbanites 5A:Struggling Families 5B:Burdened Singles 5C:High-Rise Hardship 5D:Inner City Adversity Subject Profiles 0.0 2B:Educated Urbanites 2C:Aspiring Singles 3A:Starting Out 3B:Secure Families 3C:Settled Suburbia 3D:Prudent Pensioners 4A:Asian Communities 4B:Post-Industrial Families 4C:Blue-Collar Roots 5A:Struggling Families Medicine and Dentistry
  9. 2.0 4.0 6.0 8.0 10.0 12.0 14.0 1A:Wealthy Executives 1B:Affluent

    Greys 1C:Flourishing Families 2A:Prosperous Professionals 2B:Educated Urbanites 5A:Struggling Families 5B:Burdened Singles 5C:High-Rise Hardship 5D:Inner City Adversity Subject Profiles 0.0 2B:Educated Urbanites 2C:Aspiring Singles 3A:Starting Out 3B:Secure Families 3C:Settled Suburbia 3D:Prudent Pensioners 4A:Asian Communities 4B:Post-Industrial Families 4C:Blue-Collar Roots 5A:Struggling Families Mathematical and Computer Sciences
  10. OpenStreetMap Data great_britain.osm (.xml) PostgreSQL DB with PostGIS osm2pgsql NASA’s

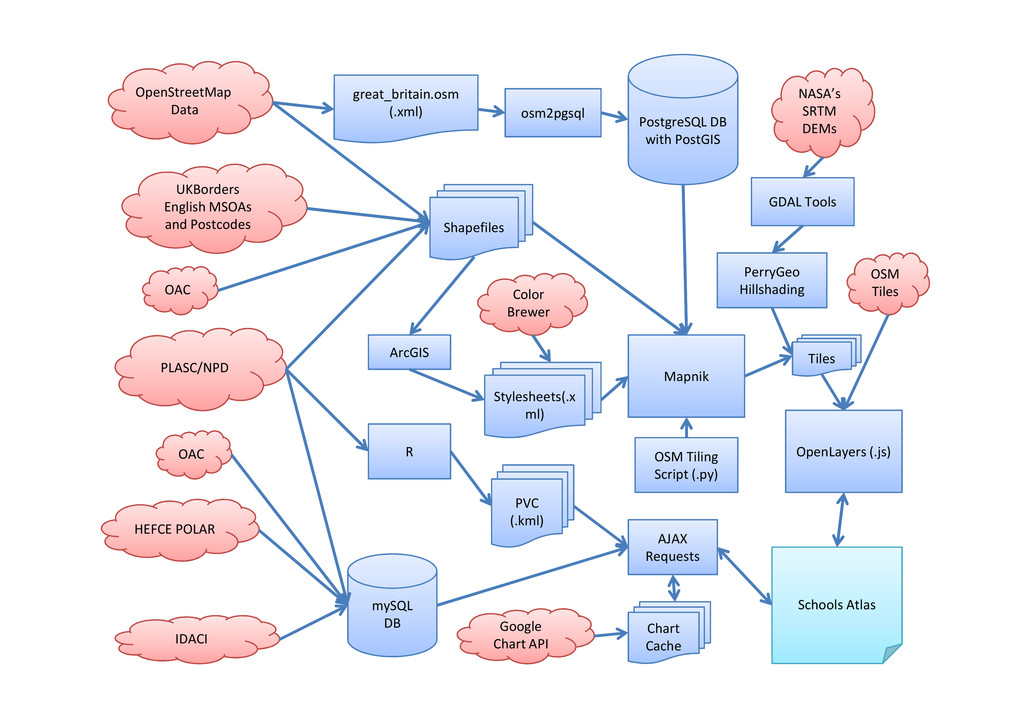
    SRTM DEMs GDAL Tools UKBorders English MSOAs and Postcodes PLASC/NPD OAC Shapefiles ArcGIS Color Brewer PerryGeo Hillshading OSM Tiles Tiles PLASC/NPD mySQL DB Schools Atlas IDACI OpenLayers (.js) HEFCE POLAR Mapnik OSM Tiling Script (.py) Stylesheets(.x ml) AJAX Requests PVC (.kml) OAC R Google Chart API Tiles Chart Cache