Introductory research talk given in the Department of Biology at Johns Hopkins, to high schoolers and high school teachers participating in the Molecular Biology and Genomics Research program.
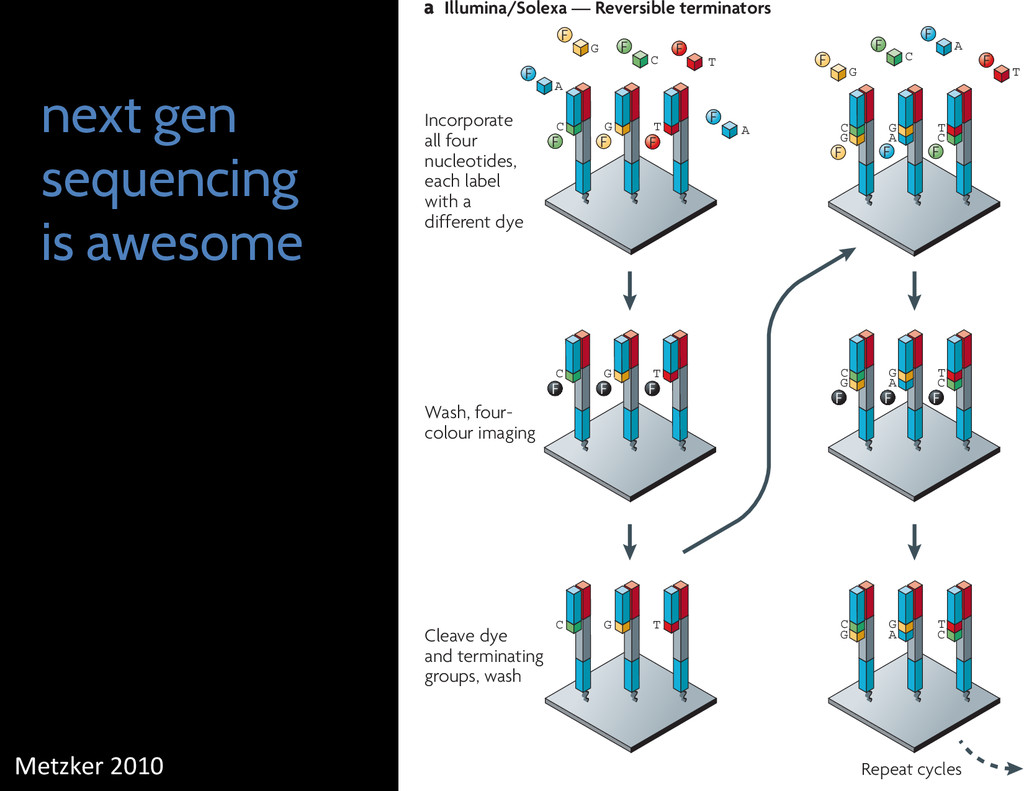
G C T A F a Illumina/Solexa — Reversible terminators Incorporate all four nucleotides, each label with a different dye Repeat cycles T G C T G C T G C G C A T G C G C A T G C G C A T G C F F F F F F F F F F F F F F F F F F F F Cleave dye and terminating groups, wash Wash, four- colour imaging Metzker 2010
wa C G A T b CATCGT Top: Bottom: CCCCCC Figure 2 | Four-colour and one-colour cyclic reve termination (CRT) method uses Illumina/Solexa’s 3 solid-phase-amplified template clusters (FIG. 1b, sh imaging, a cleavage step removes the fluorescent tris(2-carboxyethyl)phosphine (TCEP)23. b | The fou
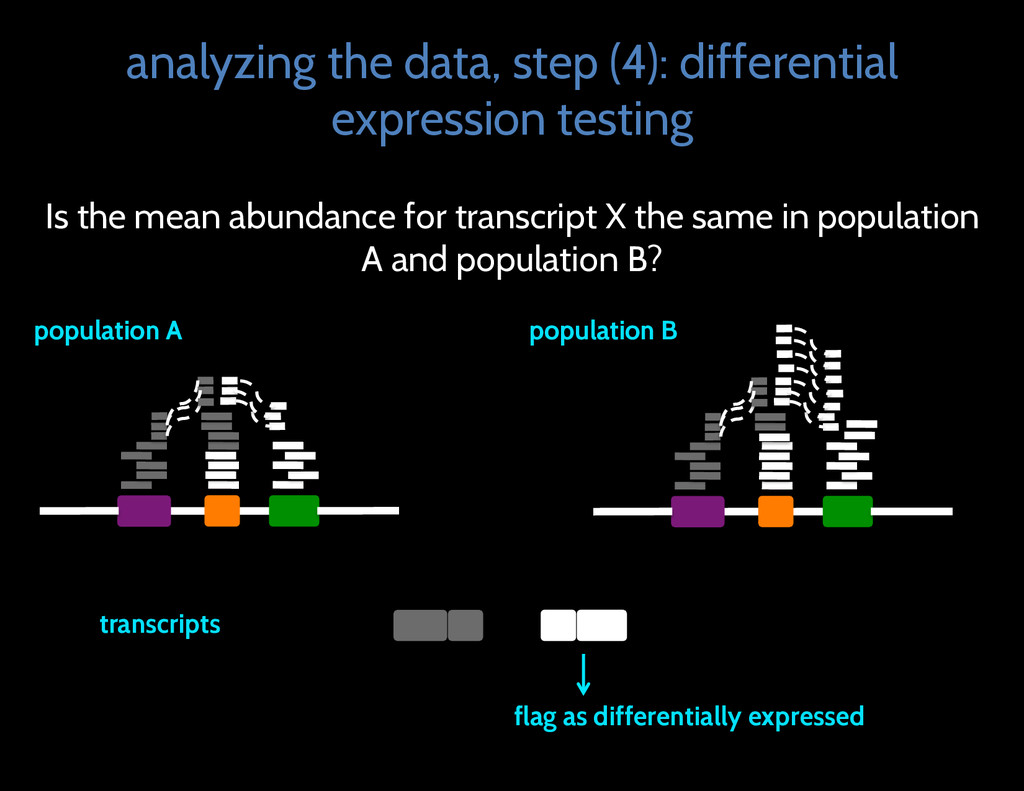
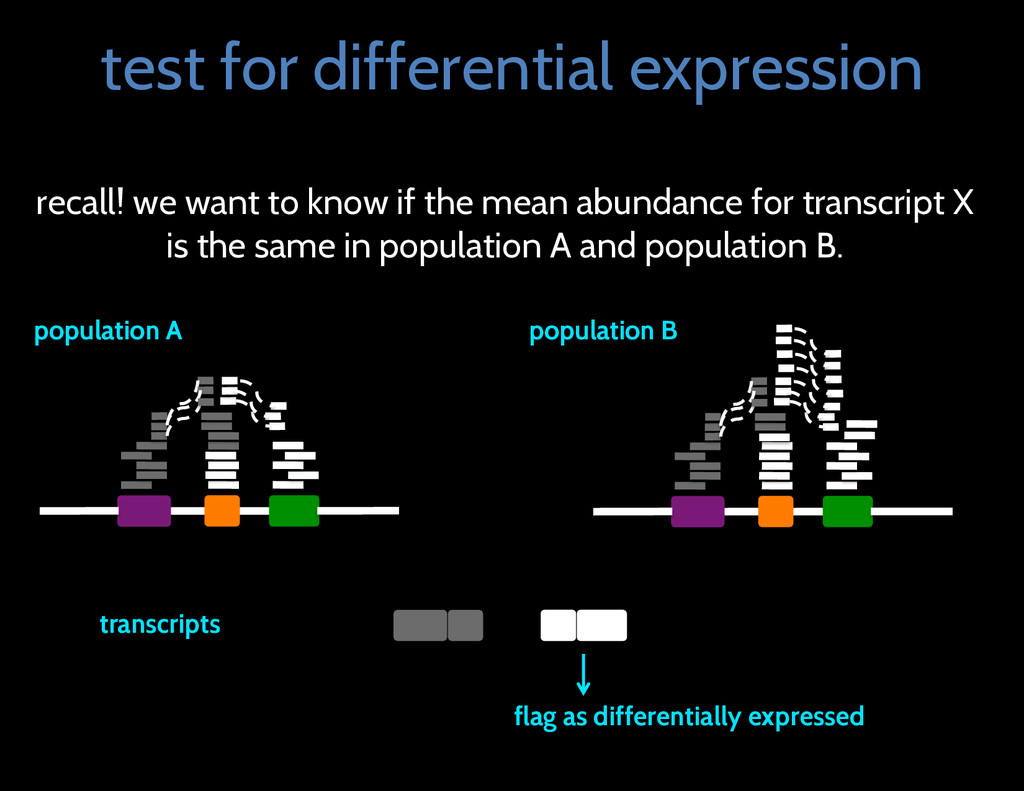
the mean abundance for transcript X is the same in population A and population B. transcripts flag as differentially expressed population A population B
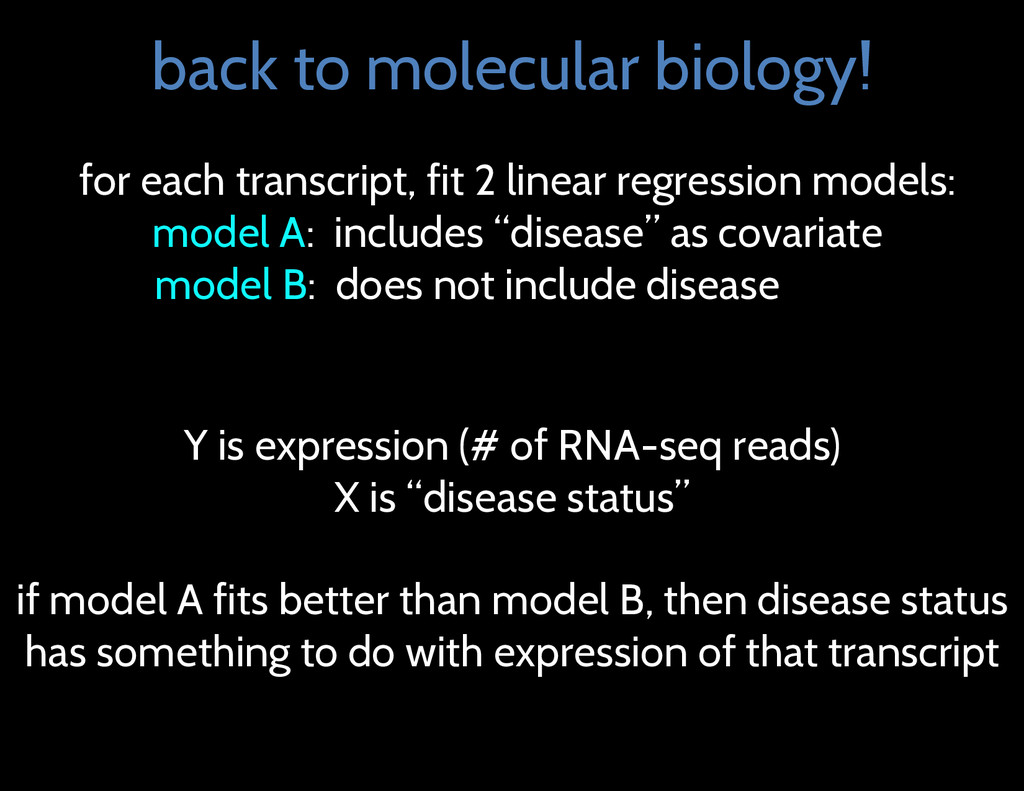
regression models: model A: includes “disease” as covariate model B: does not include disease aaa Y is expression (# of RNA-seq reads) X is “disease status” if model A fits better than model B, then disease status has something to do with expression of that transcript
website: alyssafrazee.com My collaborators: Jeff Leek (advisor), Geo Pertea, Steven Salzberg, Ben Langmead, Andrew Jaffe, and several others in the Center for Computational Biology and biostatistics department
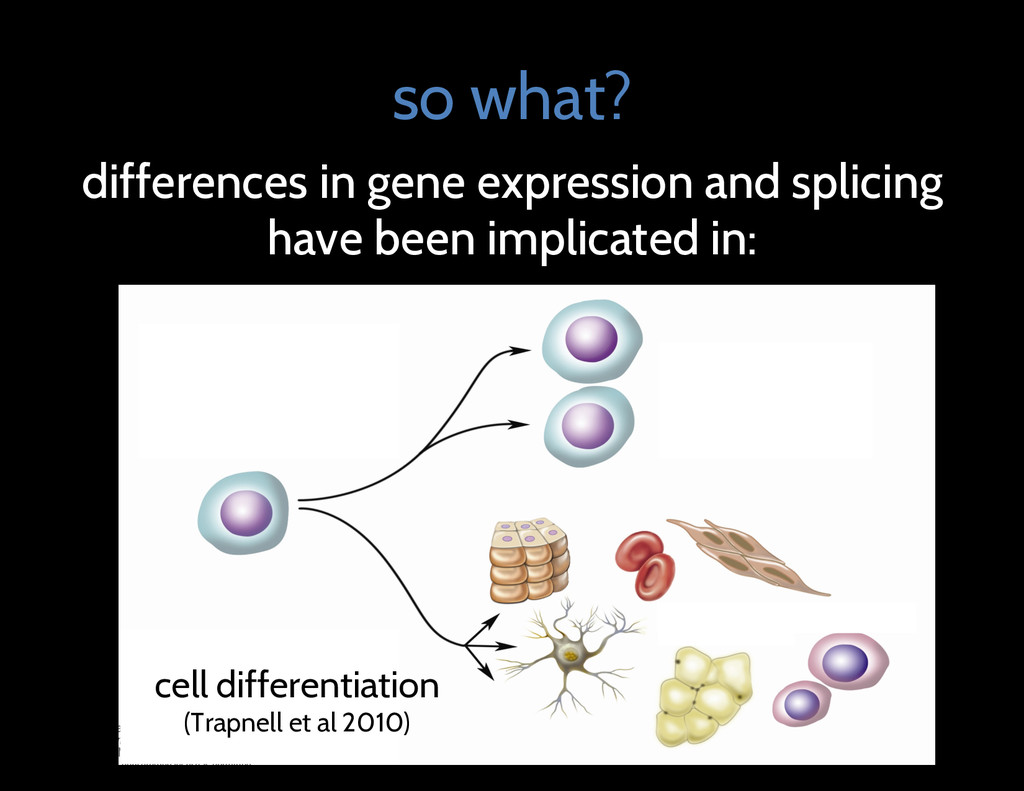
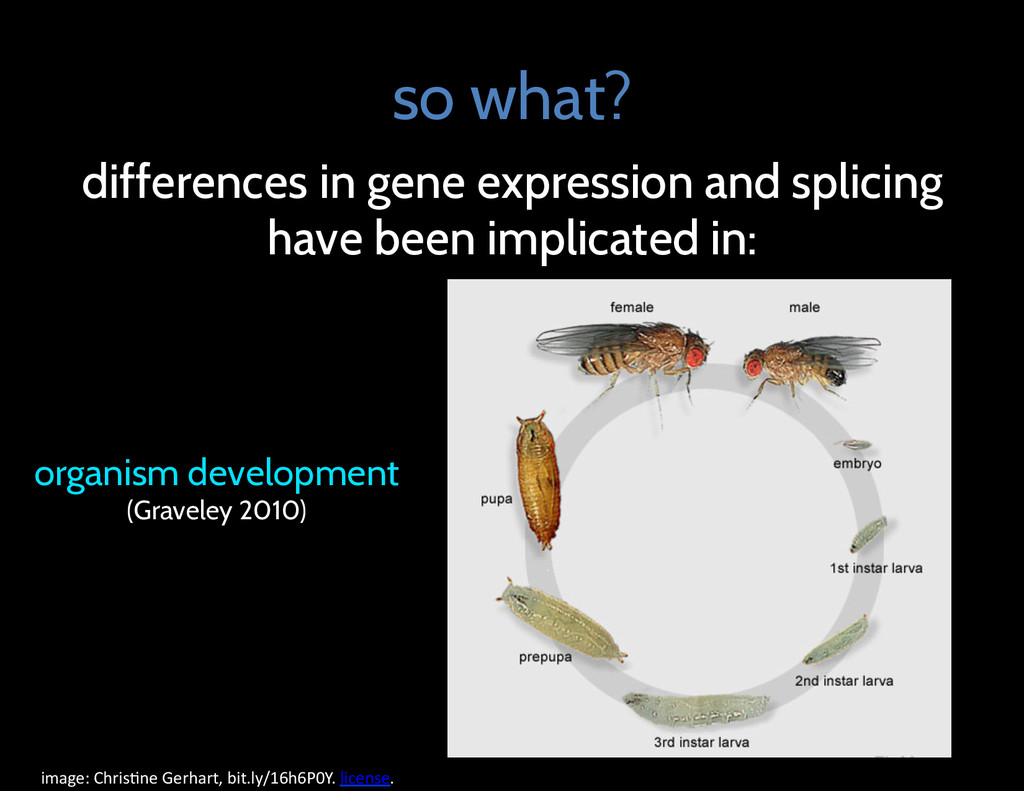
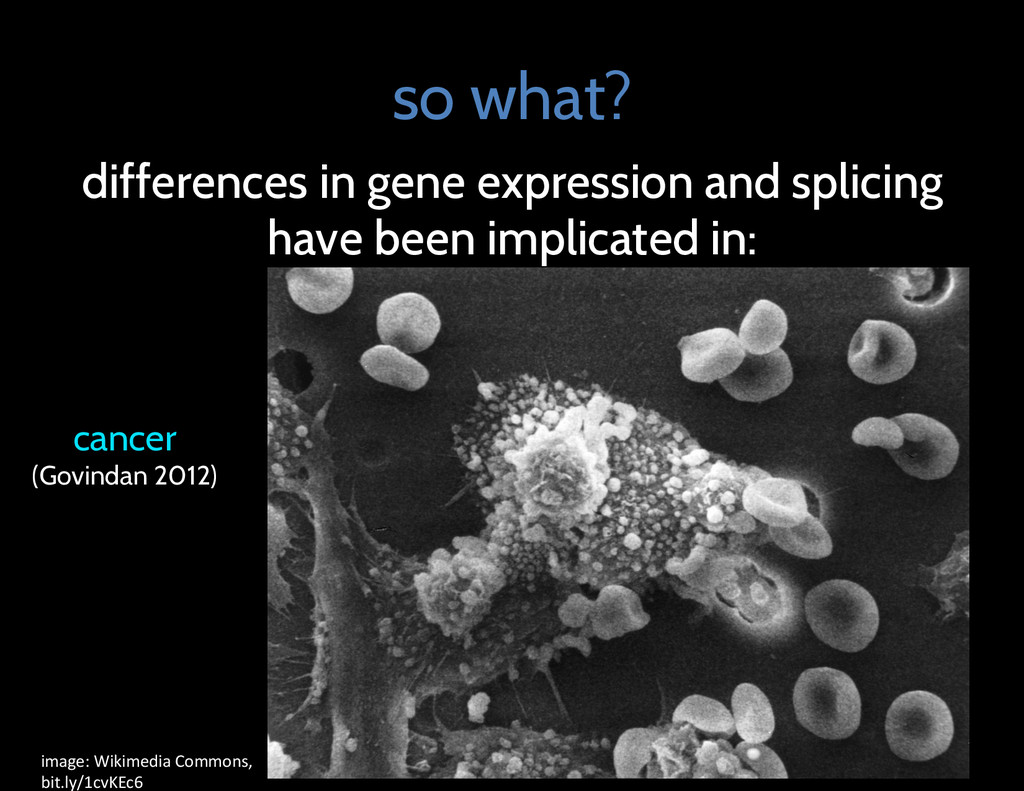
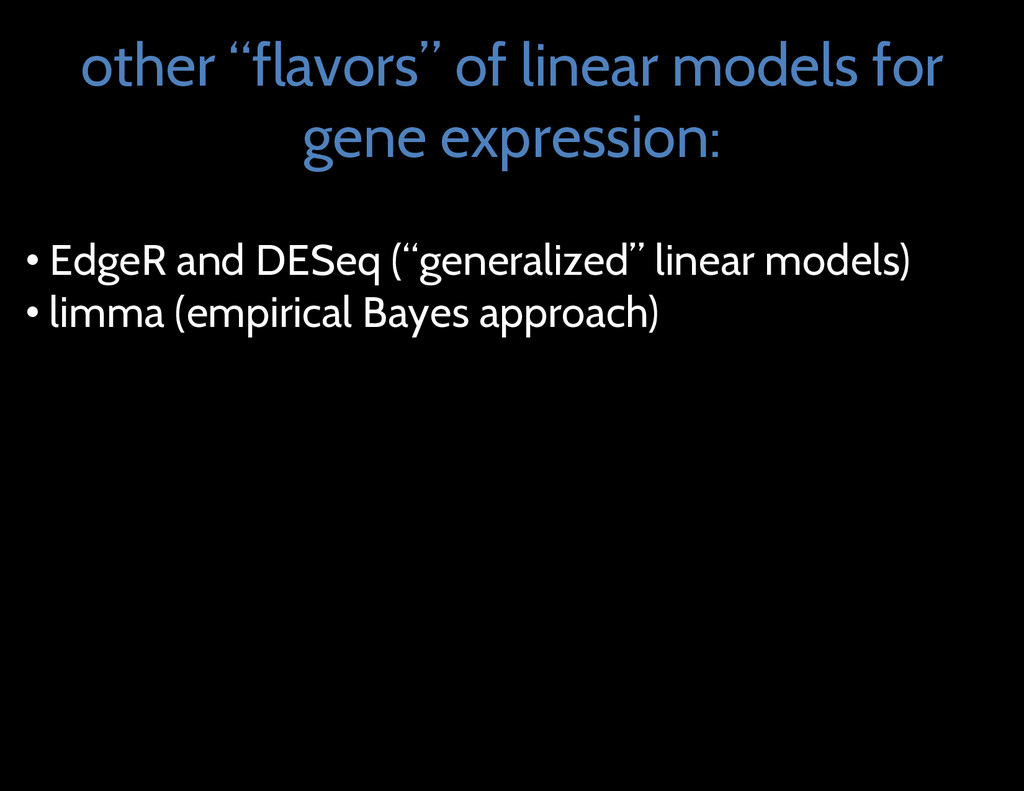
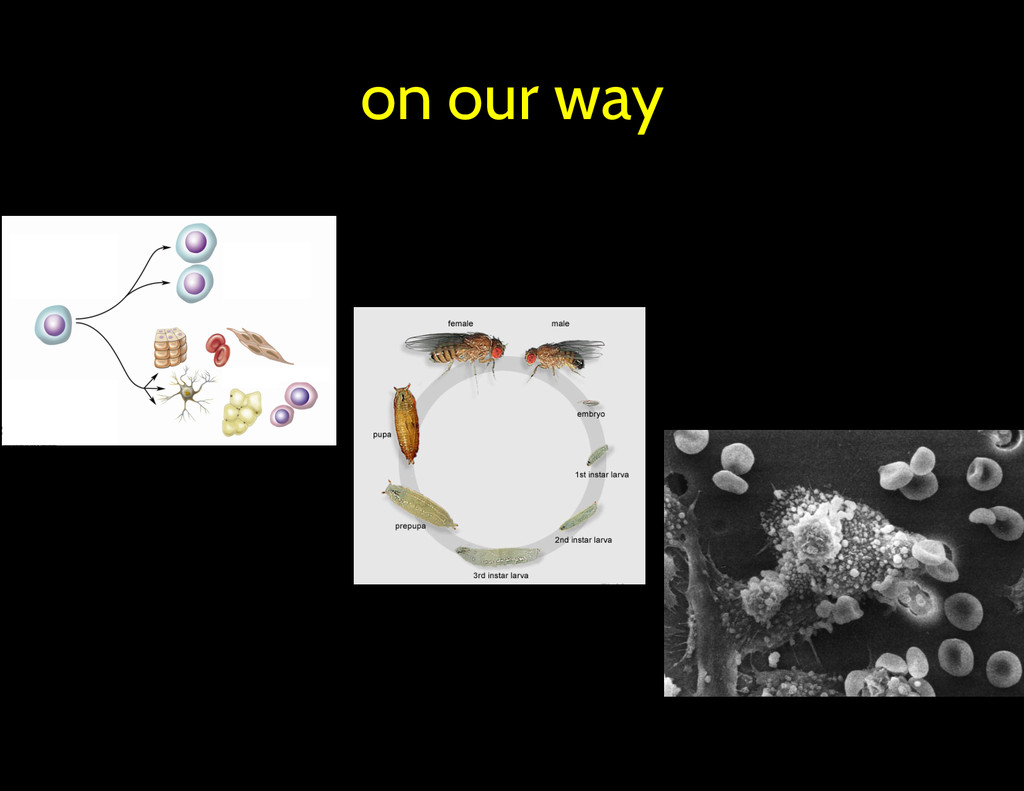
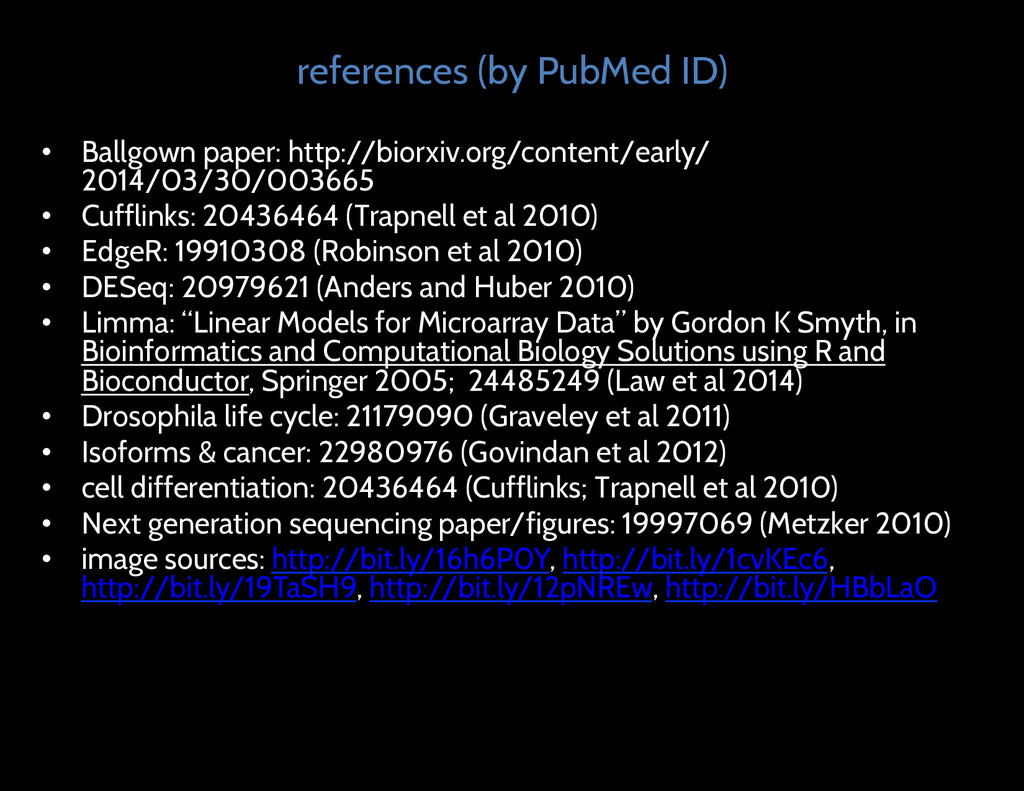
Cufflinks: 20436464 (Trapnell et al 2010) • EdgeR: 19910308 (Robinson et al 2010) • DESeq: 20979621 (Anders and Huber 2010) • Limma: “Linear Models for Microarray Data” by Gordon K Smyth, in Bioinformatics and Computational Biology Solutions using R and Bioconductor, Springer 2005; 24485249 (Law et al 2014) • Drosophila life cycle: 21179090 (Graveley et al 2011) • Isoforms & cancer: 22980976 (Govindan et al 2012) • cell differentiation: 20436464 (Cufflinks; Trapnell et al 2010) • Next generation sequencing paper/figures: 19997069 (Metzker 2010) • image sources: http://bit.ly/16h6P0Y, http://bit.ly/1cvKEc6, http://bit.ly/19TaSH9, http://bit.ly/12pNREw, http://bit.ly/HBbLaO
![thank you! contact (please feel free): email: [email protected] twitter: @acfrazee](https://files.speakerdeck.com/presentations/b1e442c0eff6013105920a306e107152/slide_55.jpg)