Upgrade to Pro — share decks privately, control downloads, hide ads and more …

A Business Process Metric Based on the Alpha Algorithm Relations

A Business Process Metric Based on the Alpha Algorithm Relations

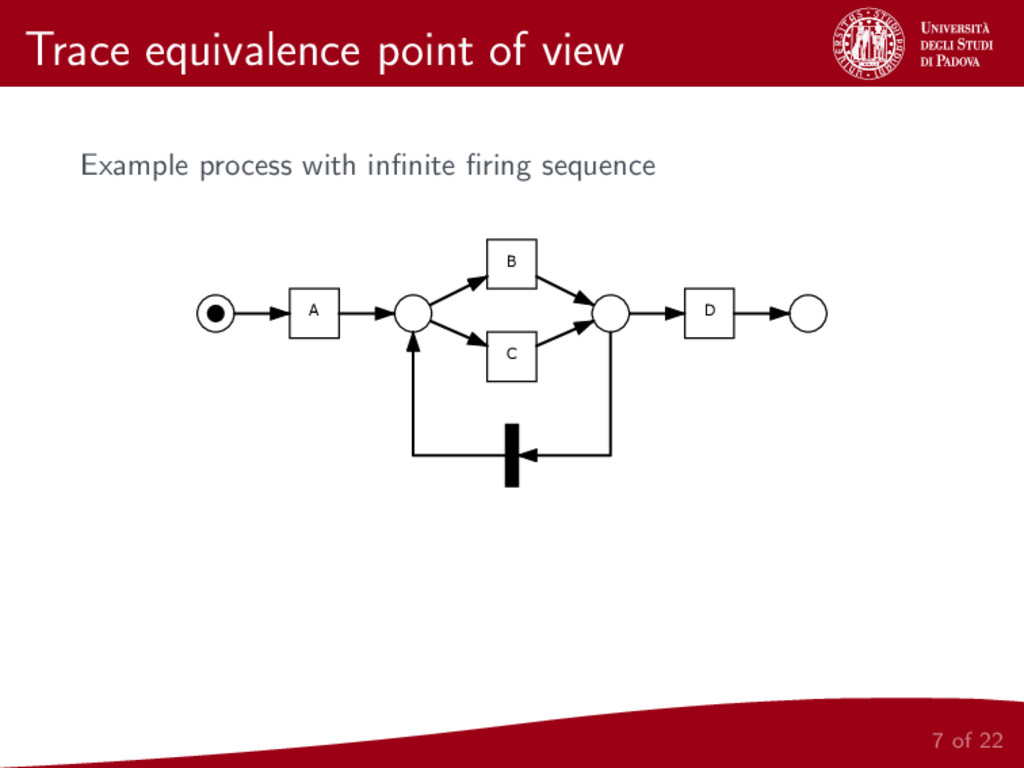
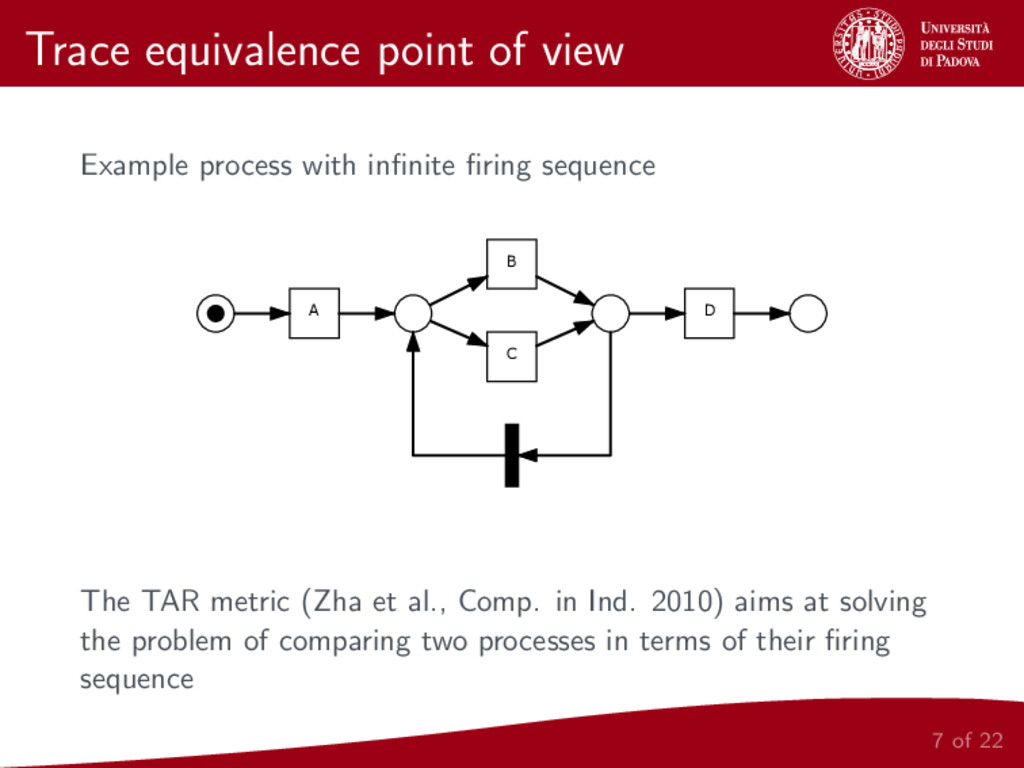
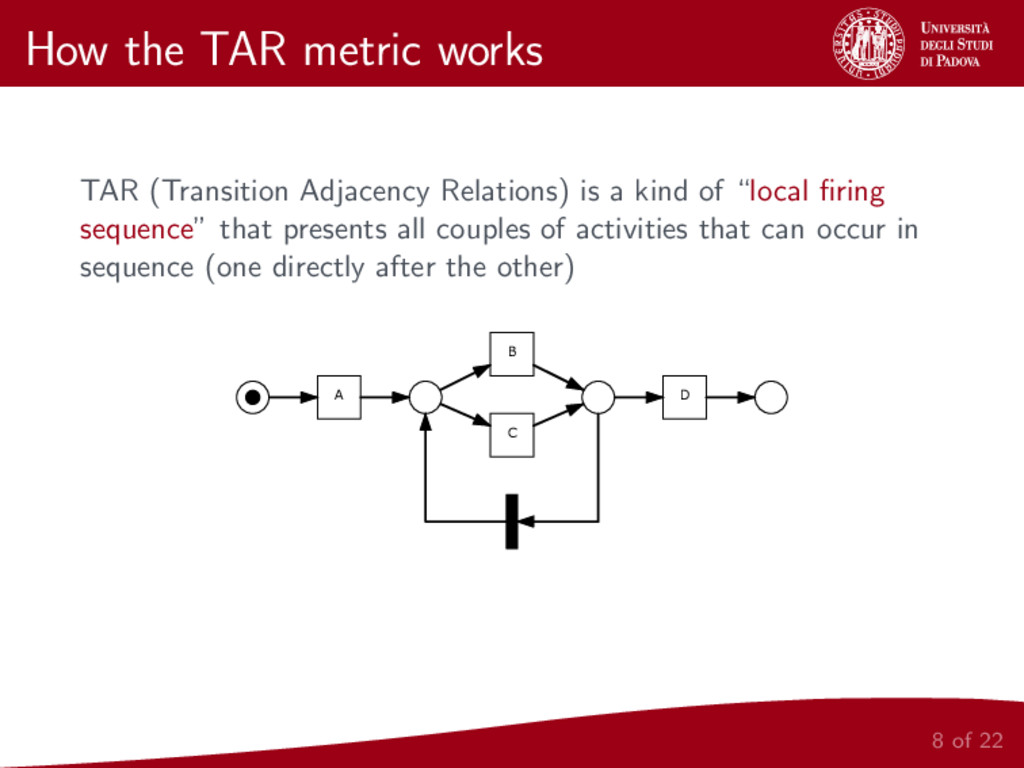
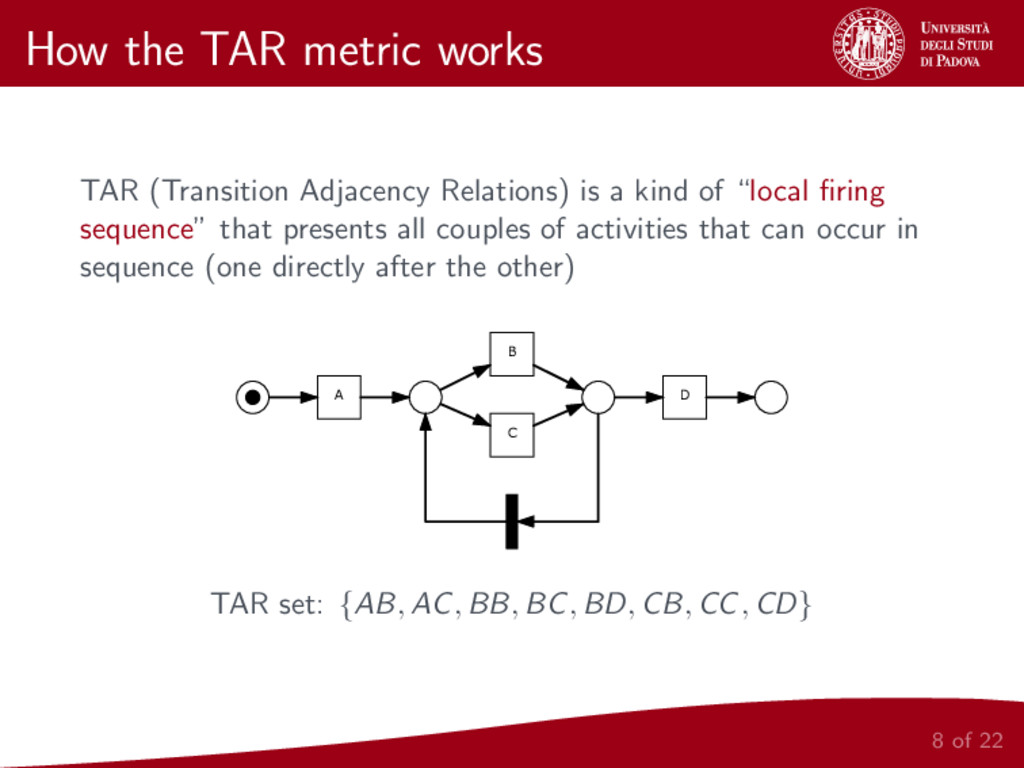
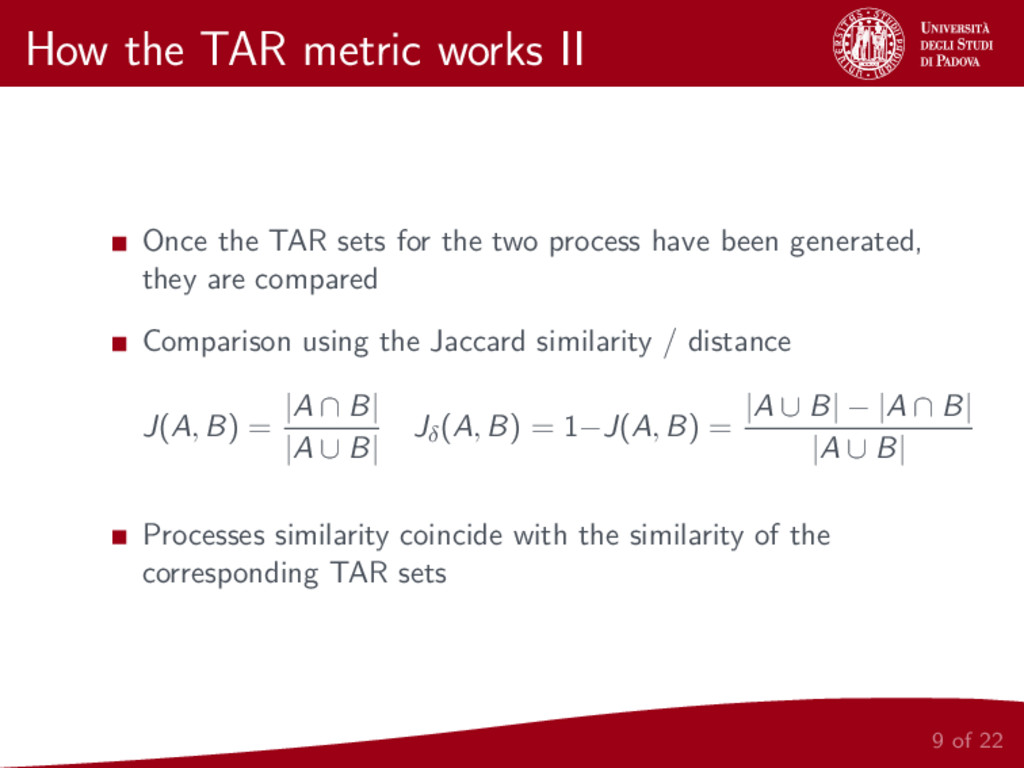
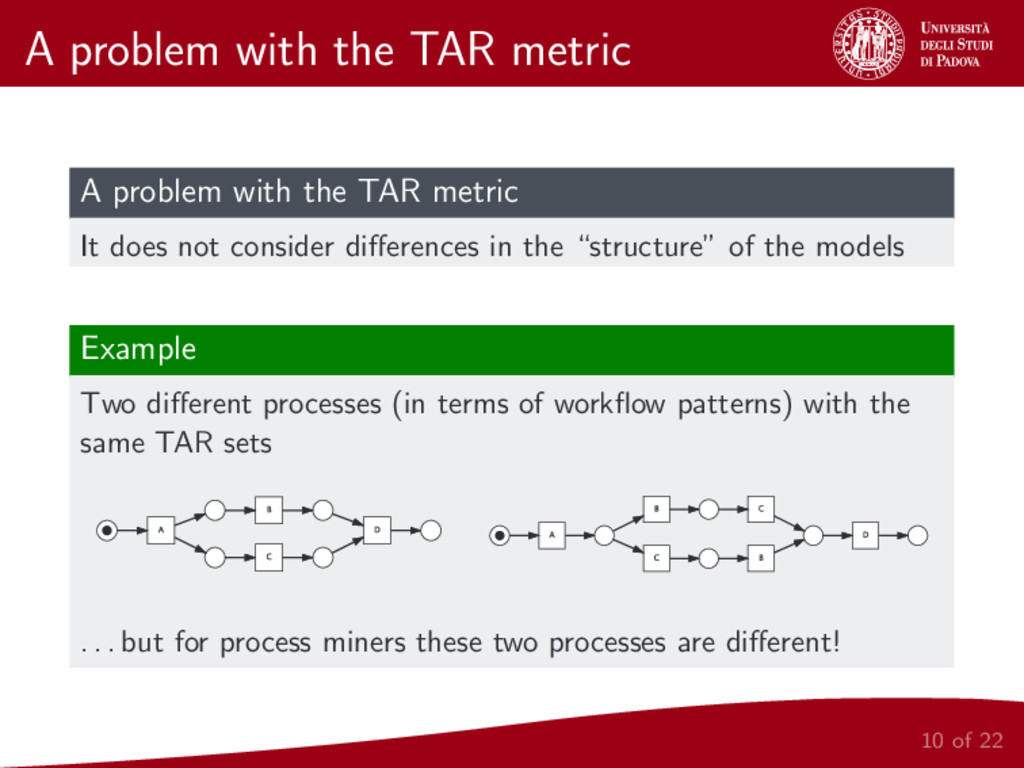
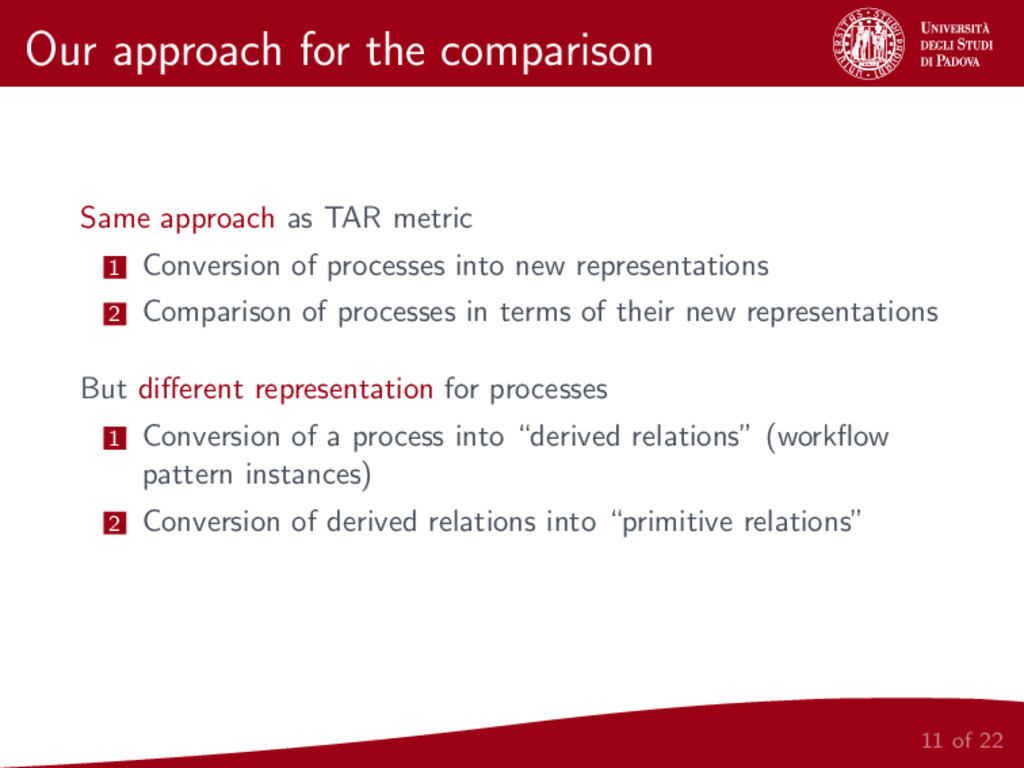
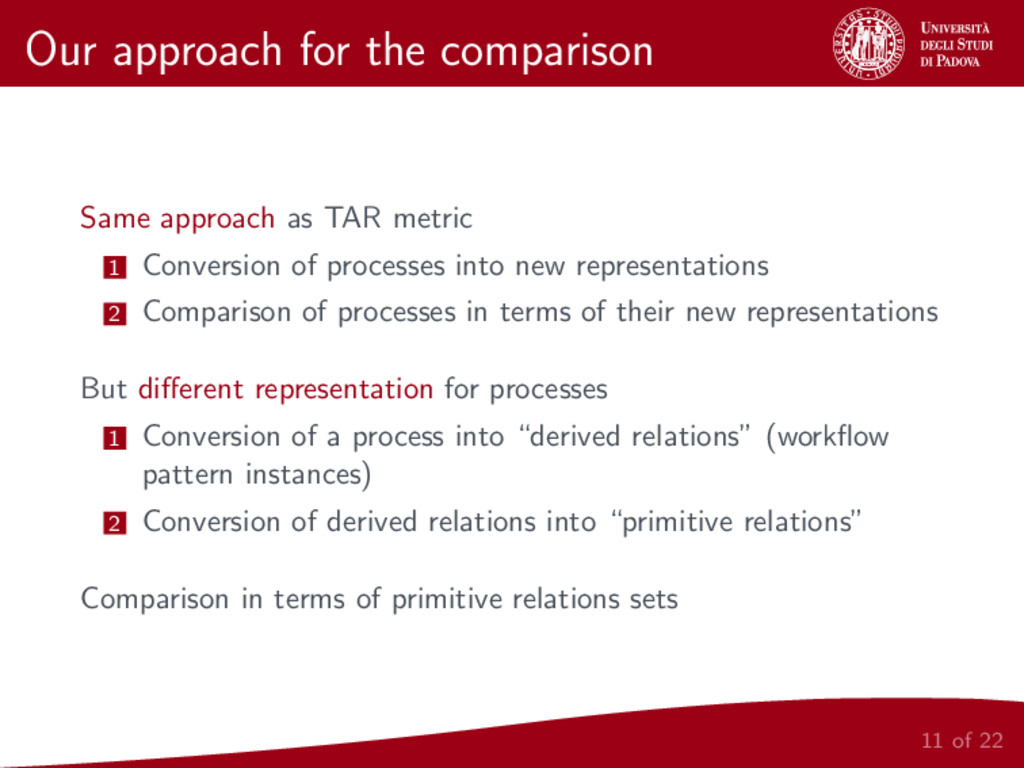
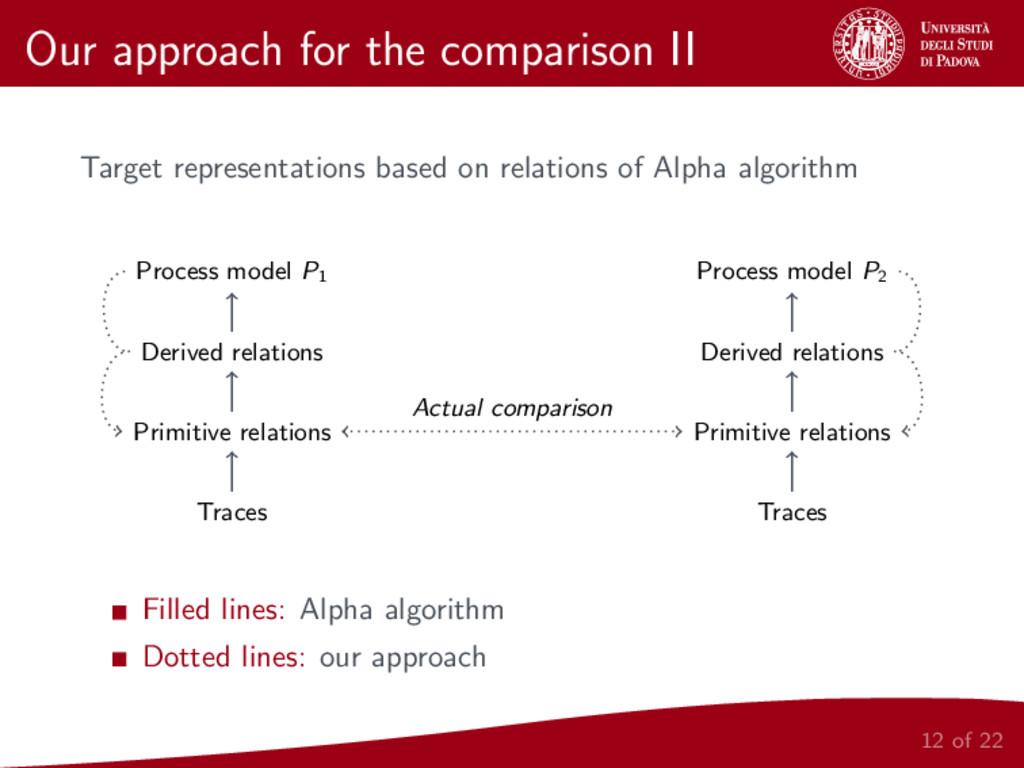
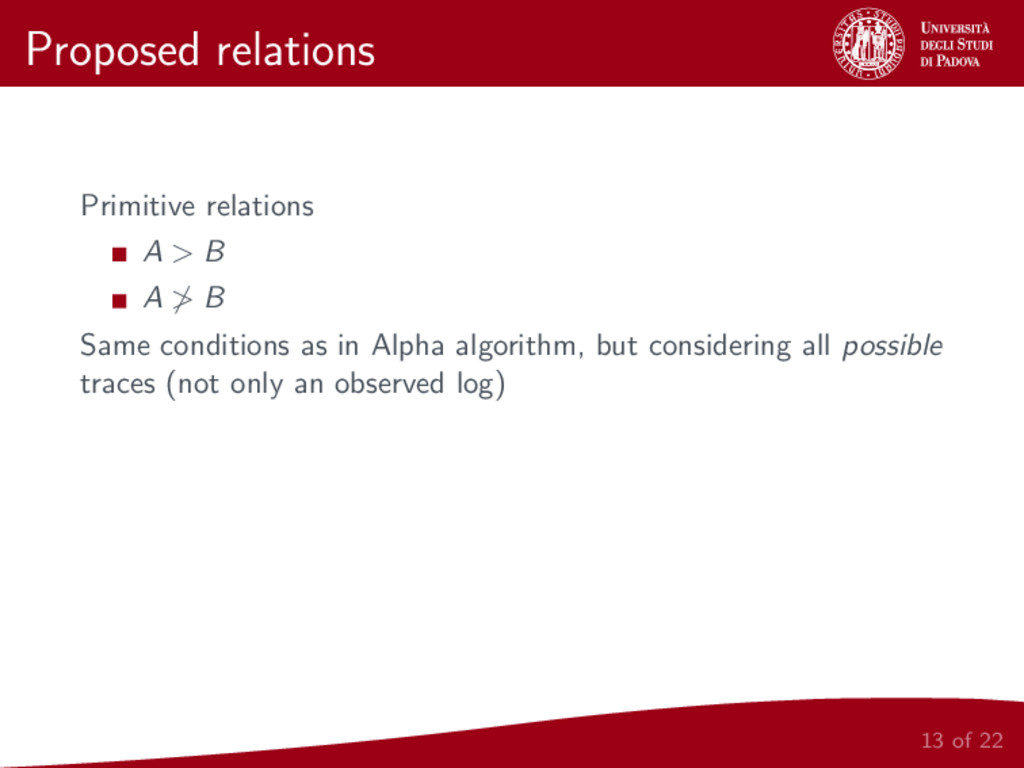
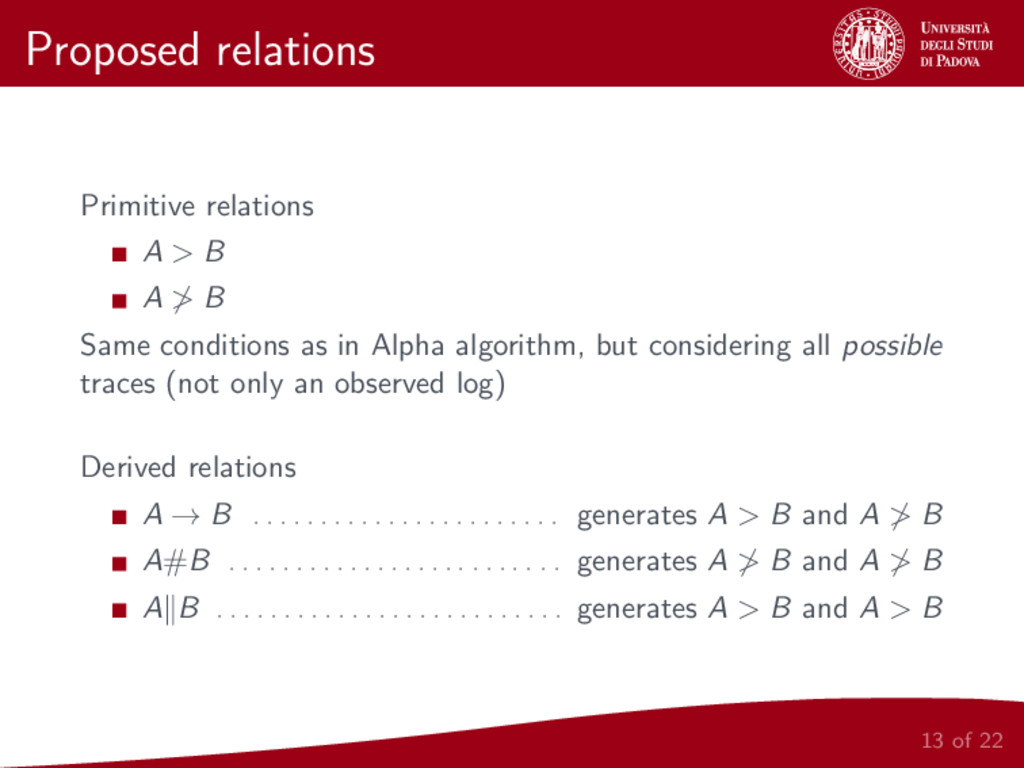
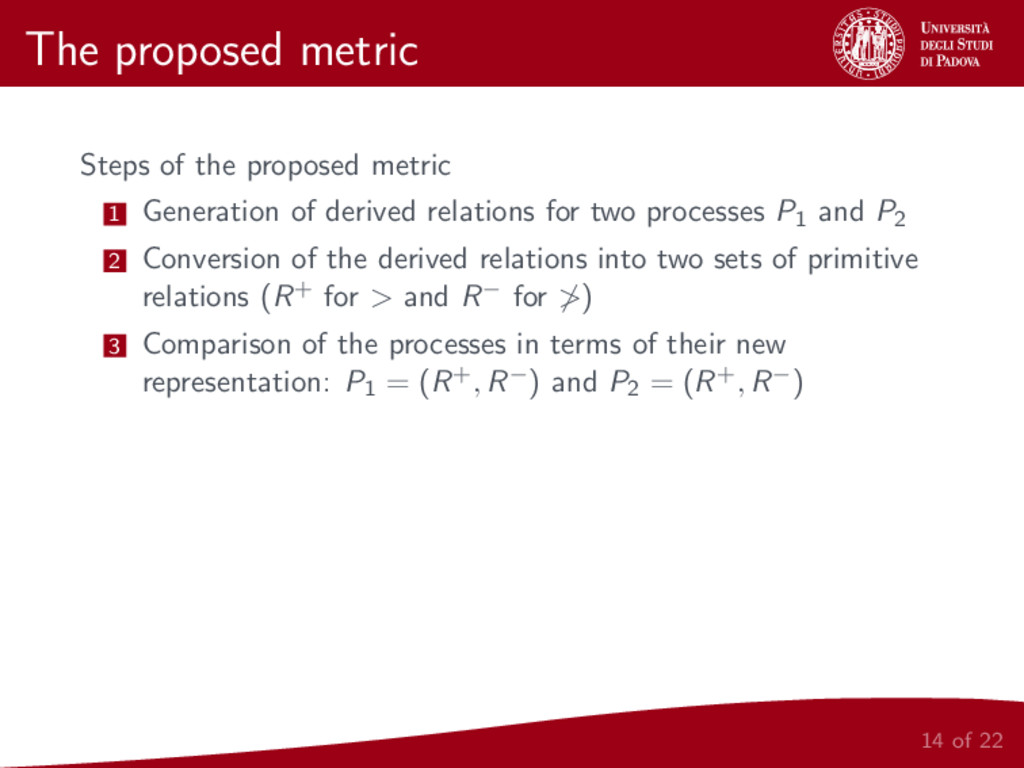
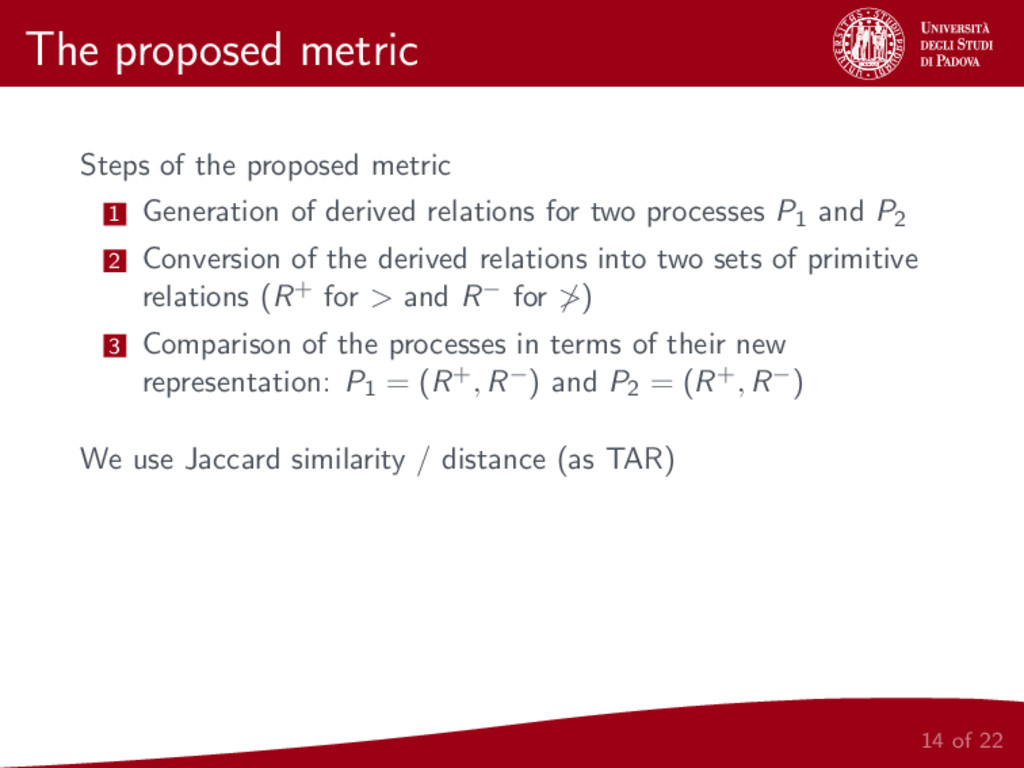
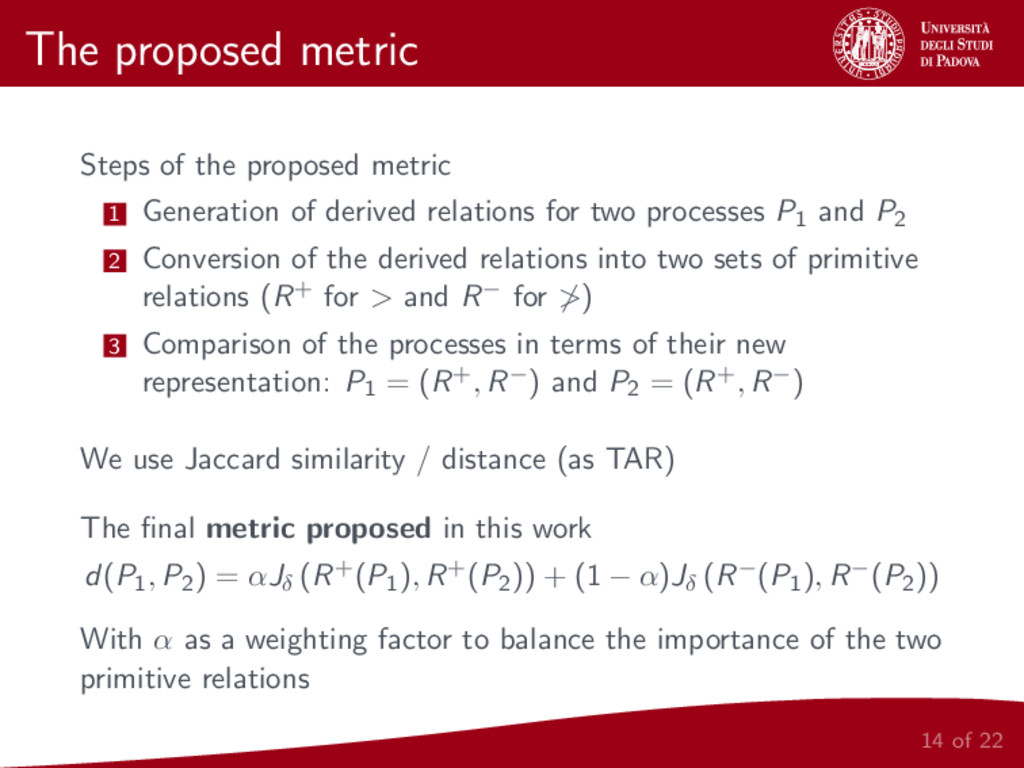
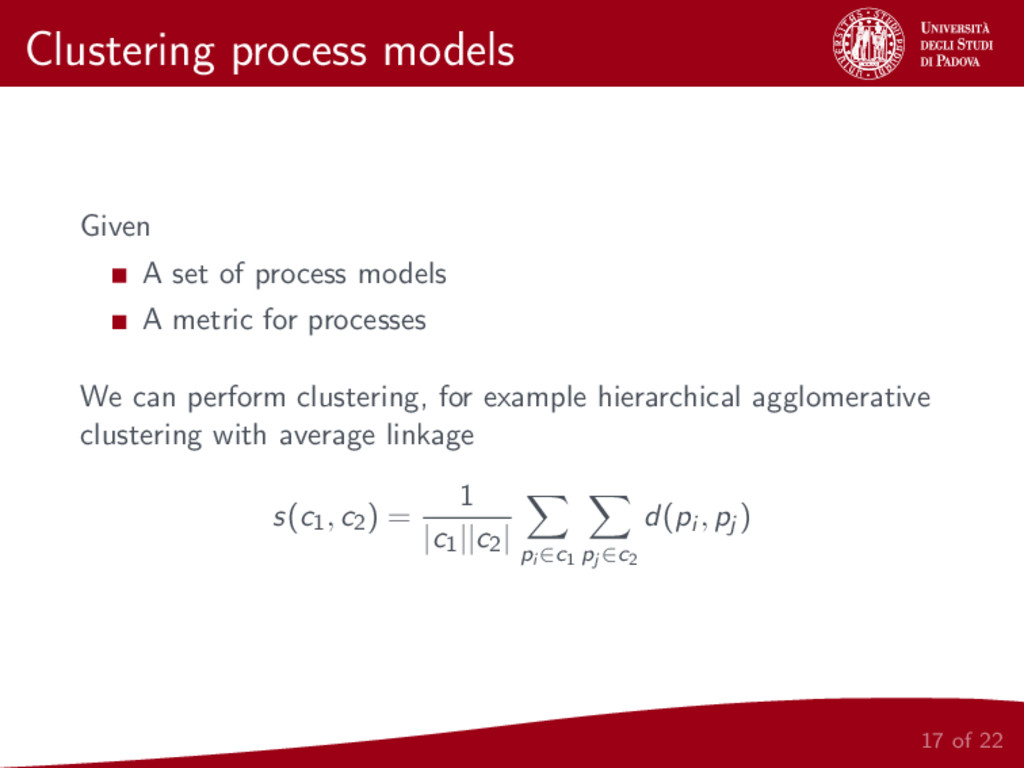
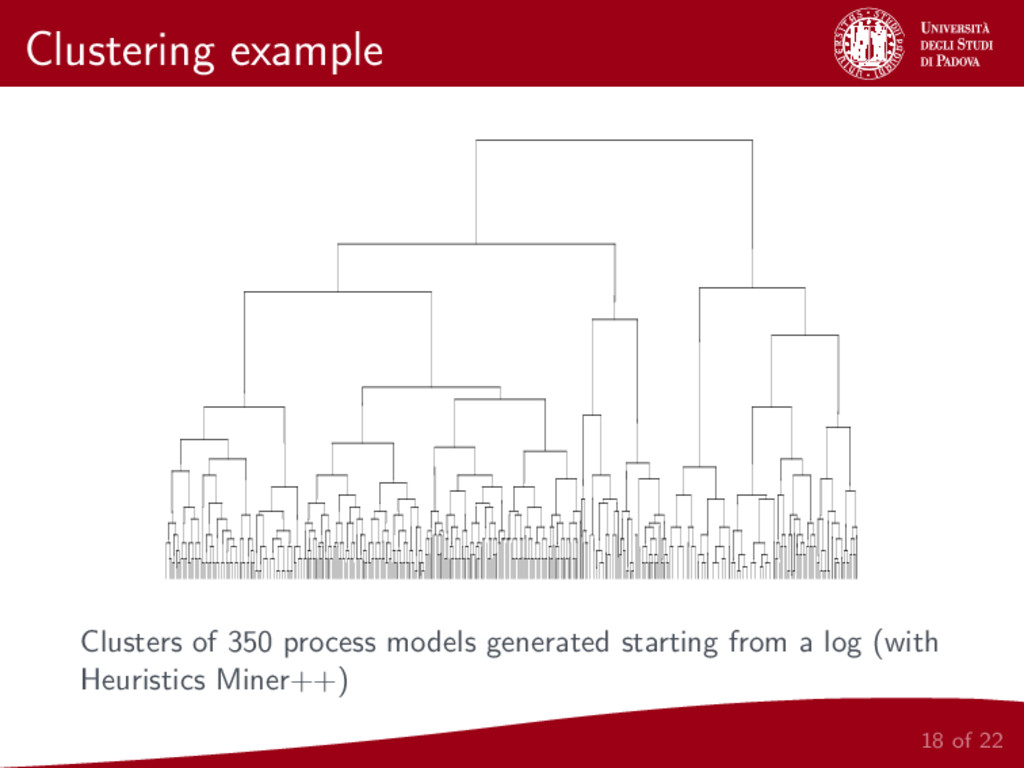
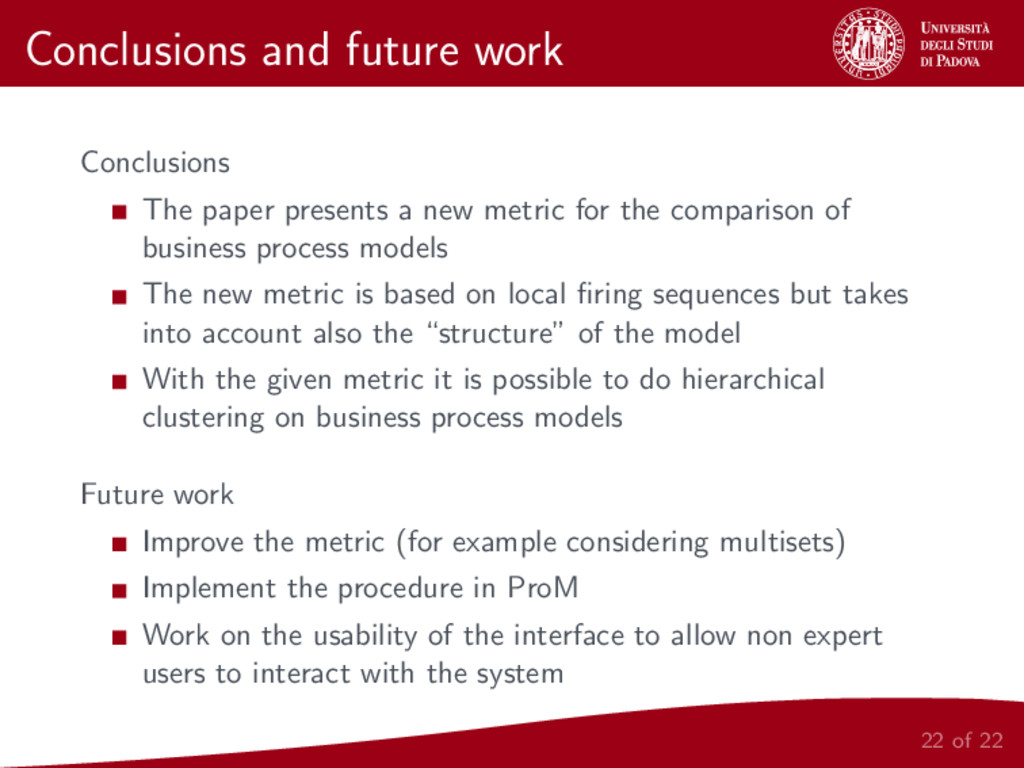
We present a metric for the comparison of business process models. This new metric is based on a representation of a given model as two sets of local relations between pairs of activities in the model. In order to build this two sets, the same relations defined for the Alpha Algorithm [2] are considered. The proposed metric is then applied to hierarchical clustering of business process models and the whole procedure is implemented and made publicly available.

More info: http://andrea.burattin.net/publications/2011-bpi

Andrea Burattin

August 29, 2011
Tweet

More Decks by Andrea Burattin

Other Decks in Science

Transcript

  1. A Business Process Metric Based on the Alpha Algorithm Relations

    Fabio Aiolli, Andrea Burattin, and Alessandro Sperduti Department of Pure and Applied Mathematics University of Padua, Italy August 29th, 2011
  2. Introduction Typical situation Process mining algorithms and tools are designed

    to deal with real-world data Real-world data contain noise and can be incomplete Problem statement Many mining techniques try to solve the problem of noise with parameters. These are thresholds on specific values of the algorithm and are used to discriminate noisy behavior Process mining users are not necessarily technicians so they are not required to have deep knowledge of algorithms Process mining algorithms are implemented in tools Non expert users don’t understand algorithms and that’s why they can have difficulties in using tools 2 of 22
  3. Process mining for non expert users Possible solutions to help

    non expert users with process mining techniques and tools 1 Simplify the algorithms (no parameters required) 2 Build a system that can choose the algorithm and its configuration 3 Don’t ask any parameters to the user, but let him interactively choose the solution that he considers the best 3 of 22
  4. Process mining for non expert users Possible solutions to help

    non expert users with process mining techniques and tools 1 Simplify the algorithms (no parameters required) 2 Build a system that can choose the algorithm and its configuration 3 Don’t ask any parameters to the user, but let him interactively choose the solution that he considers the best Observations Solution 1: extremely hard (flexibility/abstraction impossible) Solution 2: hard, we tried with the application of the MDL principle (Burattin and Sperduti, IEEE WCCI 2010) Solution 3: the final aim of this work 3 of 22
  5. Our proposed solution Approach to allow non expert users to

    benefit from process mining techniques (we consider Heuristics Miner++) 1 Discretization of the space of the values for the parameters 2 Generation of all the possible models (cartesian product of the values of the parameters) 3 Clusterize the models in a “hierarchy” that can be explored 4 Let the user navigate through the hierarchy to find the model that fits the requirements / describes the reality 4 of 22
  6. Our proposed solution Approach to allow non expert users to

    benefit from process mining techniques (we consider Heuristics Miner++) 1 Discretization of the space of the values for the parameters 2 Generation of all the possible models (cartesian product of the values of the parameters) 3 Clusterize the models in a “hierarchy” that can be explored 4 Let the user navigate through the hierarchy to find the model that fits the requirements / describes the reality 4 of 22
  7. New problems In order to perform clustering it is necessary

    to compare business processes models Problems Which perspectives are relevant for the comparison? Is it possible to define a metric that measures the given perspectives? 5 of 22
  8. Comparison of process models Our metric is designed to work

    on results of control-flow discovery algorithms We are interested in considering two perspectives for our metric A “trace equivalence” point of view The structure of the model (which workflow templates are involved) In the literature, many metrics have been proposed (e.g. van der Aalst et al. BPM 2006, Ehrig et al. APCCM 2007, Bae et al. JWSR 2007, van Dongen et al. AISE 2008, Dijkman BPM 2008, Wang et al. OTM 2010, Zha et al. Comp. in Ind. 2010, Weidlich et al., TSE 2011, . . . ) 6 of 22
  9. Trace equivalence point of view Example process with infinite firing

    sequence A B C D The TAR metric (Zha et al., Comp. in Ind. 2010) aims at solving the problem of comparing two processes in terms of their firing sequence 7 of 22
  10. How the TAR metric works TAR (Transition Adjacency Relations) is

    a kind of “local firing sequence” that presents all couples of activities that can occur in sequence (one directly after the other) A B C D 8 of 22
  11. How the TAR metric works TAR (Transition Adjacency Relations) is

    a kind of “local firing sequence” that presents all couples of activities that can occur in sequence (one directly after the other) A B C D TAR set: {AB, AC, BB, BC, BD, CB, CC, CD} 8 of 22
  12. How the TAR metric works II Once the TAR sets

    for the two process have been generated, they are compared Comparison using the Jaccard similarity / distance J(A, B) = |A ∩ B| |A ∪ B| Jδ(A, B) = 1−J(A, B) = |A ∪ B| − |A ∩ B| |A ∪ B| Processes similarity coincide with the similarity of the corresponding TAR sets 9 of 22
  13. A problem with the TAR metric A problem with the

    TAR metric It does not consider differences in the “structure” of the models 10 of 22
  14. A problem with the TAR metric A problem with the

    TAR metric It does not consider differences in the “structure” of the models Example Two different processes (in terms of workflow patterns) with the same TAR sets 10 of 22
  15. A problem with the TAR metric A problem with the

    TAR metric It does not consider differences in the “structure” of the models Example Two different processes (in terms of workflow patterns) with the same TAR sets . . . but for process miners these two processes are different! 10 of 22
  16. Our approach for the comparison Same approach as TAR metric

    1 Conversion of processes into new representations 2 Comparison of processes in terms of their new representations But different representation for processes 1 Conversion of a process into “derived relations” (workflow pattern instances) 2 Conversion of derived relations into “primitive relations” 11 of 22
  17. Our approach for the comparison Same approach as TAR metric

    1 Conversion of processes into new representations 2 Comparison of processes in terms of their new representations But different representation for processes 1 Conversion of a process into “derived relations” (workflow pattern instances) 2 Conversion of derived relations into “primitive relations” Comparison in terms of primitive relations sets 11 of 22
  18. Our approach for the comparison II Target representations based on

    relations of Alpha algorithm Process model P1 Derived relations Primitive relations Traces Process model P2 Derived relations Primitive relations Traces Actual comparison Filled lines: Alpha algorithm Dotted lines: our approach 12 of 22
  19. Proposed relations Primitive relations A > B A ≯ B

    Same conditions as in Alpha algorithm, but considering all possible traces (not only an observed log) 13 of 22
  20. Proposed relations Primitive relations A > B A ≯ B

    Same conditions as in Alpha algorithm, but considering all possible traces (not only an observed log) Derived relations A → B . . . . . . . . . . . . . . . . . . . . . . . generates A > B and A ≯ B A#B . . . . . . . . . . . . . . . . . . . . . . . . . generates A ≯ B and A ≯ B A B . . . . . . . . . . . . . . . . . . . . . . . . . . generates A > B and A > B 13 of 22
  21. The proposed metric Steps of the proposed metric 1 Generation

    of derived relations for two processes P1 and P2 2 Conversion of the derived relations into two sets of primitive relations (R+ for > and R− for ≯) 3 Comparison of the processes in terms of their new representation: P1 = (R+, R−) and P2 = (R+, R−) 14 of 22
  22. The proposed metric Steps of the proposed metric 1 Generation

    of derived relations for two processes P1 and P2 2 Conversion of the derived relations into two sets of primitive relations (R+ for > and R− for ≯) 3 Comparison of the processes in terms of their new representation: P1 = (R+, R−) and P2 = (R+, R−) We use Jaccard similarity / distance (as TAR) 14 of 22
  23. The proposed metric Steps of the proposed metric 1 Generation

    of derived relations for two processes P1 and P2 2 Conversion of the derived relations into two sets of primitive relations (R+ for > and R− for ≯) 3 Comparison of the processes in terms of their new representation: P1 = (R+, R−) and P2 = (R+, R−) We use Jaccard similarity / distance (as TAR) The final metric proposed in this work d(P1, P2) = αJδ (R+(P1), R+(P2)) + (1 − α)Jδ (R−(P1), R−(P2)) With α as a weighting factor to balance the importance of the two primitive relations 14 of 22
  24. Comparison of metrics Given these processes Their distances measures TAR:

    0 Proposed metric: α = 1: 0; α = 0.5: 0.165; α = 0: 0.33 We have proven that, under typical process mining conditions, our metric recognizes processes that are structurally different 15 of 22
  25. Parameters configuration Recap of our possible approach 1 Discretization of

    the space of the values for the parameters 2 Generation of all the possible models (cartesian product of the values of the parameters) 3 Clusterize the models in a “hierarchy” that can be explored 4 Let the user navigate through the hierarchy to find the model that fits the requirements / describes the reality 16 of 22
  26. Clustering process models Given A set of process models A

    metric for processes We can perform clustering, for example hierarchical agglomerative clustering with average linkage s(c1, c2) = 1 |c1||c2| pi ∈c1 pj ∈c2 d(pi , pj ) 17 of 22
  27. Exploration of the hierarchy It is possible to extract a

    representative for each cluster, for example considering the medoid (i.e. a process whose average dissimilarity to all the elements in the same cluster is minimal) A dendrogram is a binary tree that can be “explored” from the root to a leaf The exploration of the dendrogram is performed considering the representatives of the two children of the current node and deciding to move to one or to the other Important: each representative of each cluster is always an element of the dataset (i.e. a “leaf” of the dendrogram) 19 of 22
  28. Implementation on the PLG Clustering and explorative procedure implemented in

    the PLG (Processes Logs Generator) tool A tool for the generation of random processes Freely available at http://www.processmining.it It is possible to clusterize the generated models Prototype for a ProM plugin is planned 20 of 22
  29. Conclusions and future work Conclusions The paper presents a new

    metric for the comparison of business process models The new metric is based on local firing sequences but takes into account also the “structure” of the model With the given metric it is possible to do hierarchical clustering on business process models Future work Improve the metric (for example considering multisets) Implement the procedure in ProM Work on the usability of the interface to allow non expert users to interact with the system 22 of 22