M.B.A., B.S. – Finance CSP, CSM, CSPO, PMP, PMI-ACP credentials @SocialAgilist [email protected] www.linkedin.com/in/anthonywmontgomery As I have been at the edge of mainstream Scrum by taking it into business teams, I’d like to dedicate this presentation to diversity of all kinds. I appreciate the opportunity to share my ideas and perspectives.
interaction perspective. q Raise awareness of the value of social interactions within teams. q Knowledge of actual results when a team’s output is a service.
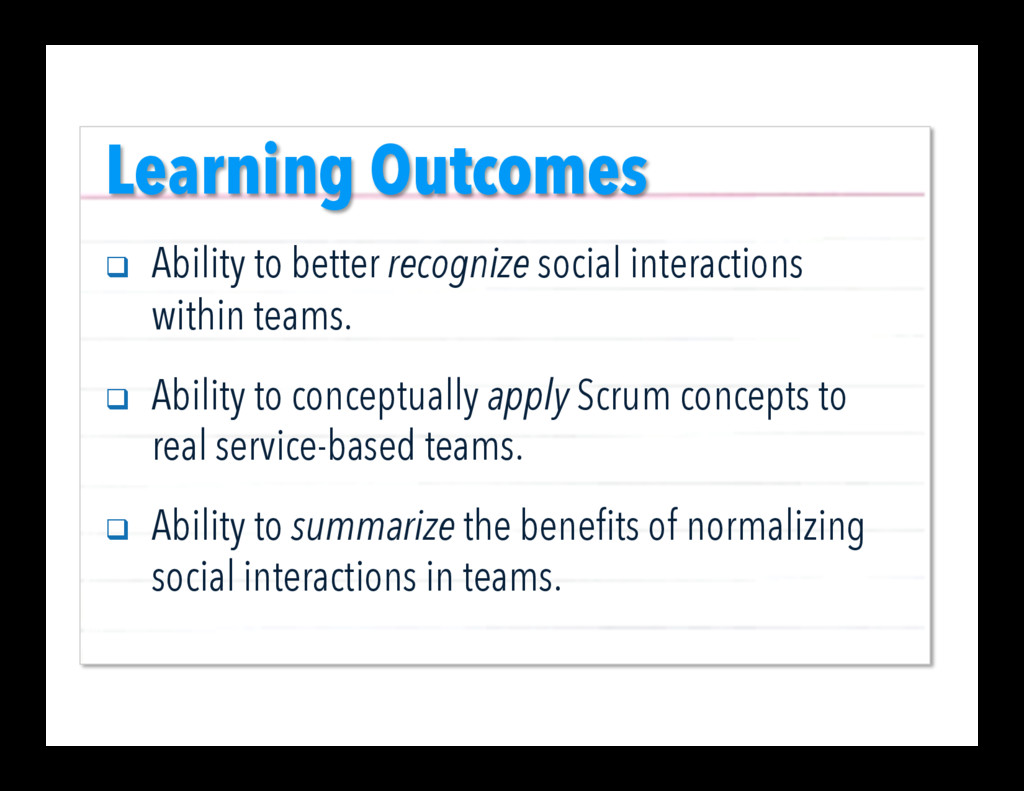
teams. q Ability to conceptually apply Scrum concepts to real service-based teams. q Ability to summarize the benefits of normalizing social interactions in teams.
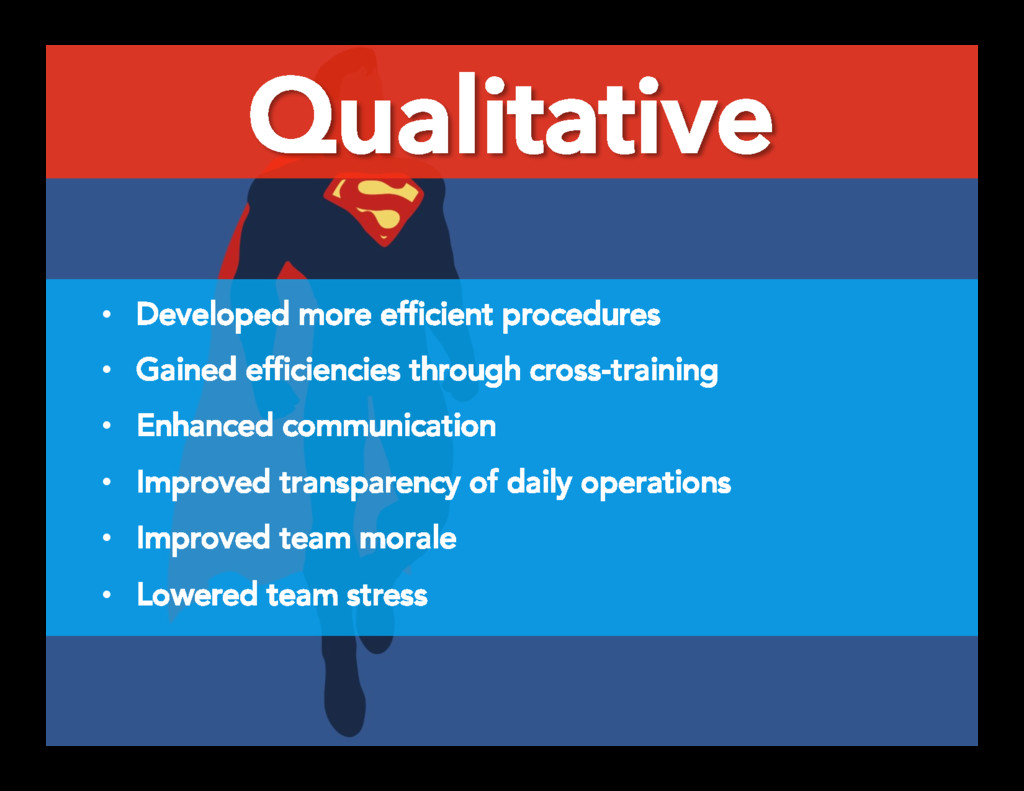
Created with Haiku Deck The social nature of Scrum provides: § Business Results (e.g. productivity, efficiency, customer responsiveness) § Team Results (e.g. enhanced processes) § Individual Results (e.g. commitment) Economic Benefits
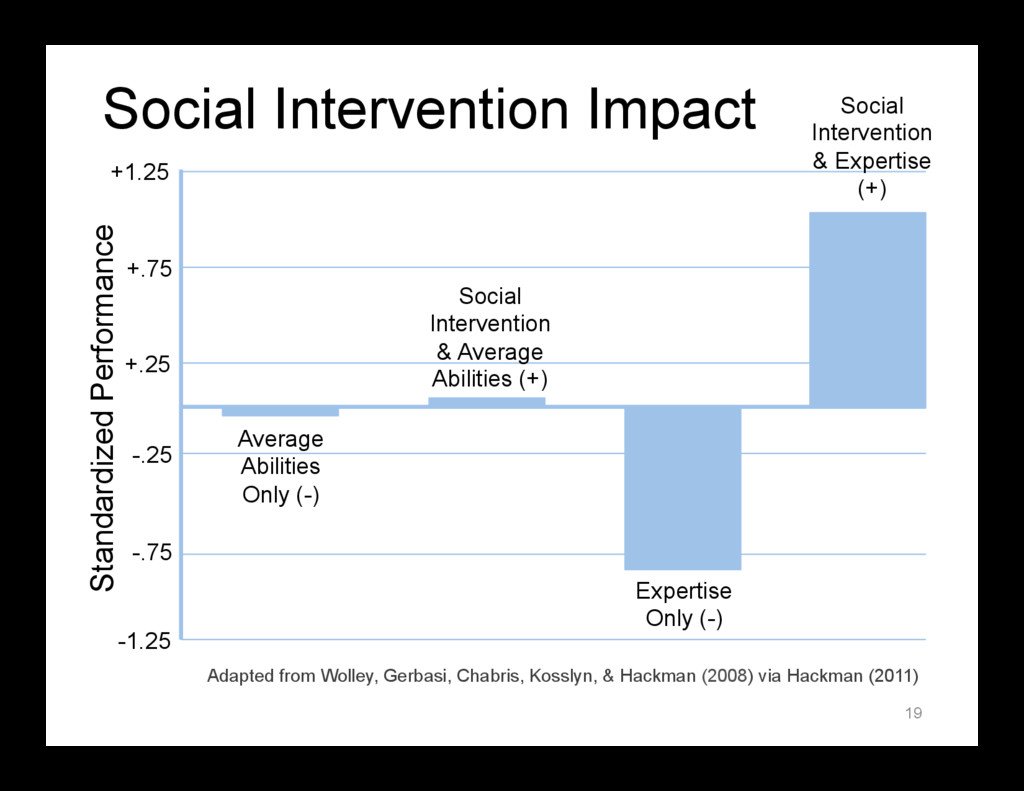
Standardized Performance Average Abilities Only (-) Social Intervention & Average Abilities (+) Expertise Only (-) Social Intervention & Expertise (+) Adapted from Wolley, Gerbasi, Chabris, Kosslyn, & Hackman (2008) via Hackman (2011)
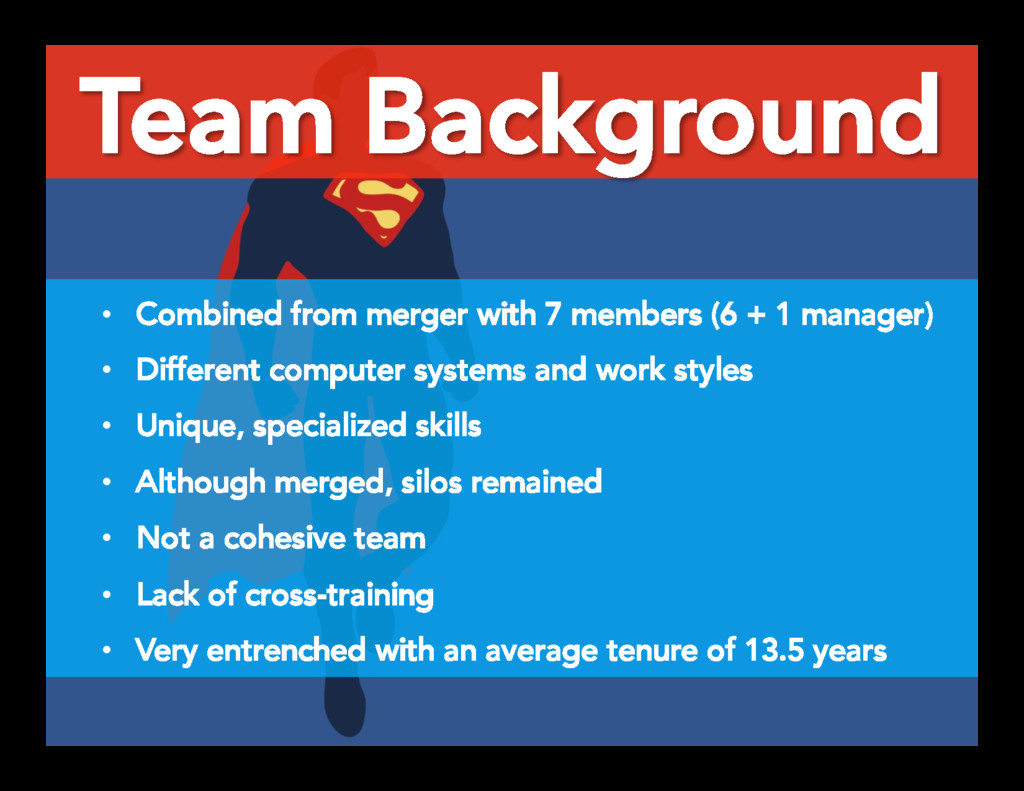
manager) • Different computer systems and work styles • Unique, specialized skills • Although merged, silos remained • Not a cohesive team • Lack of cross-training • Very entrenched with an average tenure of 13.5 years Team Background
worse than required) • Sizeable backlog of incomplete activities • Strained relationships with the Sales Department • Overtime of 20-hours per member per month • Desperate manager Current Situation
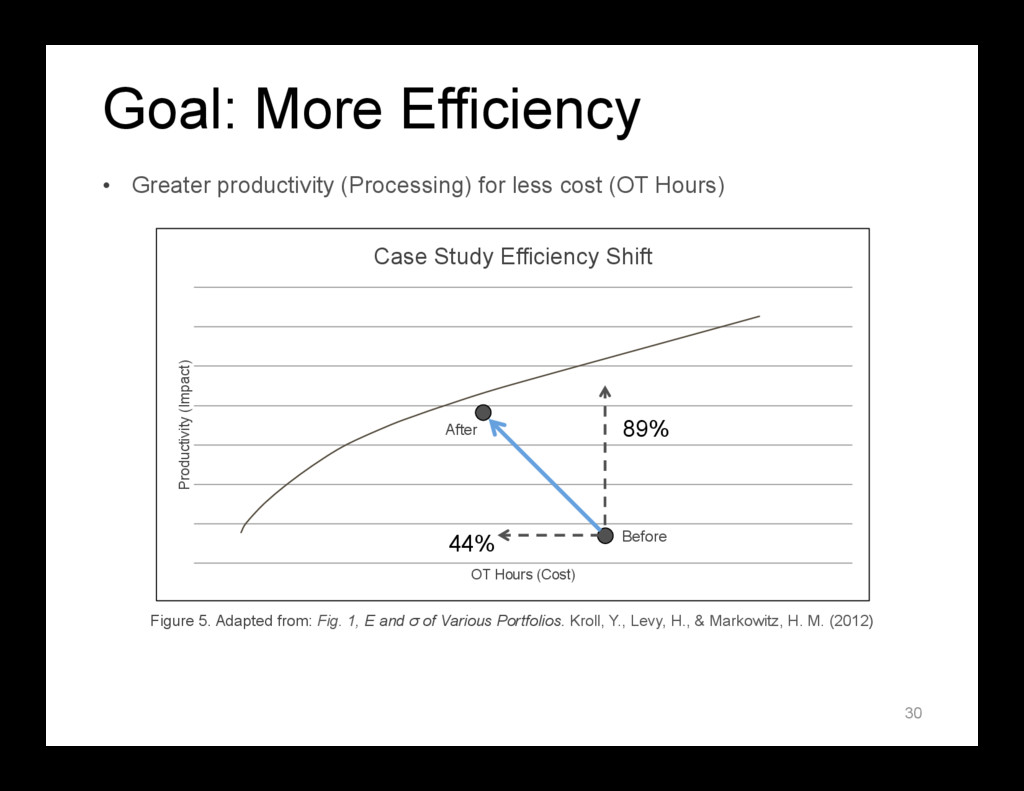
Efficiency Shift Before Figure 5. Adapted from: Fig. 1, E and σ of Various Portfolios. Kroll, Y., Levy, H., & Markowitz, H. M. (2012) • Greater productivity (Processing) for less cost (OT Hours) 30 89% 44% After
- 500 1,000 1,500 2,000 2,500 3,000 3,500 4,000 July 2012 August 2012 September 2012 October 2012 November 2012 December 2012 January 2013 February 2013* March 2013 April 2013 May 2013 June 2013 Figure 6. Changed Only How The Team Interacted With Each Other Average after Scrum = 2,784 activities Average before Scrum = 1,474 activities
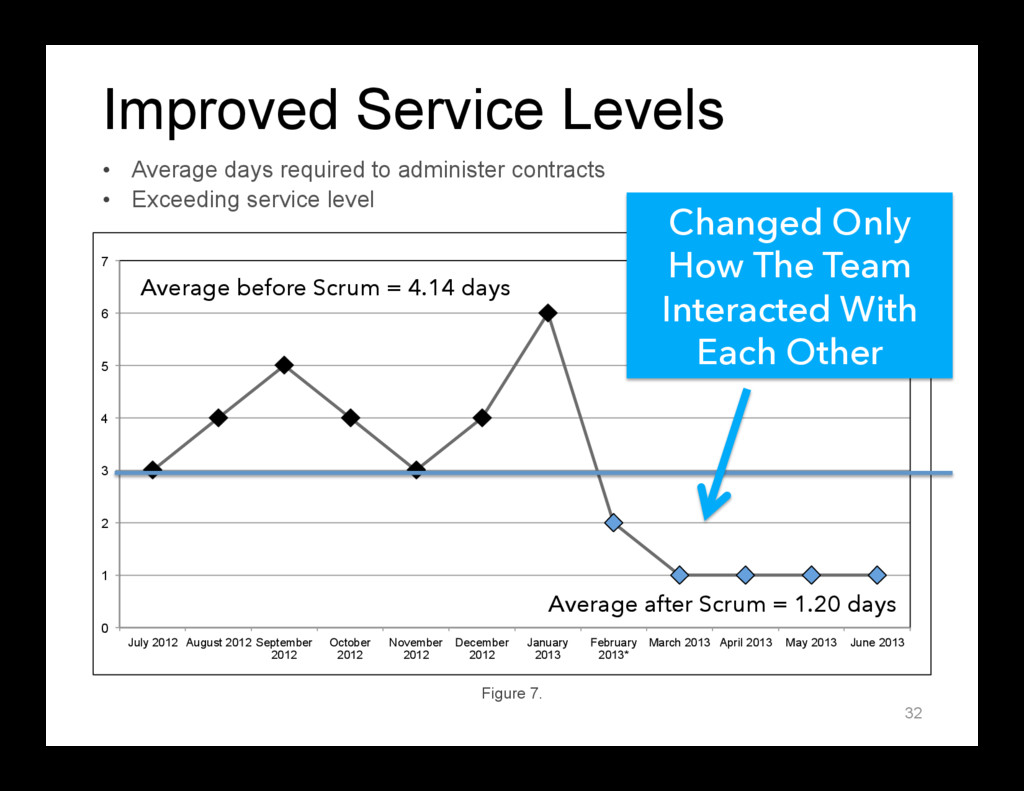
• Exceeding service level 32 0 1 2 3 4 5 6 7 July 2012 August 2012 September 2012 October 2012 November 2012 December 2012 January 2013 February 2013* March 2013 April 2013 May 2013 June 2013 Figure 7. Changed Only How The Team Interacted With Each Other Average before Scrum = 4.14 days Average after Scrum = 1.20 days
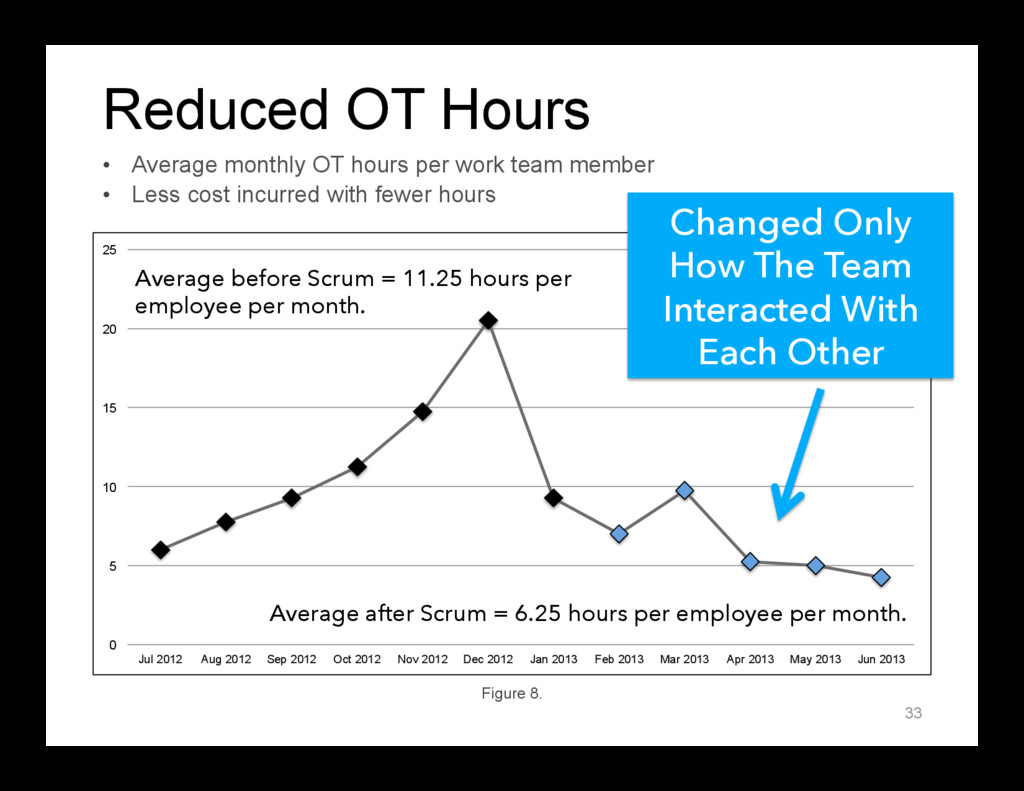
team member • Less cost incurred with fewer hours 33 0 5 10 15 20 25 Jul 2012 Aug 2012 Sep 2012 Oct 2012 Nov 2012 Dec 2012 Jan 2013 Feb 2013 Mar 2013 Apr 2013 May 2013 Jun 2013 Figure 8. Changed Only How The Team Interacted With Each Other Average before Scrum = 11.25 hours per employee per month. Average after Scrum = 6.25 hours per employee per month.
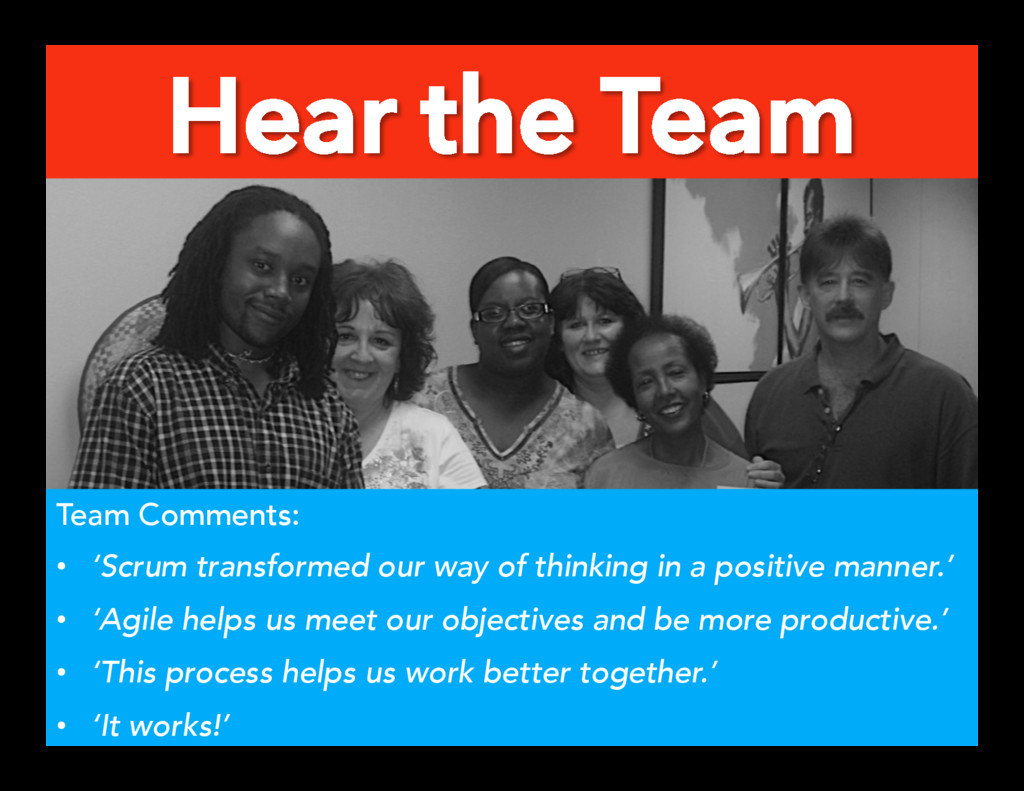
of thinking in a positive manner.’ • ‘Agile helps us meet our objectives and be more productive.’ • ‘This process helps us work better together.’ • ‘It works!’
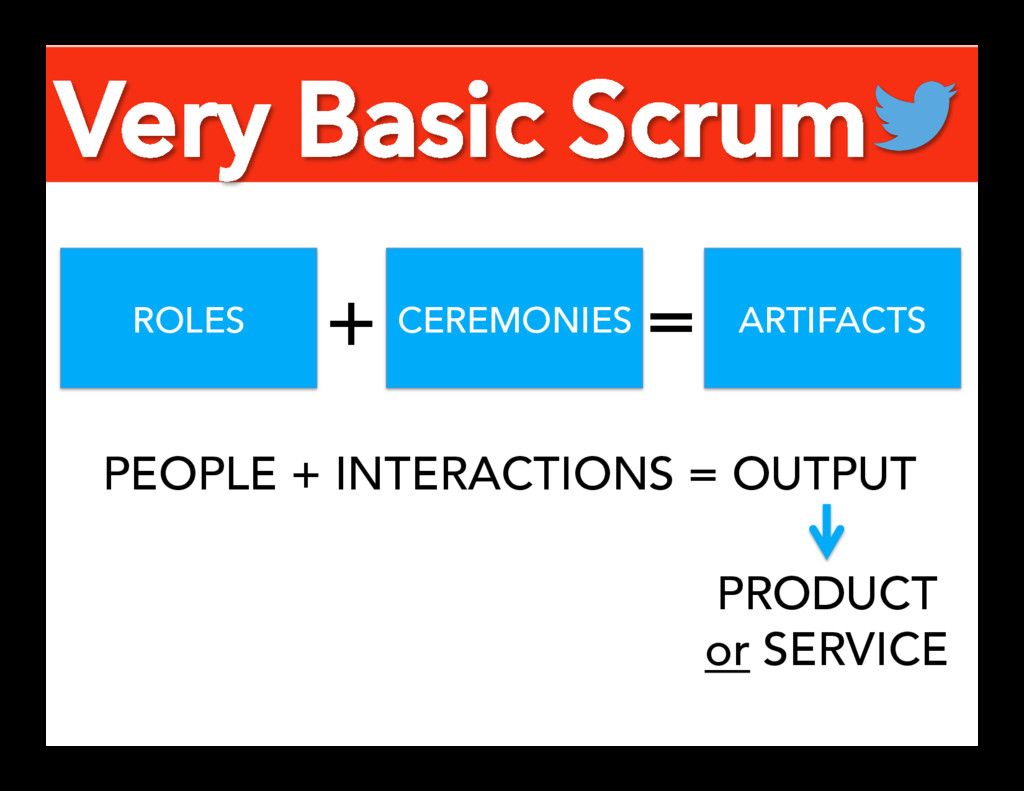
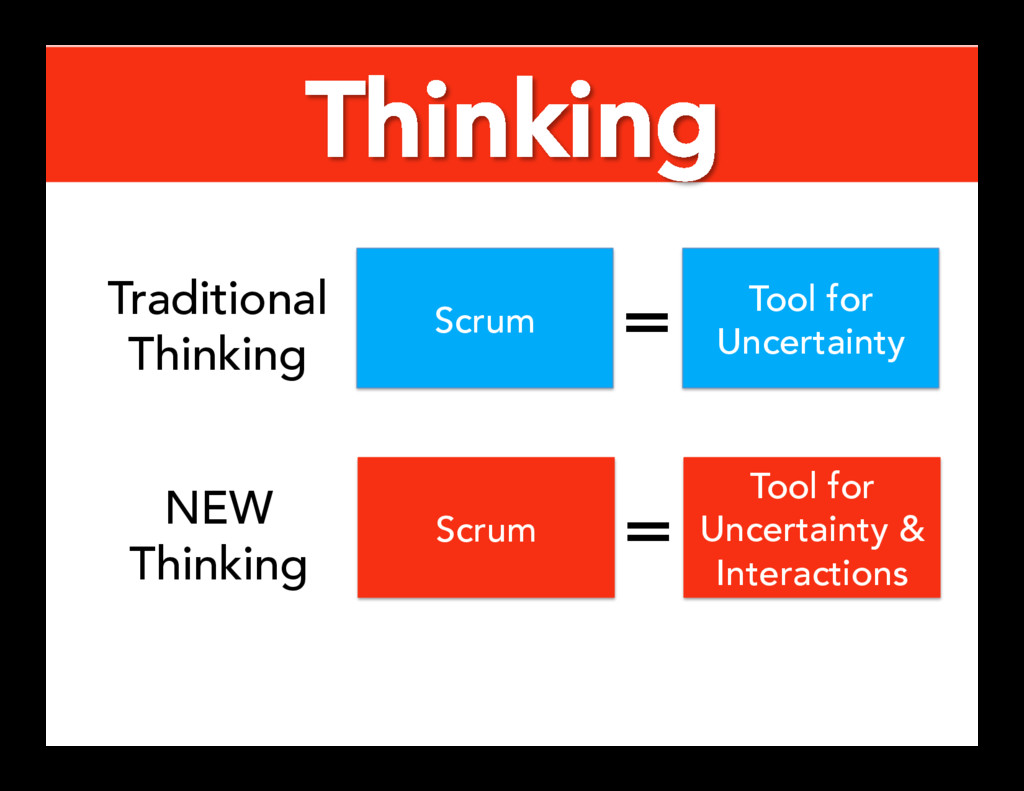
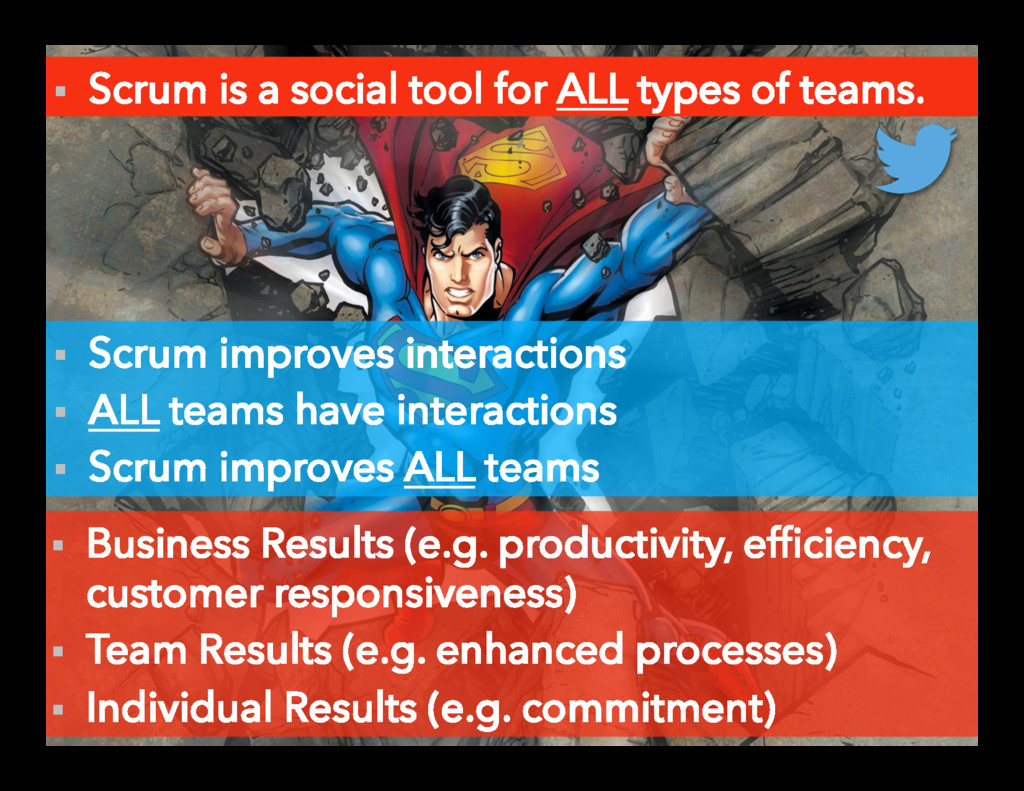
Scrum improves ALL teams § Scrum is a social tool for ALL types of teams. § Business Results (e.g. productivity, efficiency, customer responsiveness) § Team Results (e.g. enhanced processes) § Individual Results (e.g. commitment)
Agile & HDD; August 13, 2015; Unpublished conference presentation for the Nashville Tech Council, Nashville, TN. • Kroll, Y., Levy, H., & Markowitz, H. M. (2012). Mean‐Variance versus Direct Utility Maximization. The Journal of Finance, 39(1), 47-61. • Montgomery, A. (2013). Understanding How Non-IT Scrum Helps Raise Productivity, Boost Profits: An IAD Perspective. Unpublished conference presentation at the 2013 Global Scrum Gathering, Paris, France. • Montgomery, A., Bulkin, D. (2014). Team Based Business Process Re-engineering with Scrum. Unpublished presentation at the 2014 Global Scrum Gathering, Berlin, Germany. • Hackman, J. R. (2011). Collaborative intelligence: Using teams to solve hard problems. Berrett-Koehler Publishers. References