Upgrade to Pro — share decks privately, control downloads, hide ads and more …

Building a Foundation for Integrating Rich-Media on a Web 2.0 Campus (EDUWEB Conference 2010)

Building a Foundation for Integrating Rich-Media on a Web 2.0 Campus (EDUWEB Conference 2010)

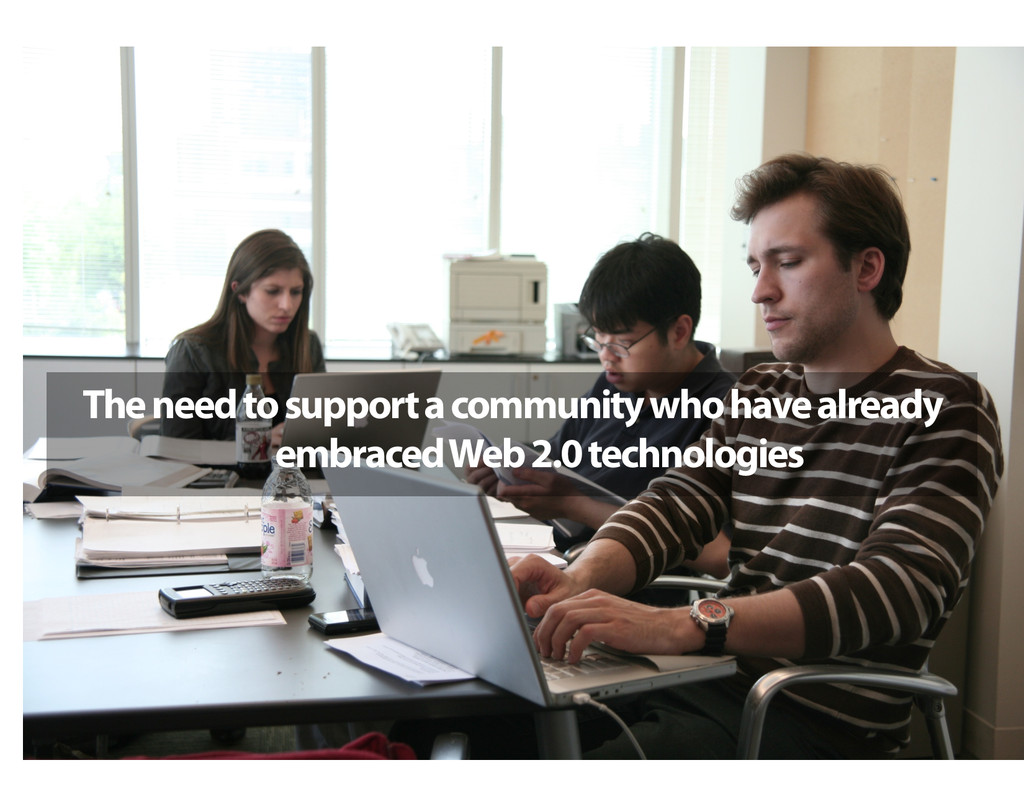
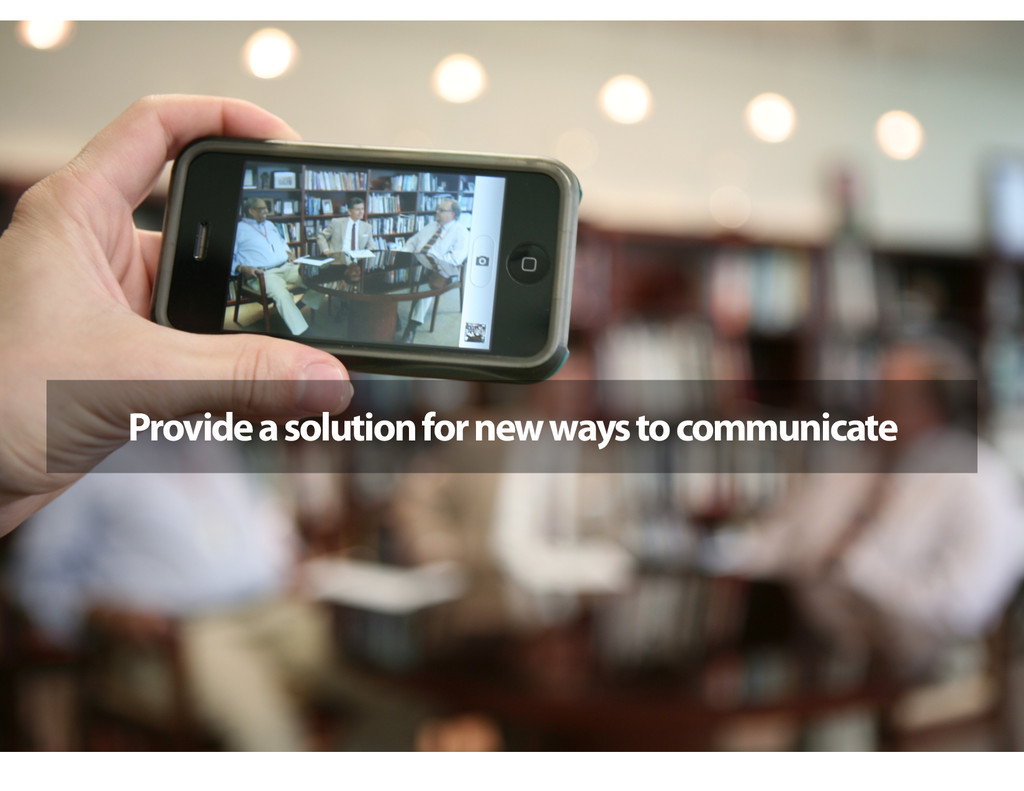
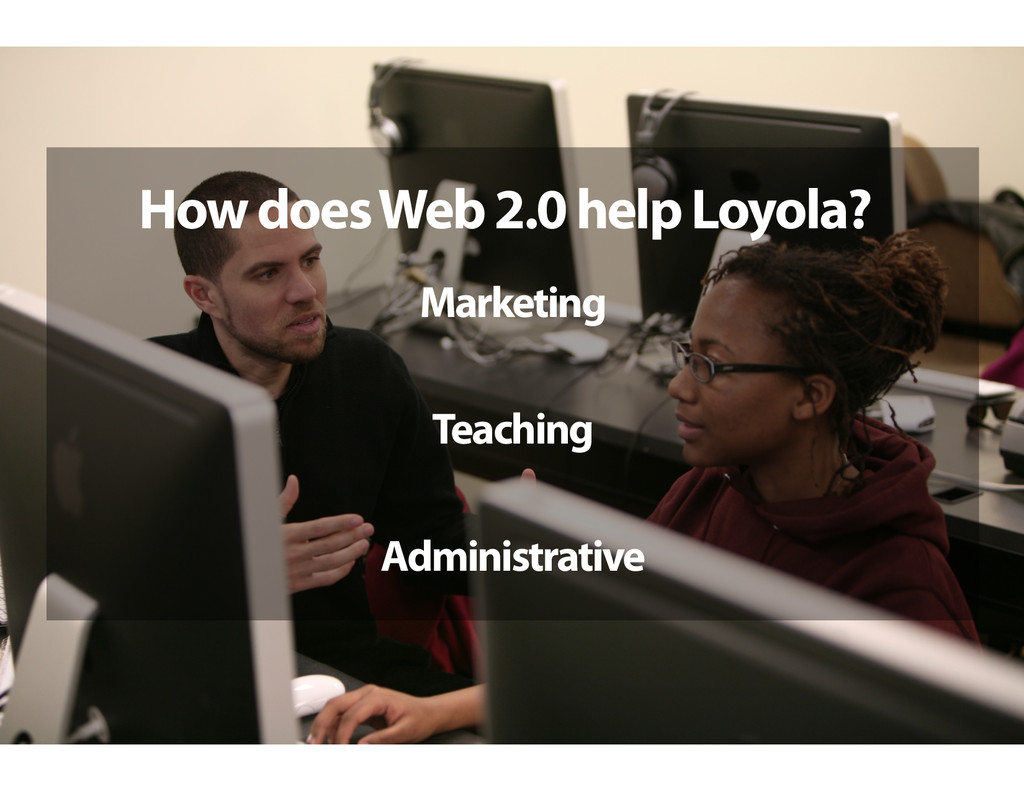
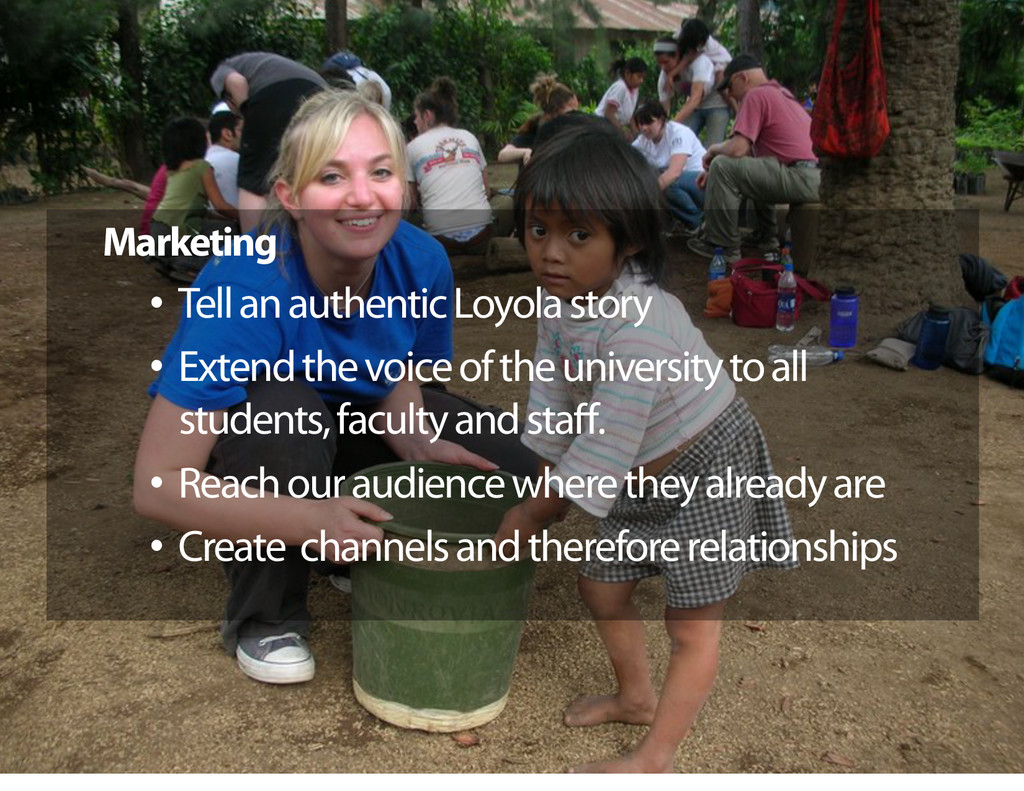
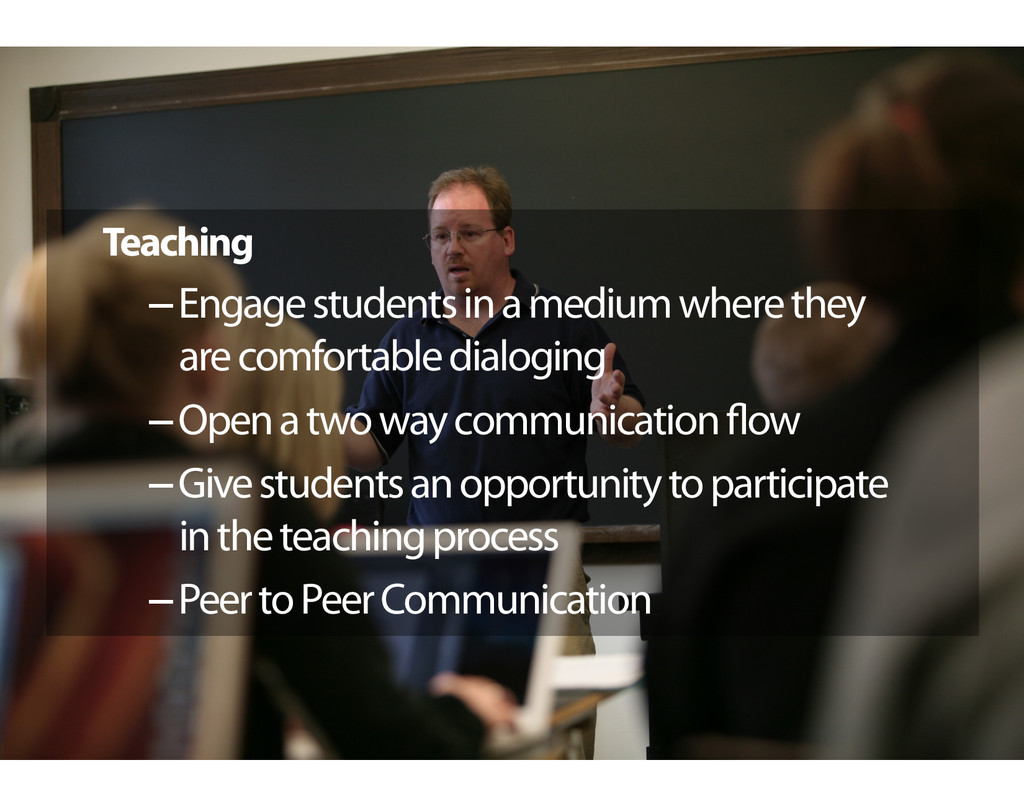
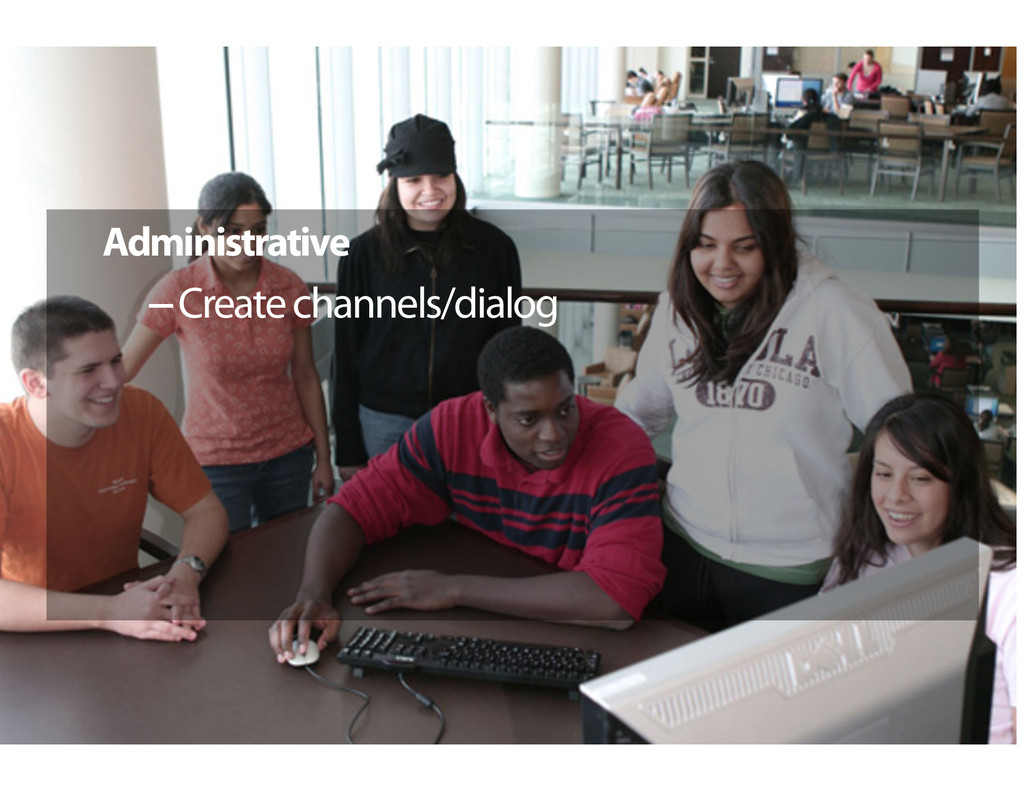
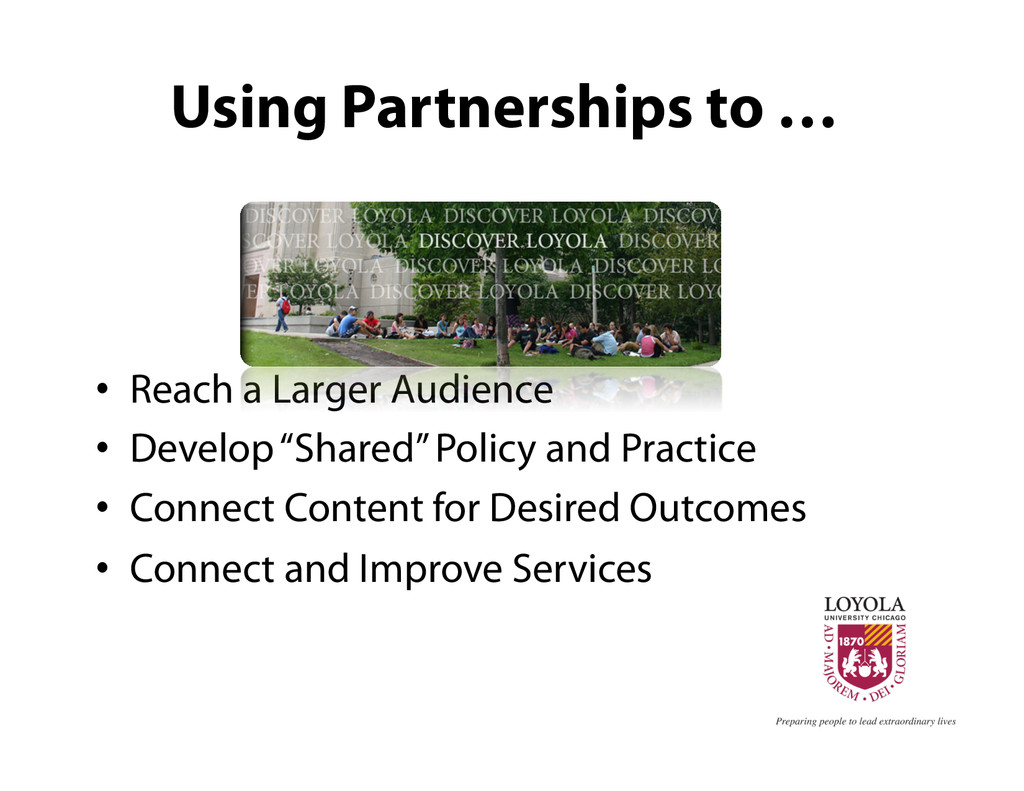
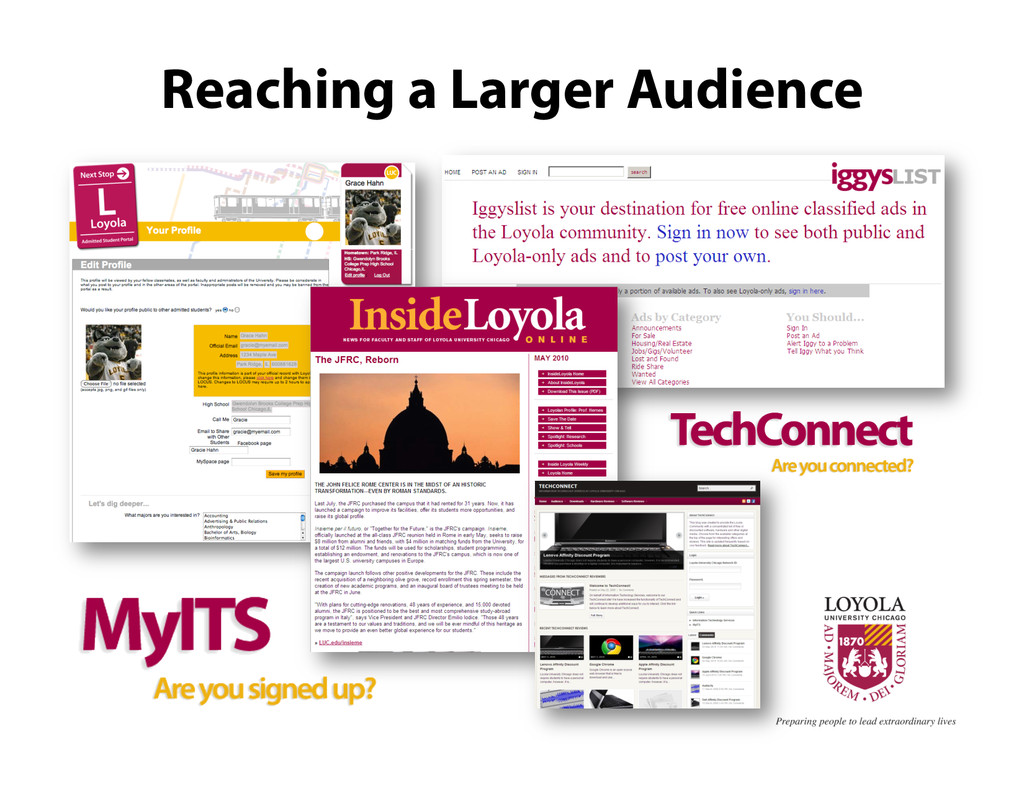
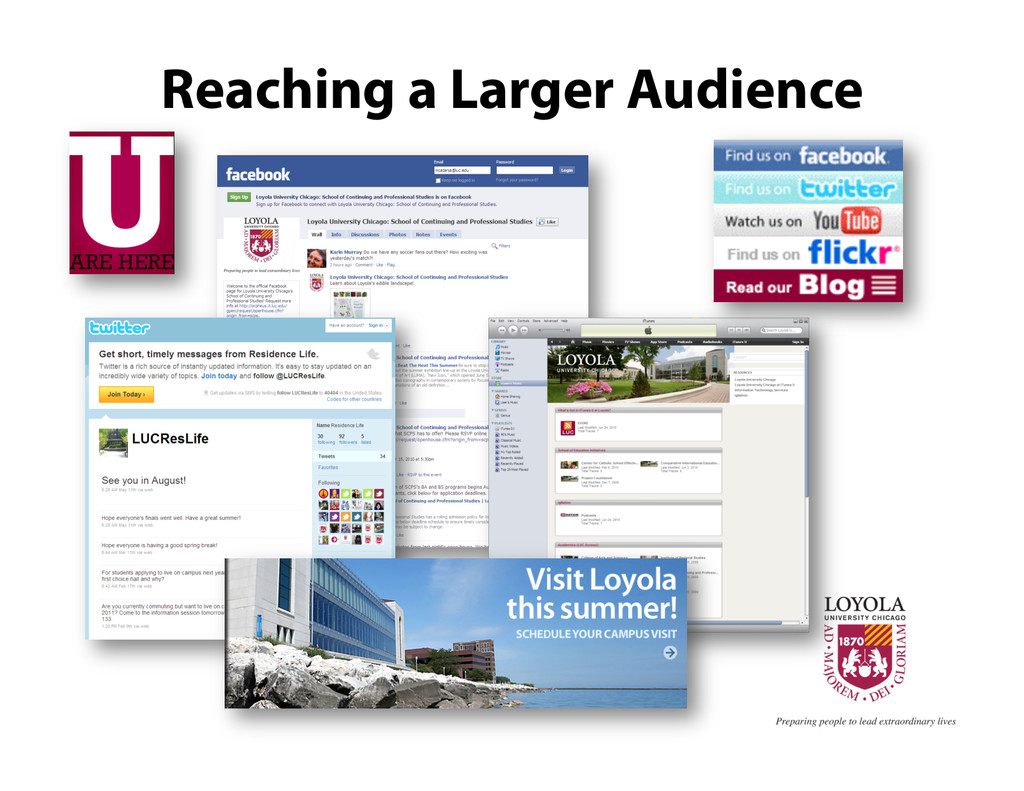
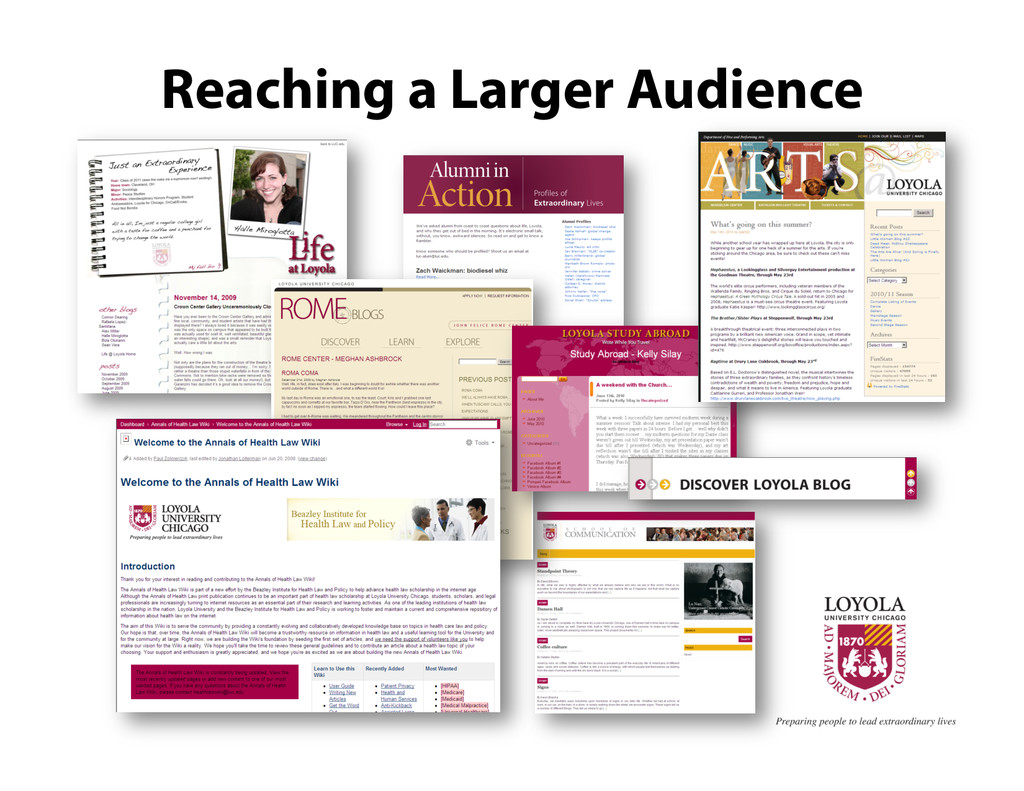
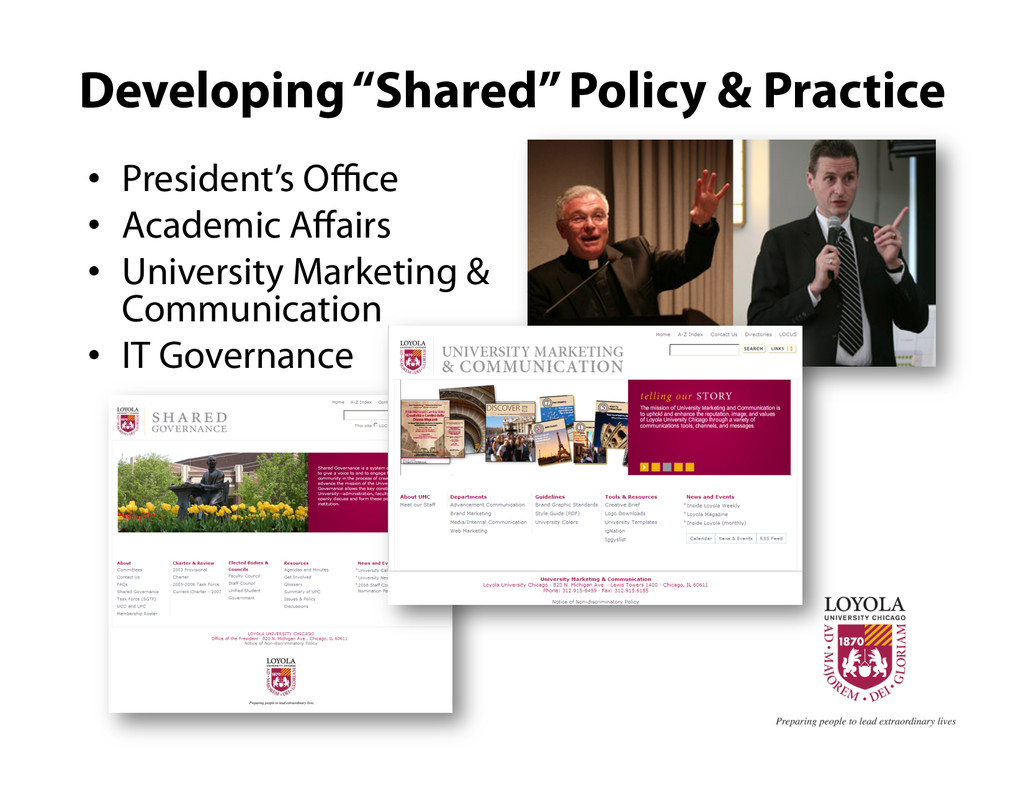
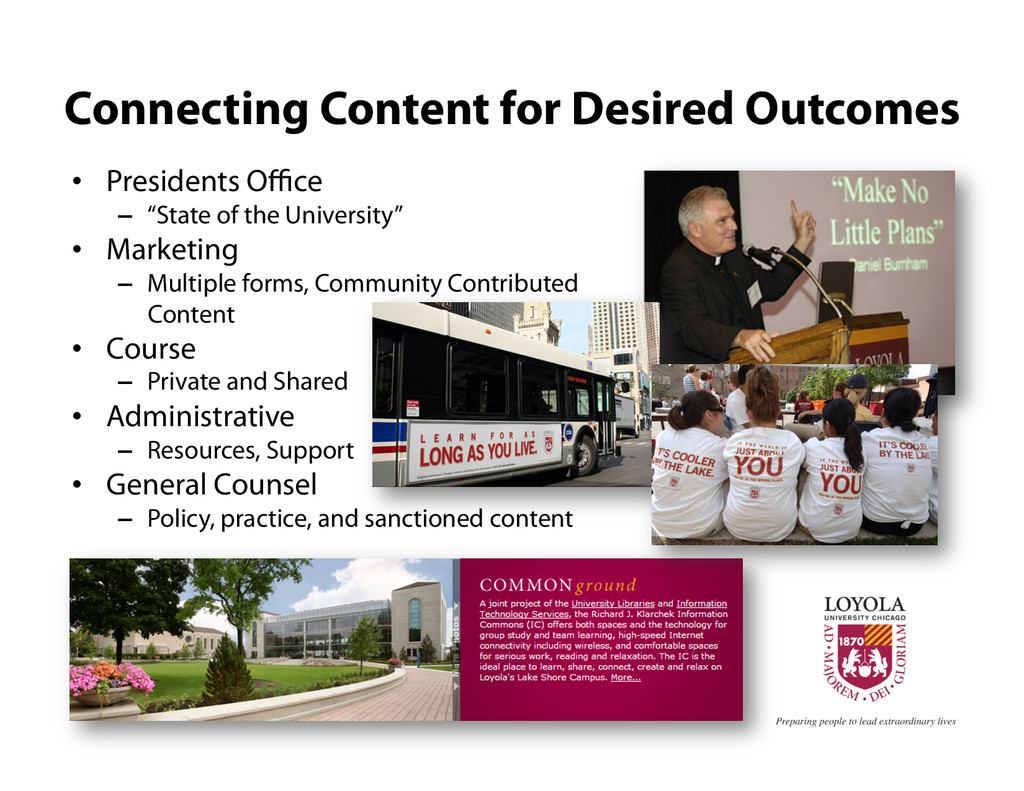
Web 2.0 has created new channels for university communities to connect. User-generated content from diverse populations presented an opportunity to extend the voice of the university to all students, faculty and staff. Academics, Marketing, and IT partnered to provide a system of self-managed services. This session will highlight how Loyola utilized third-party and home-grown solutions at the University. Technologies highlighted will include Flash video, iTunesU, Blackboard, blogs, and wikis.

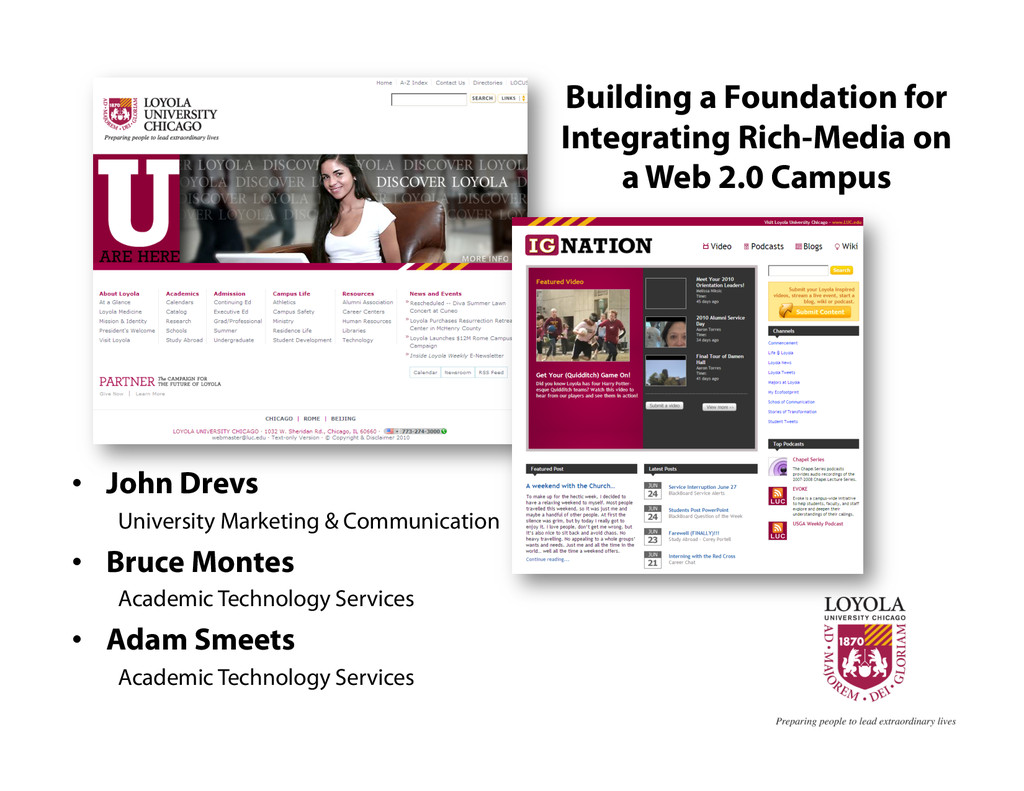
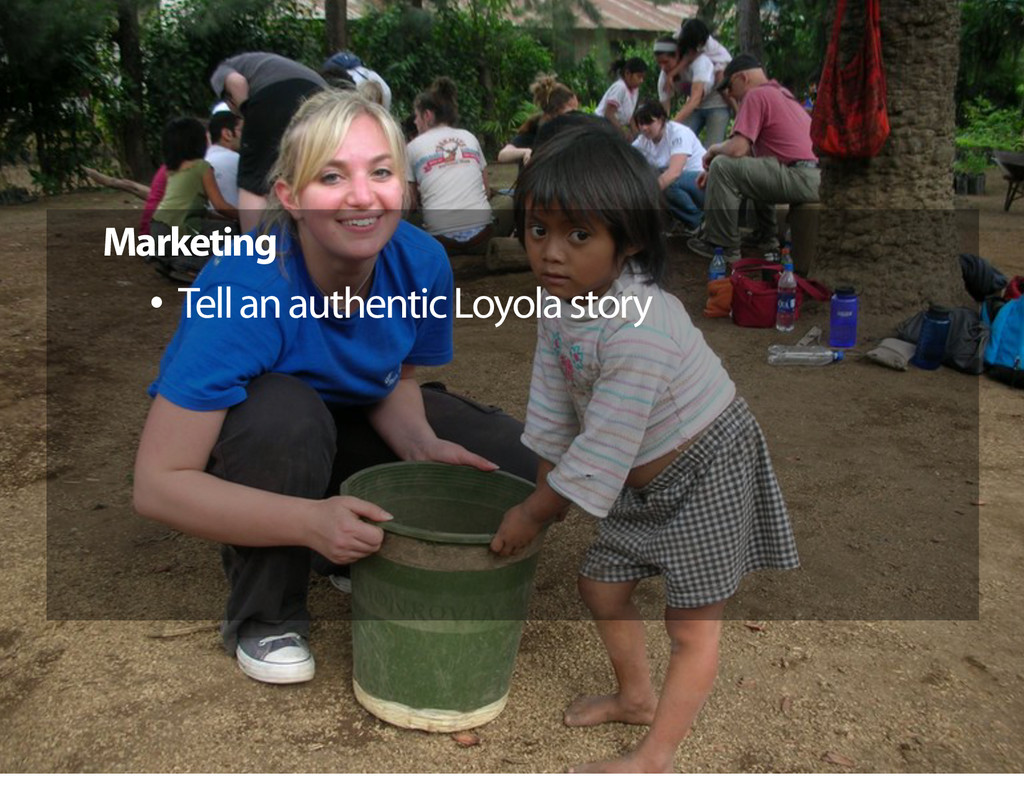
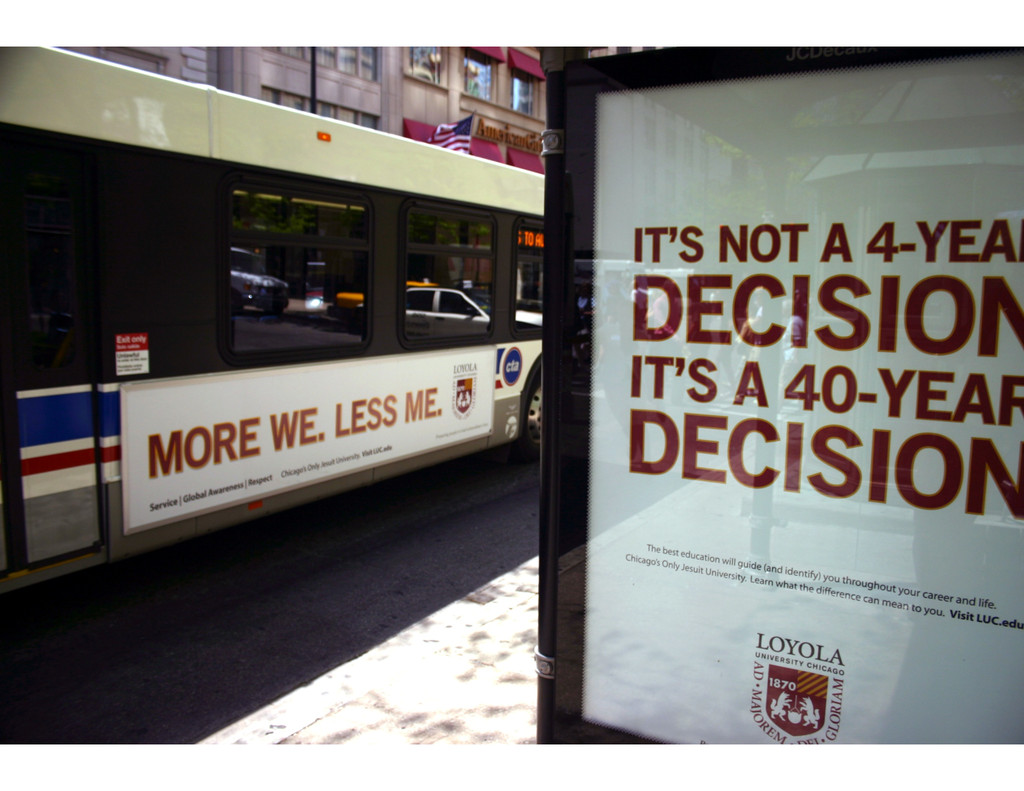
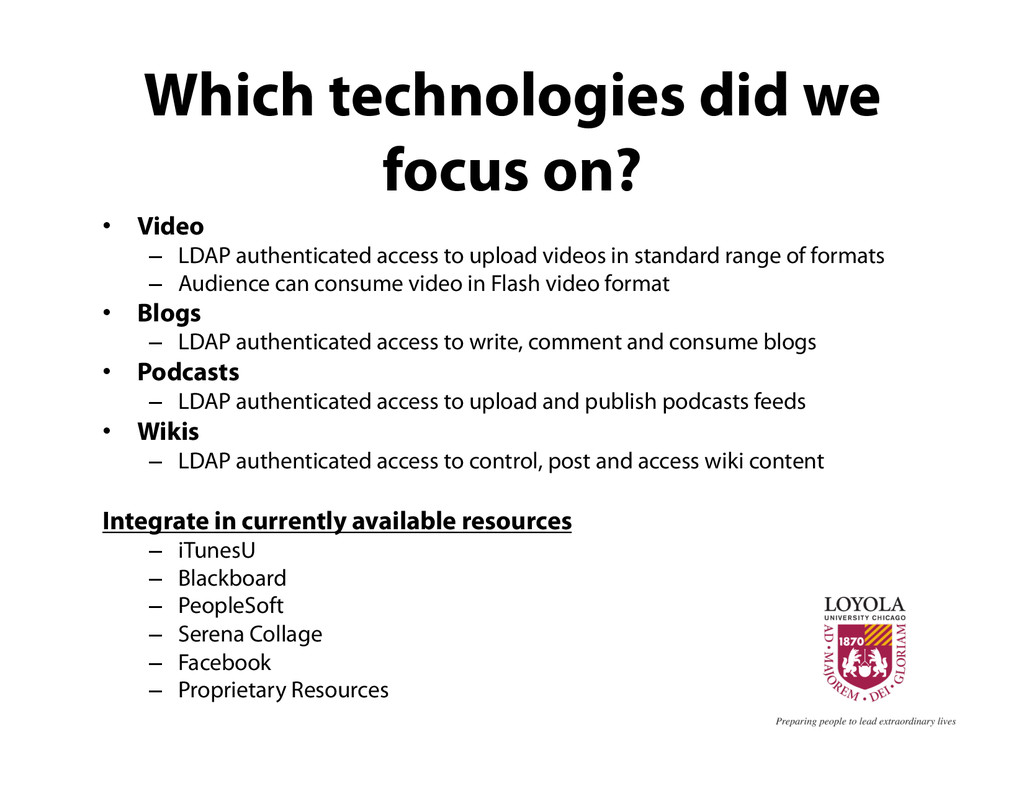
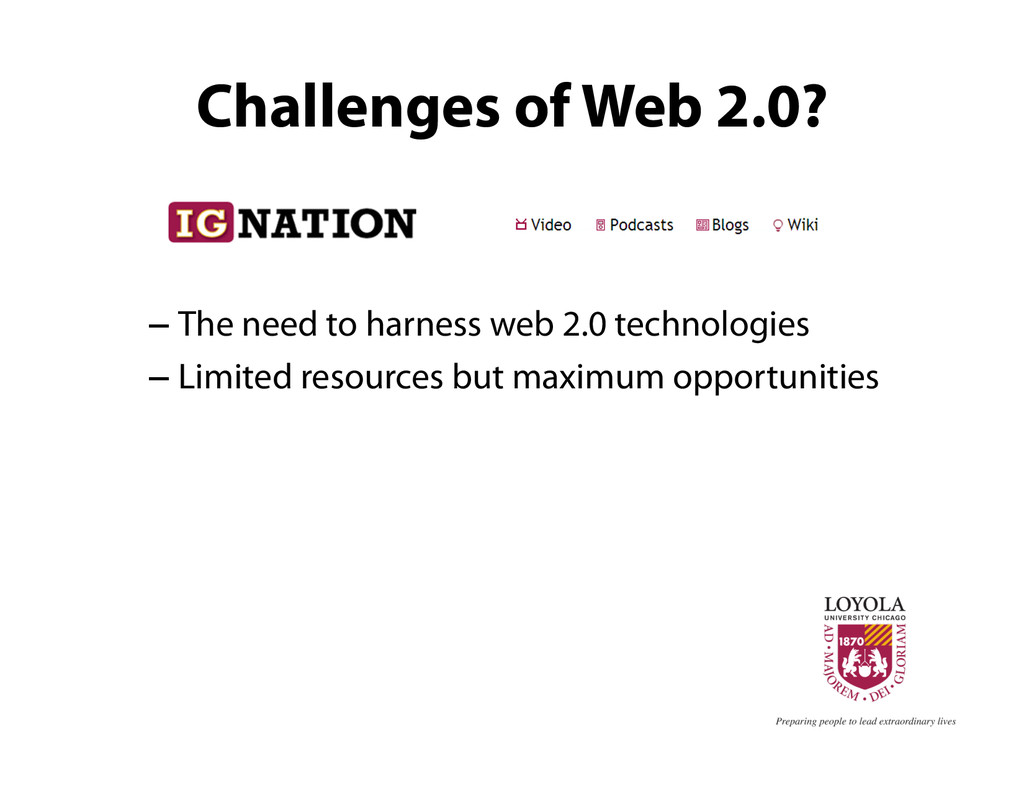
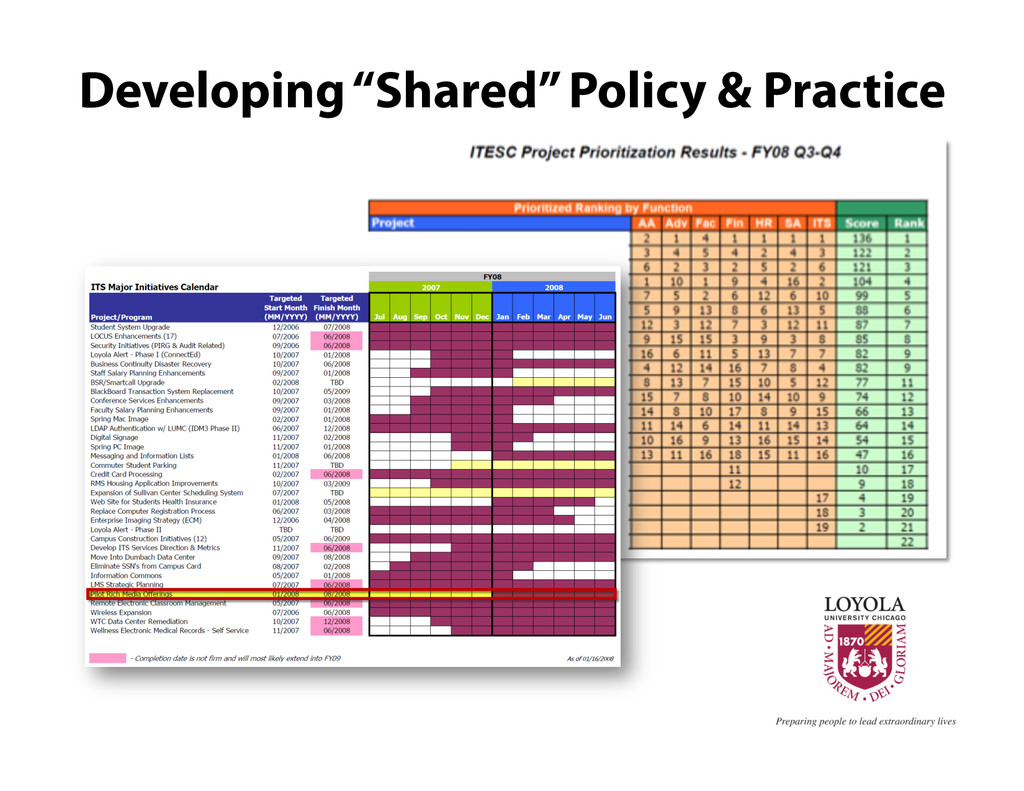
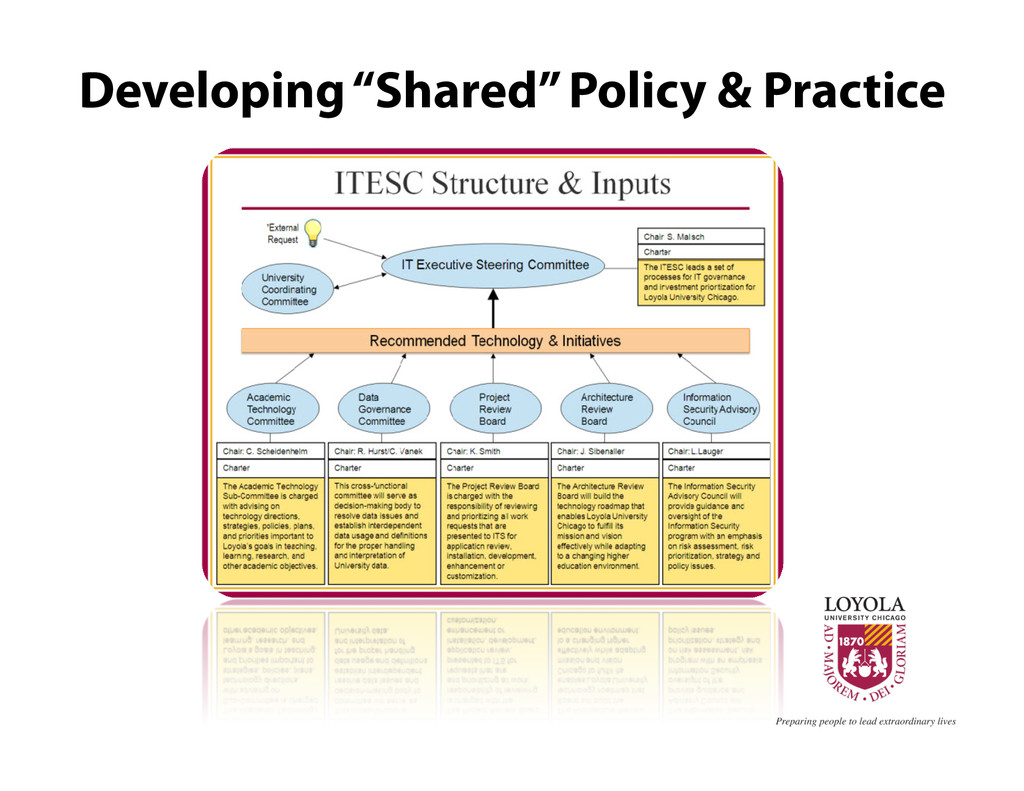
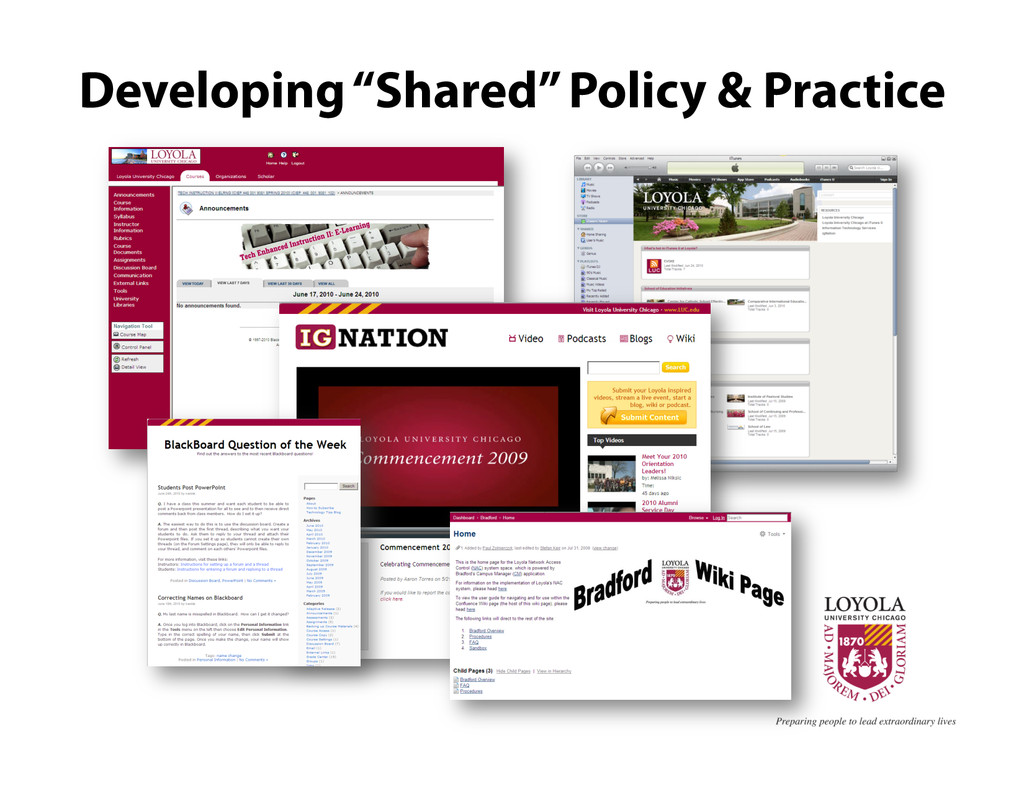
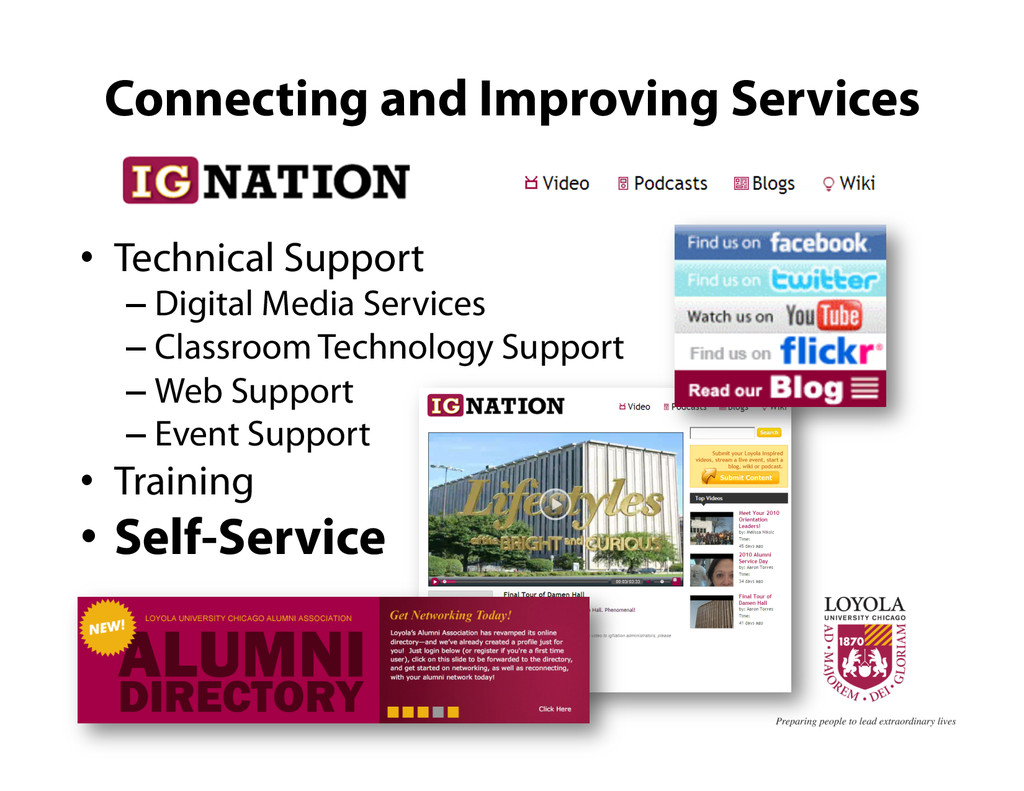
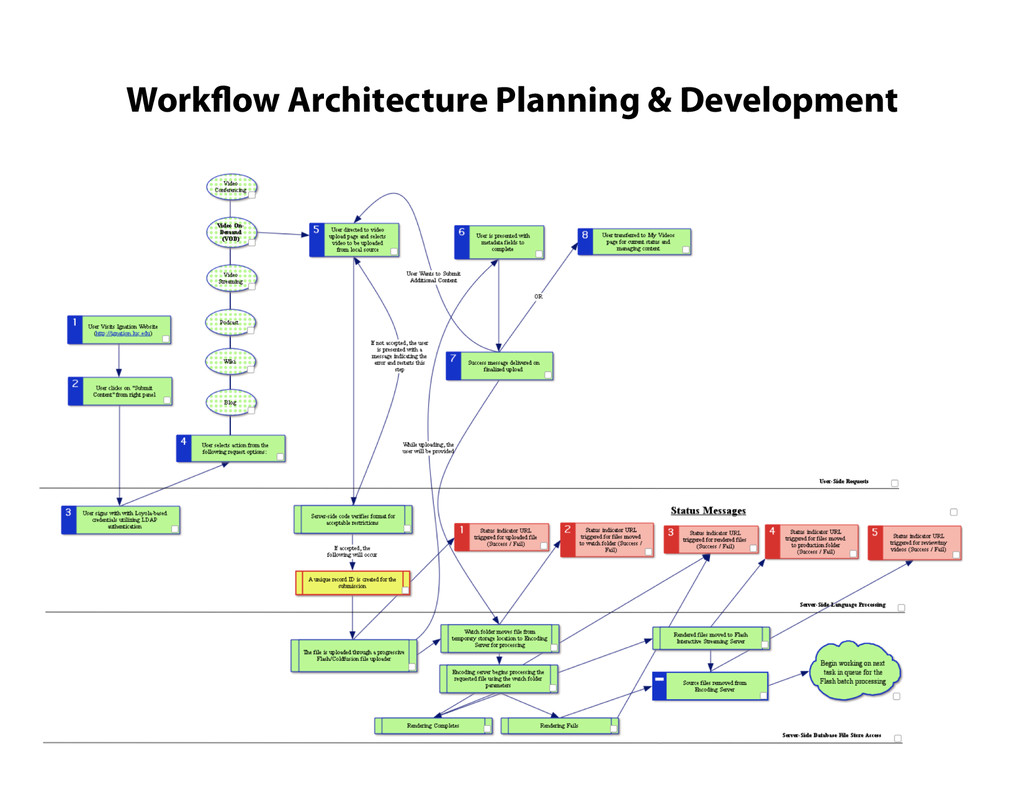
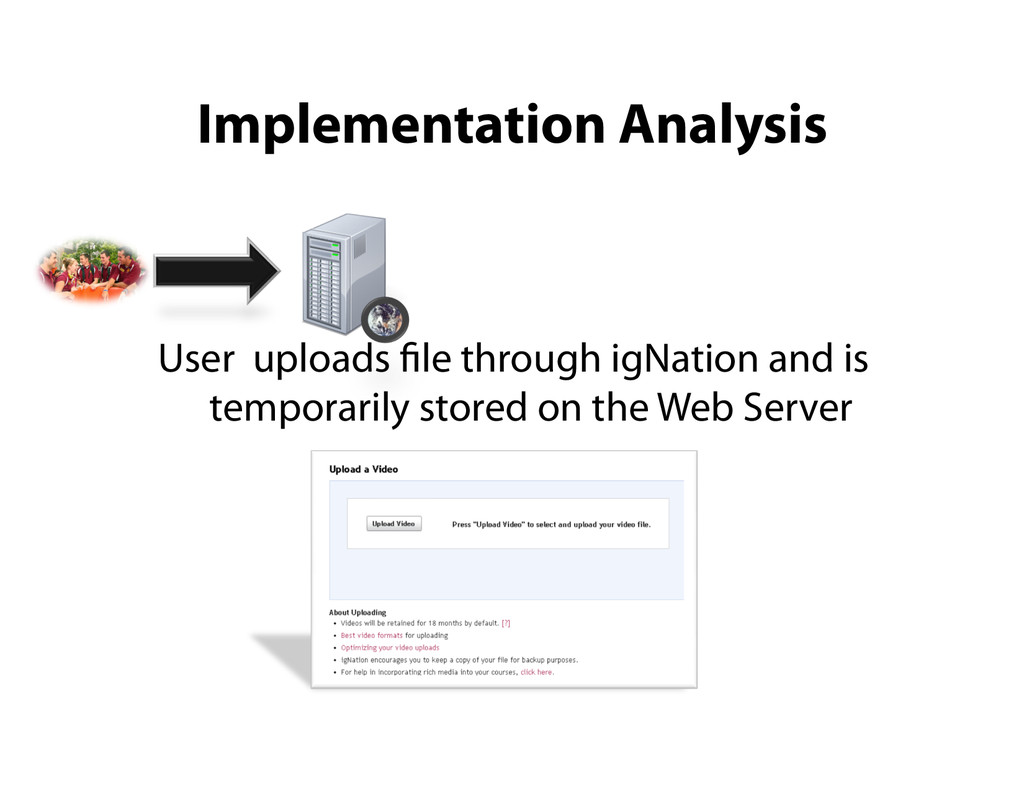
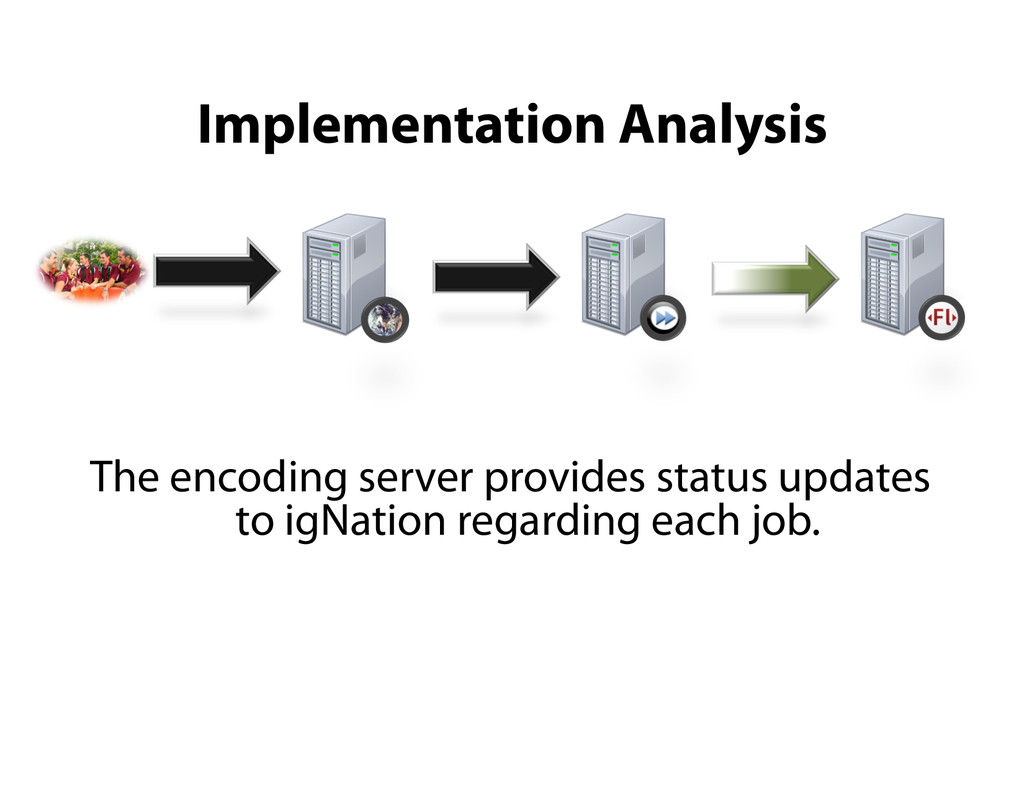
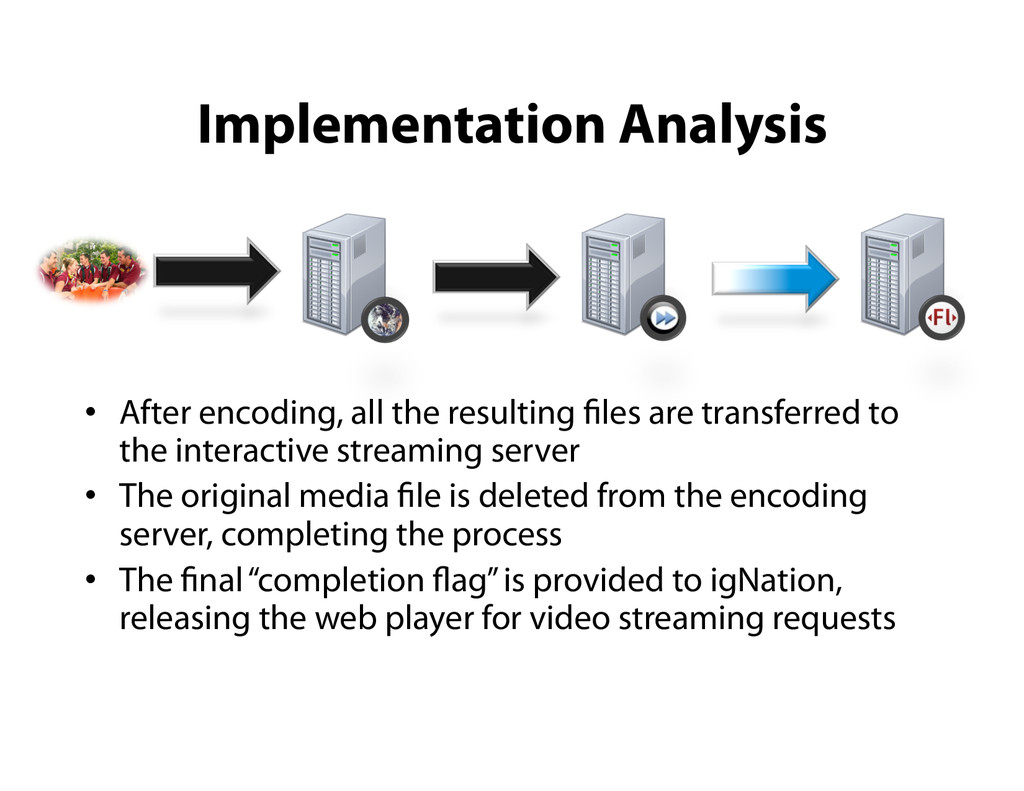
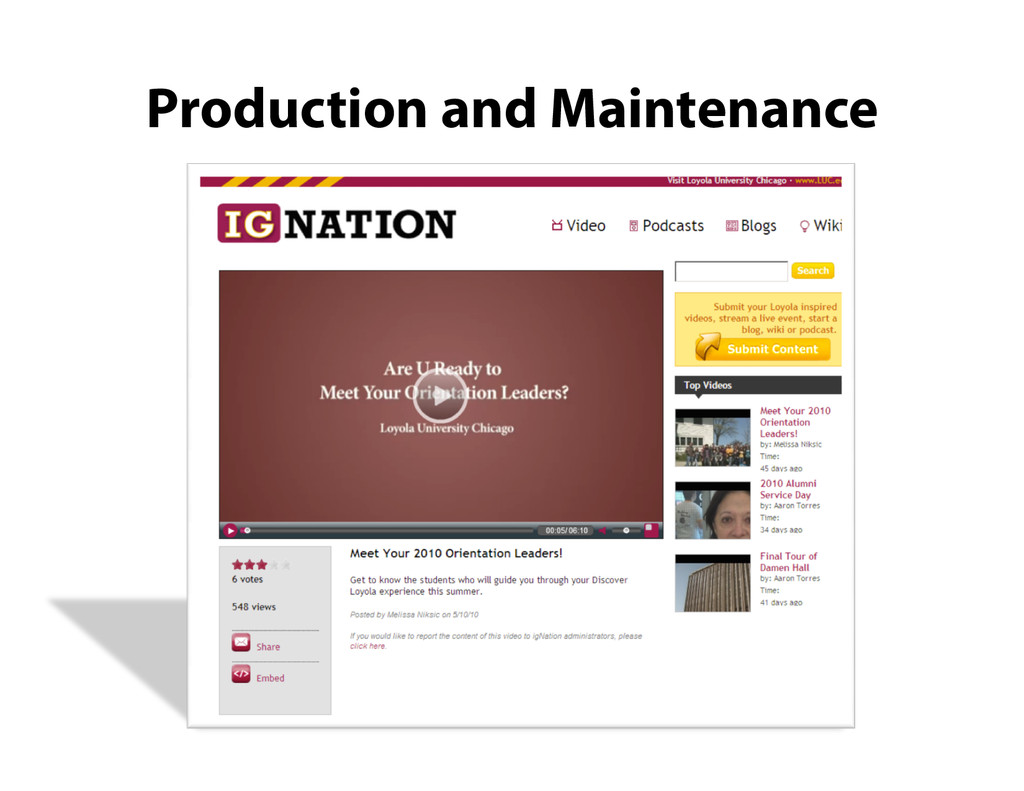
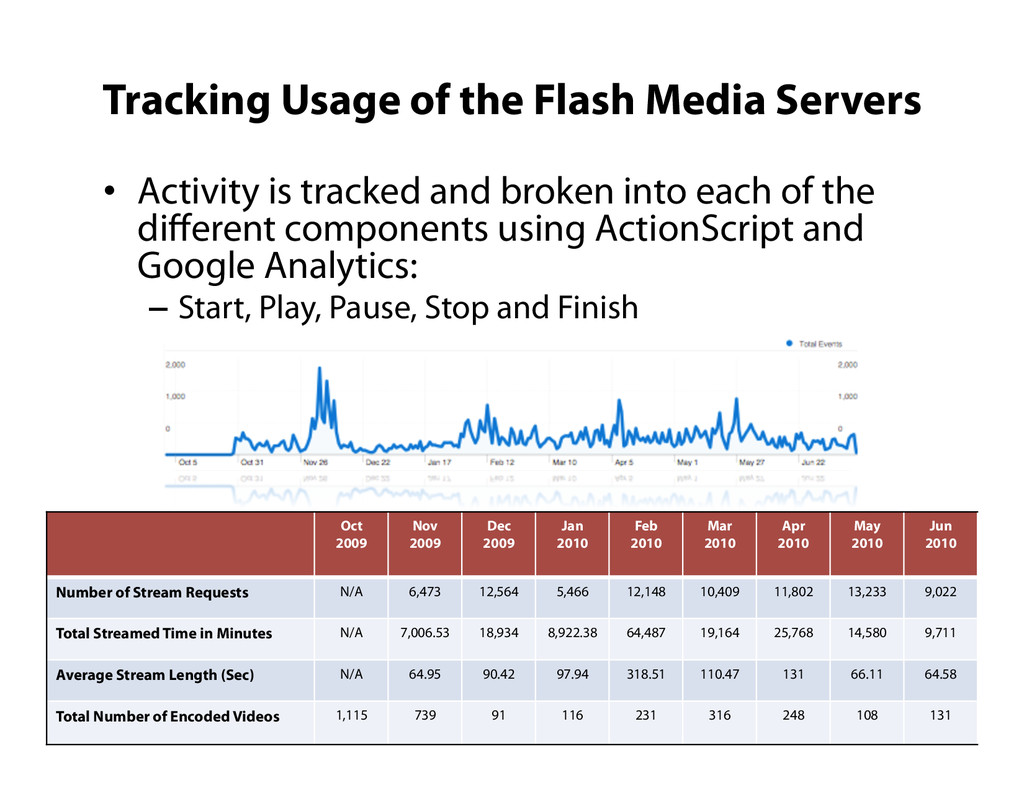
The presentation focused on how Loyola developed and implemented the “Ignation” system whereby students, faculty, and staff could create, upload, and manage rich-media. Media such as Blogs, Wikis, Podcasts, and Videos can be sent to a central repository where users can self-manage their content and get the Loyola brand around their content to help tell an authentic “Loyola Story.”

Adam Smeets

July 26, 2010
Tweet

More Decks by Adam Smeets

Other Decks in Education

Transcript

  1. Building a Foundation for Integrating Rich-Media on a Web 2.0

    Campus July 27, 2010 8:30 - 9:30 Join us online during this session at: https://connect.luc.edu/eduweb
  2. •  John Drevs University Marketing & Communication •  Bruce Montes

    Academic Technology Services •  Adam Smeets Academic Technology Services Building a Foundation for Integrating Rich-Media on a Web 2.0 Campus
  3. •  One of 28 Jesuit Colleges and Universities in the

    U.S. •  3 Campuses in Chicago with Centers in Rome and Beijing •  15,000 Total Enrollment •  25% of Students Live on Campus •  650+ Faculty •  1,500+ Staff •  71 Undergraduate Majors and 71 Minors •  85 Master's, 31 Doctoral Degrees, and 26 Graduate-level Certi cate Programs •  13:1 Student/Faculty Ratio •  3,400+ Courses Per Semester with 57% Utilizing Course Management System •  300+ Technology Equipped Classrooms and Conference Spaces •  2,200+ Workstations with 40% in Public Computing Spaces •  120,000 Alumni; 80,000 in Chicago Loyola University Chicago
  4. Session Objectives •  Session Goals –  Overview our challenges and

    problems related to digital media at Loyola; –  Identify academic and administrative needs; –  Review one of our implemented solutions from concept to implementation; and –  Provide recommendations for your own planning. •  Questions and Answers –  Please hold all questions until the end of the presentation or enter them in our online meeting space
  5. Marketing •  Tell an authentic Loyola story •  Extend the

    voice of the university to all students, faculty and staff. •  Reach our audience where they already are •  Create channels and therefore relationships
  6. Teaching – Engage students in a medium where they are comfortable

    dialoging – Open a two way communication ow – Give students an opportunity to participate in the teaching process – Peer to Peer Communication
  7. Which technologies did we focus on? •  Video –  LDAP

    authenticated access to upload videos in standard range of formats –  Audience can consume video in Flash video format •  Blogs –  LDAP authenticated access to write, comment and consume blogs •  Podcasts –  LDAP authenticated access to upload and publish podcasts feeds •  Wikis –  LDAP authenticated access to control, post and access wiki content Integrate in currently available resources –  iTunesU –  Blackboard –  PeopleSoft –  Serena Collage –  Facebook –  Proprietary Resources
  8. Challenges of Web 2.0? – The need to harness web 2.0

    technologies – Limited resources but maximum opportunities
  9. Using Partnerships to … •  Reach a Larger Audience • 

    Develop “Shared” Policy and Practice •  Connect Content for Desired Outcomes •  Connect and Improve Services
  10. Developing “Shared” Policy & Practice •  President’s Office •  Academic

    Affairs •  University Marketing & Communication •  IT Governance
  11. •  President’s Cabinet •  IT Executive Steering Committee •  Academic

    Technologies Committee •  Program Review Board •  Data Governance Committee •  Information Security Advisory Council Developing “Shared” Policy & Practice
  12. Connecting Content for Desired Outcomes •  Presidents Office –  “State

    of the University” •  Marketing –  Multiple forms, Community Contributed Content •  Course –  Private and Shared •  Administrative –  Resources, Support •  General Counsel –  Policy, practice, and sanctioned content
  13. Connecting and Improving Services •  Technical Support – Digital Media Services

    – Classroom Technology Support – Web Support – Event Support •  Training •  Self-Service
  14. •  Transition from a large workgroup to sub- workgroups with

    subject- matter experts (SMA’s) •  Use of a Work ow and Project Management Structure Identifying a Solution
  15. Goal: Determine Assumptions and needs –  What hardware and software

    constraints need to be considered? –  What restrictions need to be made against le content? –  What is the current architecture/landscape? –  What nancial resources are available to fund (if any) the project? Needs Assessment
  16. Needs Assessment Findings •  Testing our Current Environment – Bandwidth and

    Infrastructure Results (BW/s) Bandwidth (in mbps) (N) Number of Subscribers (S) Average Bitrate of Encoded A/V Content (in kbps) Comparative Quality 24.8 50 Connected Clients 496 Web Video Conferencing 44.8 50 Connected Clients 896 | 66.4 50 Connected Clients 1328 VCD 90 50 Connected Clients 1800 SD Video 120 50 Connected Clients 2400 | 160 50 Connected Clients 3200 | 208 50 Connected Clients 4160 Near DVD Video
  17. Product Research and Considerations •  Reviewed institutional implementations and market

    trends for solutions  Mobile Devices  Minimal Software Needs for End-Users  Minimal Financial Impact  Repository Needs •  Narrowed our pool of software to determine the “best- t” for Loyola University Chicago –  Included open-source, home-grown and commercial options
  18. Testing of Candidates •  Each software and hardware application was

    tested in a virtual machine environment Figure 1 - Video Repository Content Variations •  Tested for a number of factors: –  Server load –  Client software requirements –  Client mobile user device potential –  Ease of Administration –  Reliability
  19. Selection of Environment •  WMV, AVI and MOV were the

    accepted versions for movie submission –  GOAL: More inclusive for universal content ingestion and consumption –  GOAL: Accept a variety of upload formats •  Involved a variety of manual processes and procedures –  GOAL: Reduce the current procedures to maintain the environment •  Distribute video in a uni ed approach - without requiring special installations/software –  GOAL: More inclusive for universal content ingestion and consumption –  GOAL: Cut down on the overall le size/storage on media server(s) Transition from WMS to FMS
  20. Server Infrastructure •  Web Server –  Temporarily stores les submitted

    from igNation until moved to the encoding server •  Encoding Server –  Converts video submissions from a variety of formats into encoded and encrypted F4V les and JPG stills •  Interactive Streaming Server –  Dynamically streams content to web viewers using handshaking at 4160kbps, 1328kbps, 896kbps, or 496kbps. –  Provides SWF les encoded for play and comparison against the server
  21. •  Every ve minutes a job is scheduled to transfer

    any les that are present in the media directory to the encoding server •  Custom “jobs” created: –  4 Custom F4V les –  1 Set of JPEG slides at 5 second increments for the rst 25 seconds of the video Implementation Analysis
  22. •  After encoding, all the resulting les are transferred to

    the interactive streaming server •  The original media le is deleted from the encoding server, completing the process •  The nal “completion ag” is provided to igNation, releasing the web player for video streaming requests Implementation Analysis
  23. Testing •  Concurrent connection tests –  GOAL: Ensure stability with

    a large user population •  Multiple video format conversions –  GOAL: Ensure compatibility with the formats currently stored, and increasing the available upload options. •  Security of player and multimedia content –  GOAL: Ensure that content cannot be easily harvested •  Usability –  GOAL: Ensure that the system is easy to operate from an end-user perspective
  24. Testimonials and Lessons Learned •  Copyright and ownership of media

    are key conversations with stakeholders •  Often buried in policy discussions before deployment •  Test, test, test, test, and then… more testing •  Training and support staff to manage the application can be time consuming •  Collaboration is key in developing a great solution!
  25. Future of igNation, Next Steps •  Improvements to our Flash

    player •  Increased support for mobile devices •  Live streaming •  Upgrade our encoding server with support for additional plug-ins •  Live Web Conferencing
  26. •  Activity is tracked and broken into each of the

    different components using ActionScript and Google Analytics: –  Start, Play, Pause, Stop and Finish Oct 2009 Nov 2009 Dec 2009 Jan 2010 Feb 2010 Mar 2010 Apr 2010 May 2010 Jun 2010 Number of Stream Requests N/A 6,473 12,564 5,466 12,148 10,409 11,802 13,233 9,022 Total Streamed Time in Minutes N/A 7,006.53 18,934 8,922.38 64,487 19,164 25,768 14,580 9,711 Average Stream Length (Sec) N/A 64.95 90.42 97.94 318.51 110.47 131 66.11 64.58 Total Number of Encoded Videos 1,115 739 91 116 231 316 248 108 131 Tracking Usage of the Flash Media Servers
  27. y = 11.972x + 2107.9 0 1000 2000 3000 4000

    5000 6000 7000 Number of Stream Requests Time Range from October 30, 2009 to July 9, 2010 Flash Dynamic Stream Requests Flash Media Server Usage
  28. y = 2752.3x + 250813 -200000 0 200000 400000 600000

    800000 1000000 1200000 1400000 1600000 1800000 Play Time in Seconds Time Range from October 30, 2009 July 9, 2010 Flash Stream Total Viewing Time Flash Media Server Usage
  29. y = 1.9873x + 85.488 -100.00 0.00 100.00 200.00 300.00

    400.00 500.00 600.00 700.00 800.00 Play Time in Seconds Time Range from October 30, 2009 to February 19, 2010 Flash Stream Average Session Time Flash Media Server Usage
  30. •  Encourage collaboration among University •  Develop strong documentation from

    the start •  Establish milestone dates in coordination with IT and partners •  Test a variety of software applications and con gurations •  Work ow diagramming is key to staying focused •  Stay calm and don’t give up! Recommendations for Other Institutions