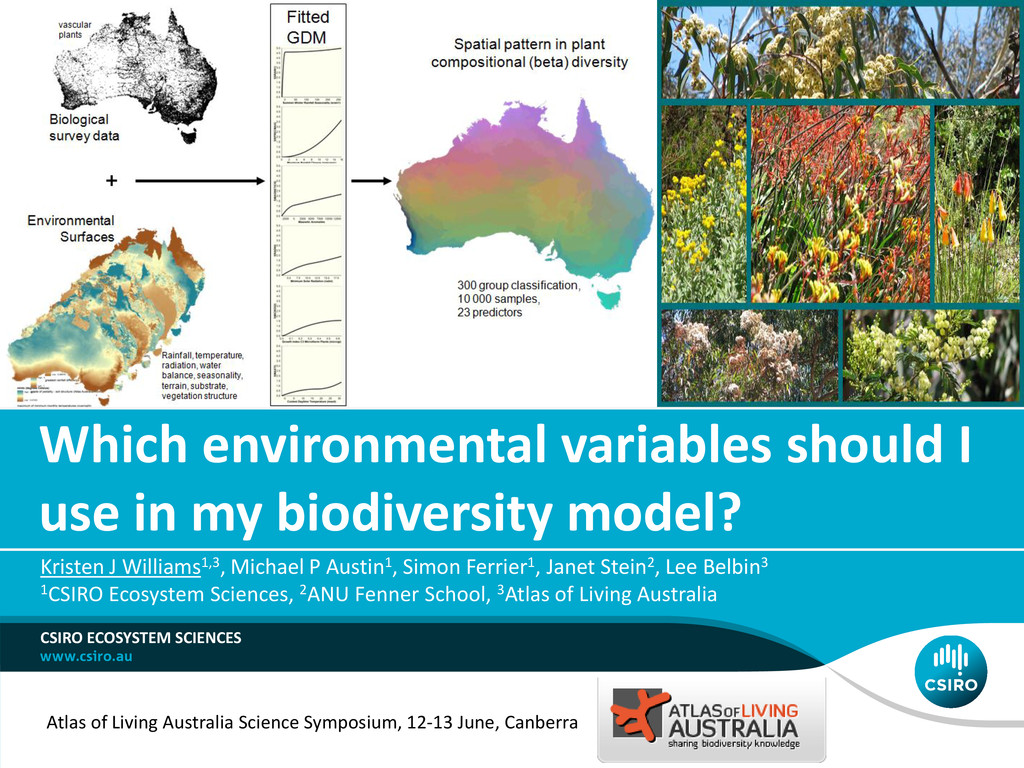
CSIRO ECOSYSTEM SCIENCES Kristen J Williams1,3, Michael P Austin1, Simon Ferrier1, Janet Stein2, Lee Belbin3 1CSIRO Ecosystem Sciences, 2ANU Fenner School, 3Atlas of Living Australia Atlas of Living Australia Science Symposium, 12-13 June, Canberra
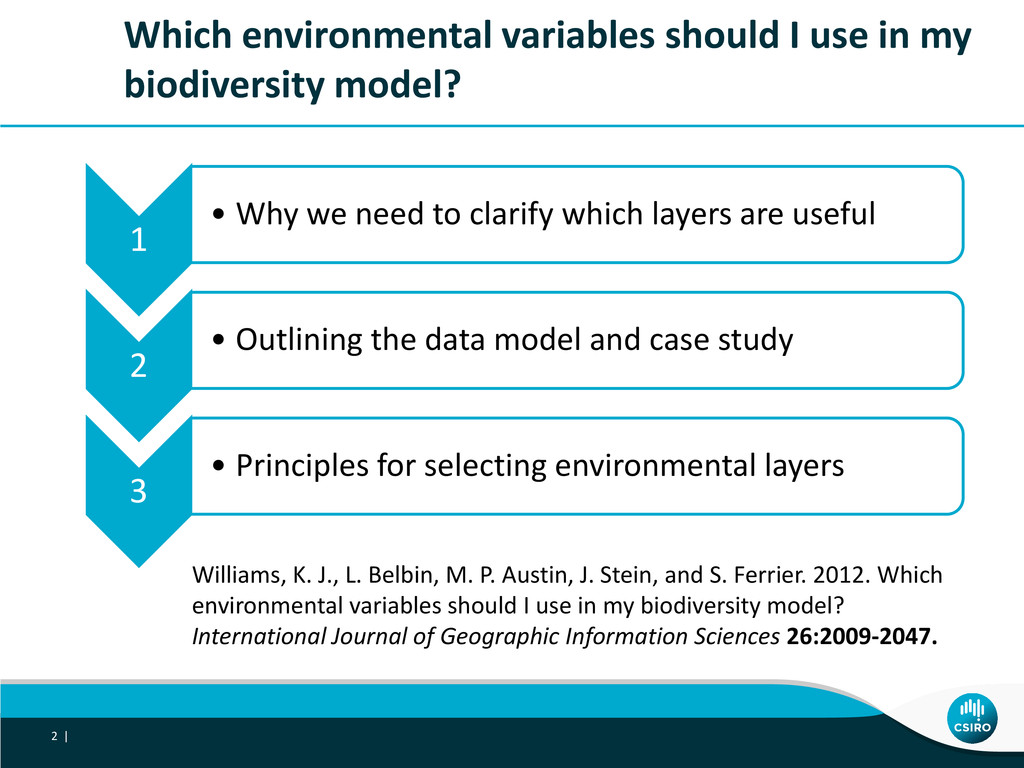
1 • Why we need to clarify which layers are useful 2 • Outlining the data model and case study 3 • Principles for selecting environmental layers 2 | Williams, K. J., L. Belbin, M. P. Austin, J. Stein, and S. Ferrier. 2012. Which environmental variables should I use in my biodiversity model? International Journal of Geographic Information Sciences 26:2009-2047.
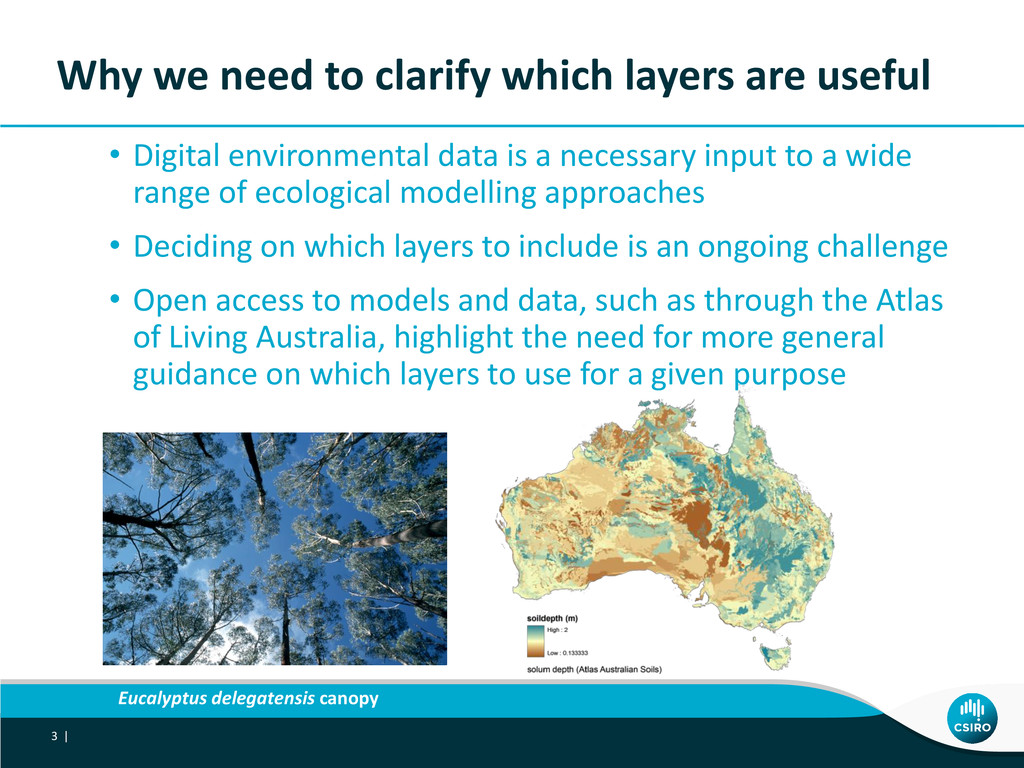
Digital environmental data is a necessary input to a wide range of ecological modelling approaches • Deciding on which layers to include is an ongoing challenge • Open access to models and data, such as through the Atlas of Living Australia, highlight the need for more general guidance on which layers to use for a given purpose Eucalyptus delegatensis canopy 3 |
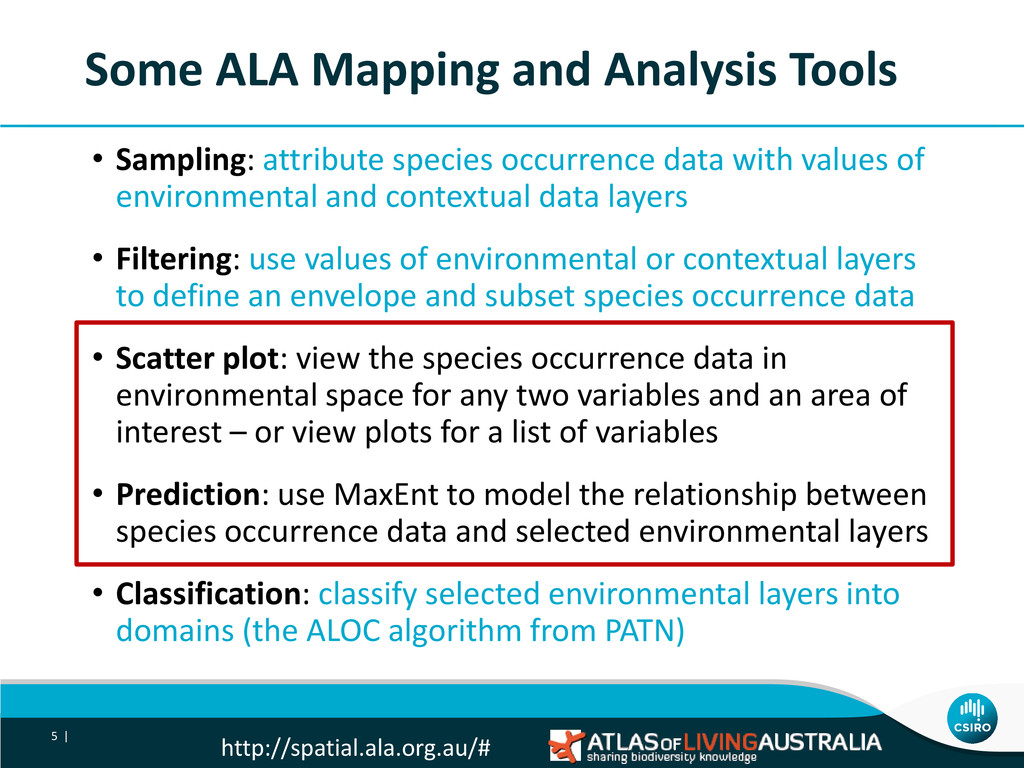
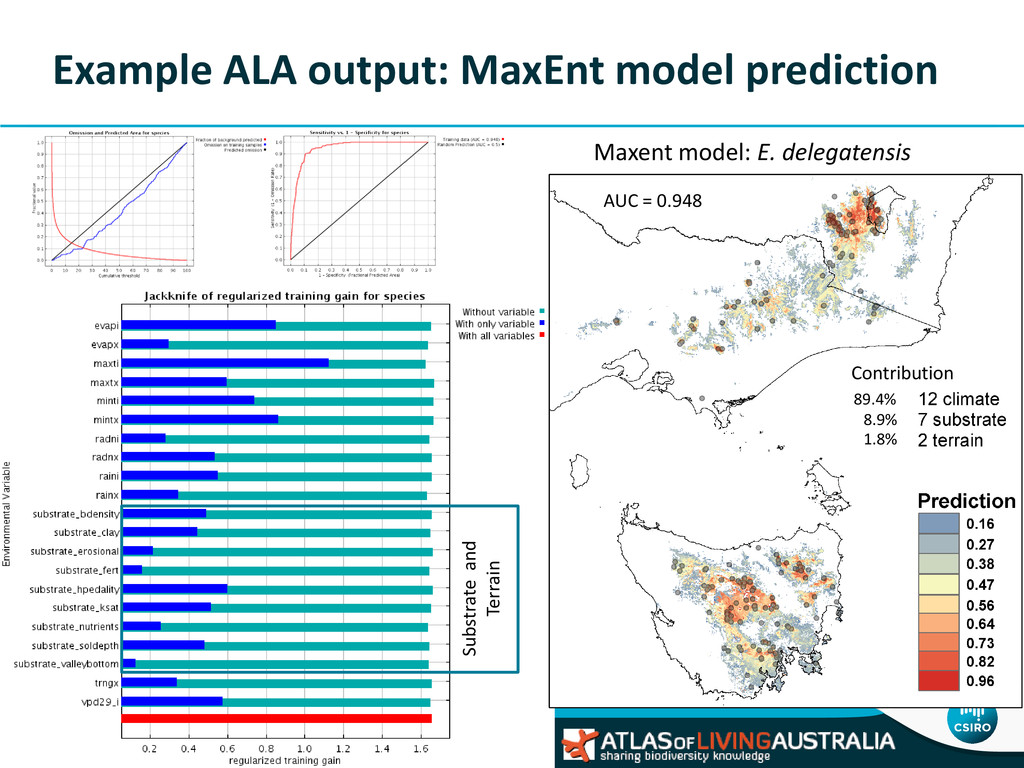
occurrence data with values of environmental and contextual data layers • Filtering: use values of environmental or contextual layers to define an envelope and subset species occurrence data • Scatter plot: view the species occurrence data in environmental space for any two variables and an area of interest – or view plots for a list of variables • Prediction: use MaxEnt to model the relationship between species occurrence data and selected environmental layers • Classification: classify selected environmental layers into domains (the ALOC algorithm from PATN) http://spatial.ala.org.au/# 5 |
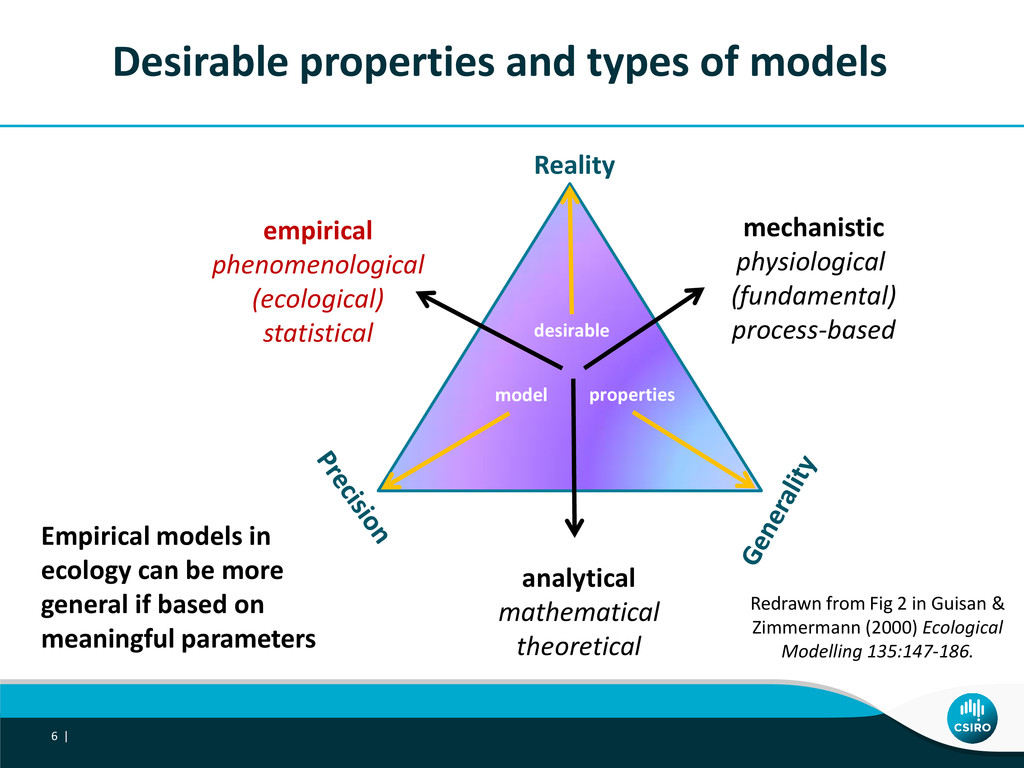
process-based empirical phenomenological (ecological) statistical analytical mathematical theoretical Redrawn from Fig 2 in Guisan & Zimmermann (2000) Ecological Modelling 135:147-186. Empirical models in ecology can be more general if based on meaningful parameters desirable model properties 6 |
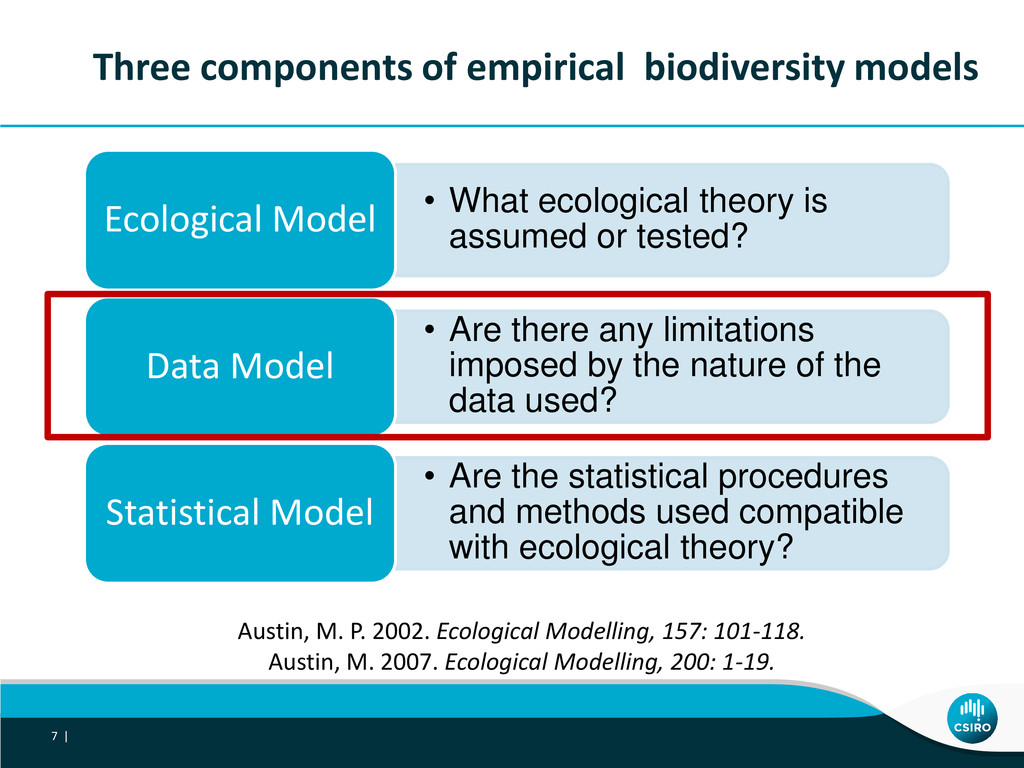
is assumed or tested? Ecological Model • Are there any limitations imposed by the nature of the data used? Data Model • Are the statistical procedures and methods used compatible with ecological theory? Statistical Model Austin, M. P. 2002. Ecological Modelling, 157: 101-118. Austin, M. 2007. Ecological Modelling, 200: 1-19. 7 |
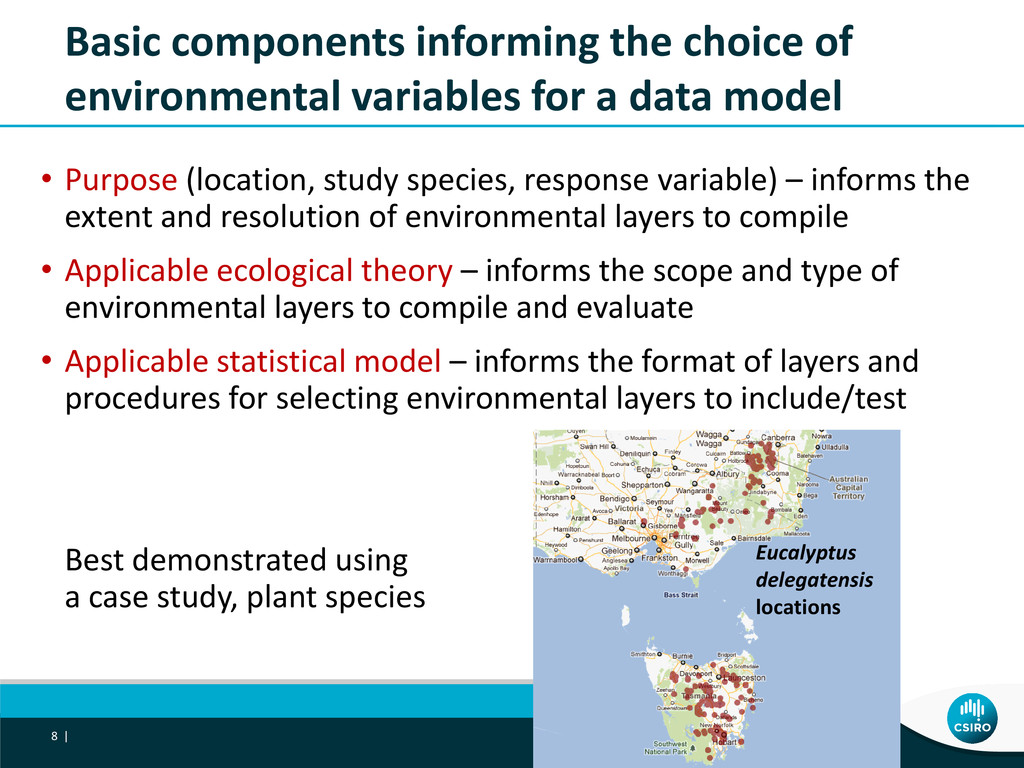
data model • Purpose (location, study species, response variable) – informs the extent and resolution of environmental layers to compile • Applicable ecological theory – informs the scope and type of environmental layers to compile and evaluate • Applicable statistical model – informs the format of layers and procedures for selecting environmental layers to include/test Best demonstrated using a case study, plant species Eucalyptus delegatensis locations 8 |
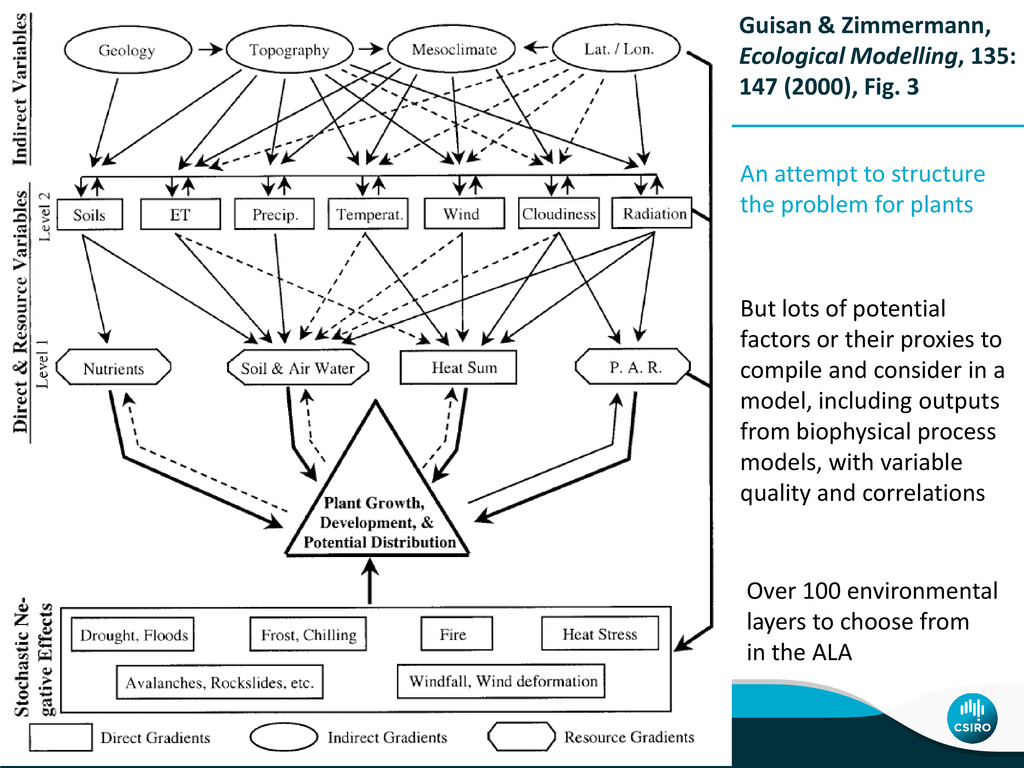
But lots of potential factors or their proxies to compile and consider in a model, including outputs from biophysical process models, with variable quality and correlations An attempt to structure the problem for plants Over 100 environmental layers to choose from in the ALA 9 |
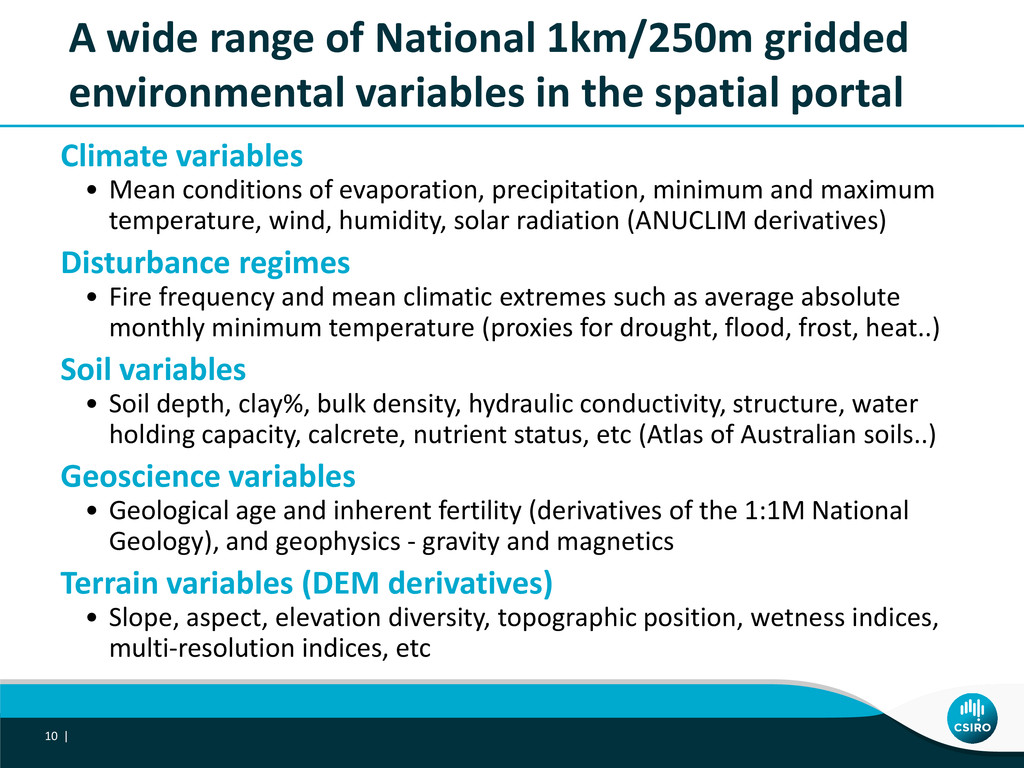
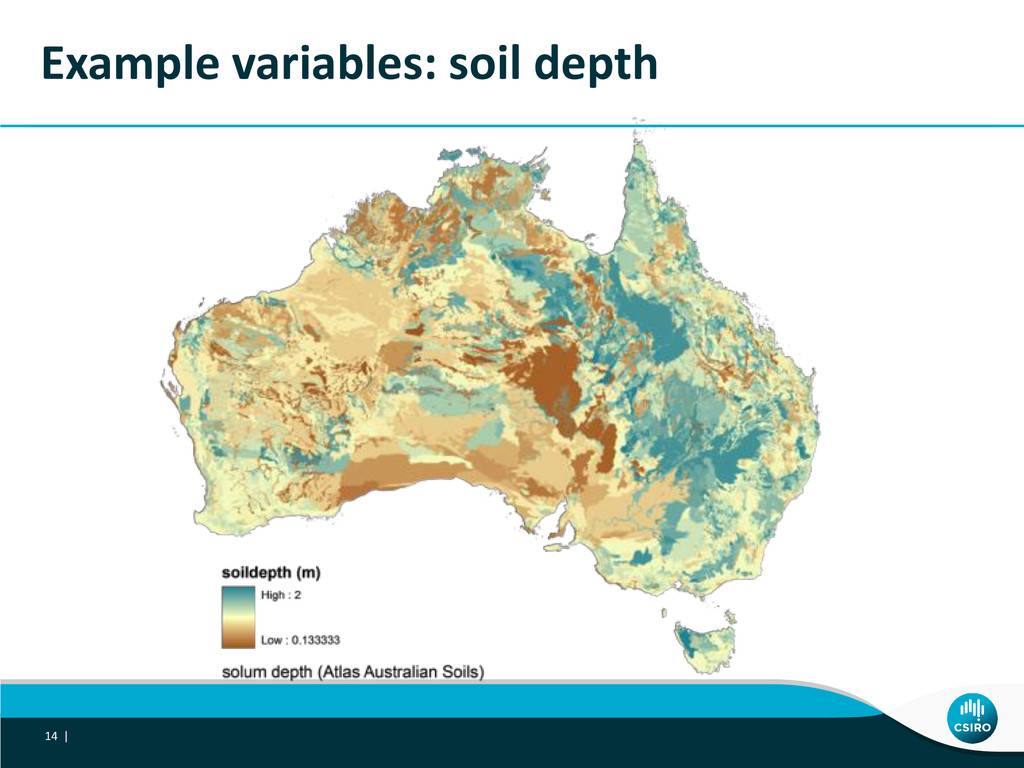
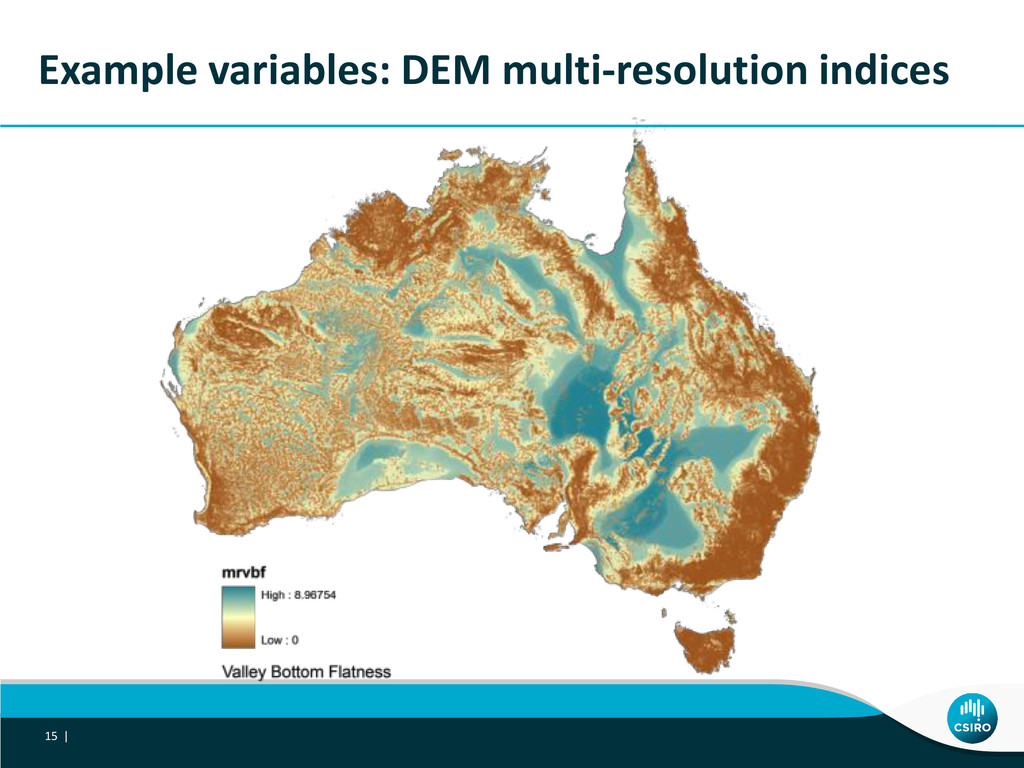
the spatial portal Climate variables • Mean conditions of evaporation, precipitation, minimum and maximum temperature, wind, humidity, solar radiation (ANUCLIM derivatives) Disturbance regimes • Fire frequency and mean climatic extremes such as average absolute monthly minimum temperature (proxies for drought, flood, frost, heat..) Soil variables • Soil depth, clay%, bulk density, hydraulic conductivity, structure, water holding capacity, calcrete, nutrient status, etc (Atlas of Australian soils..) Geoscience variables • Geological age and inherent fertility (derivatives of the 1:1M National Geology), and geophysics - gravity and magnetics Terrain variables (DEM derivatives) • Slope, aspect, elevation diversity, topographic position, wetness indices, multi-resolution indices, etc 10 |
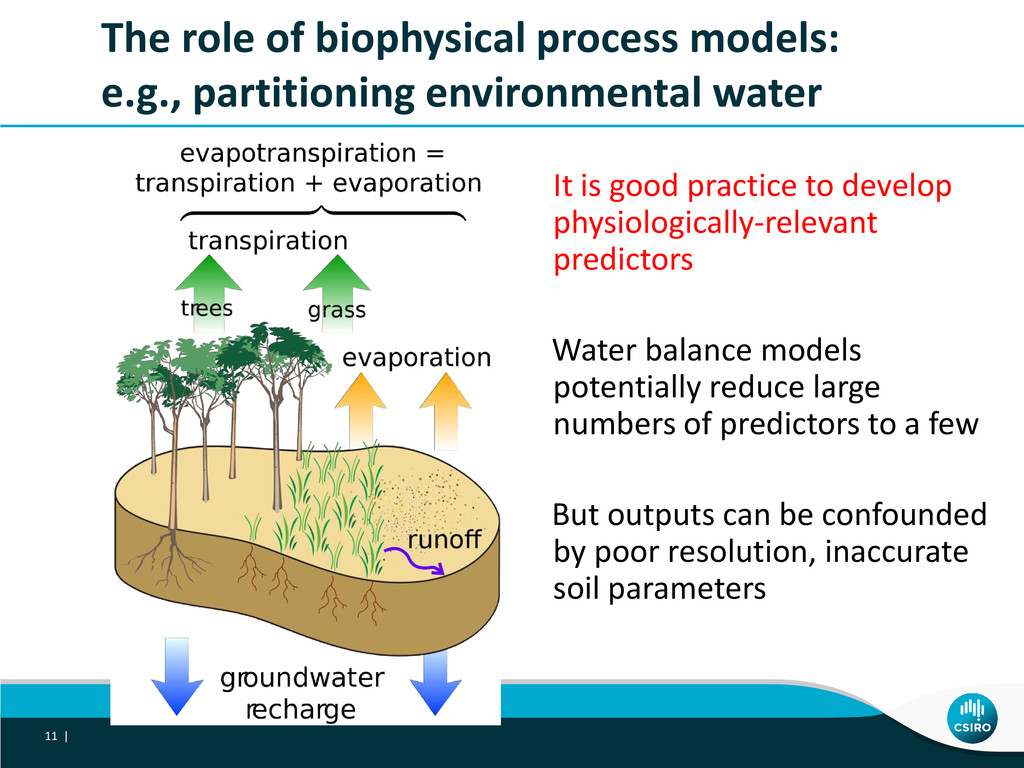
It is good practice to develop physiologically-relevant predictors Water balance models potentially reduce large numbers of predictors to a few But outputs can be confounded by poor resolution, inaccurate soil parameters 11 |
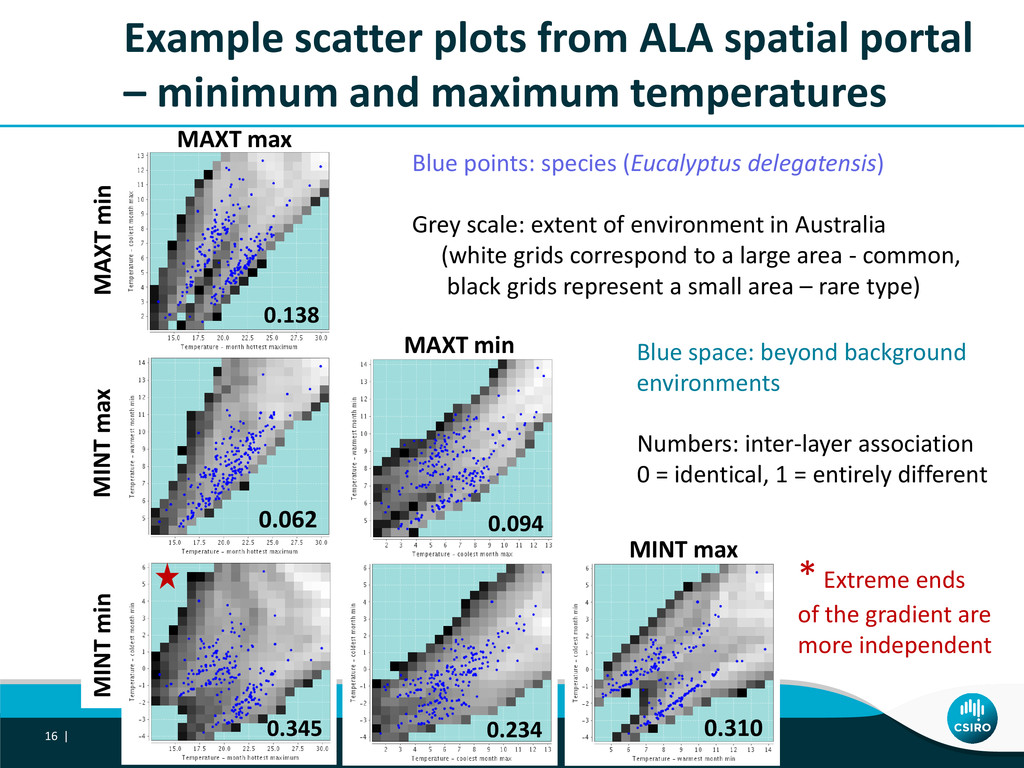
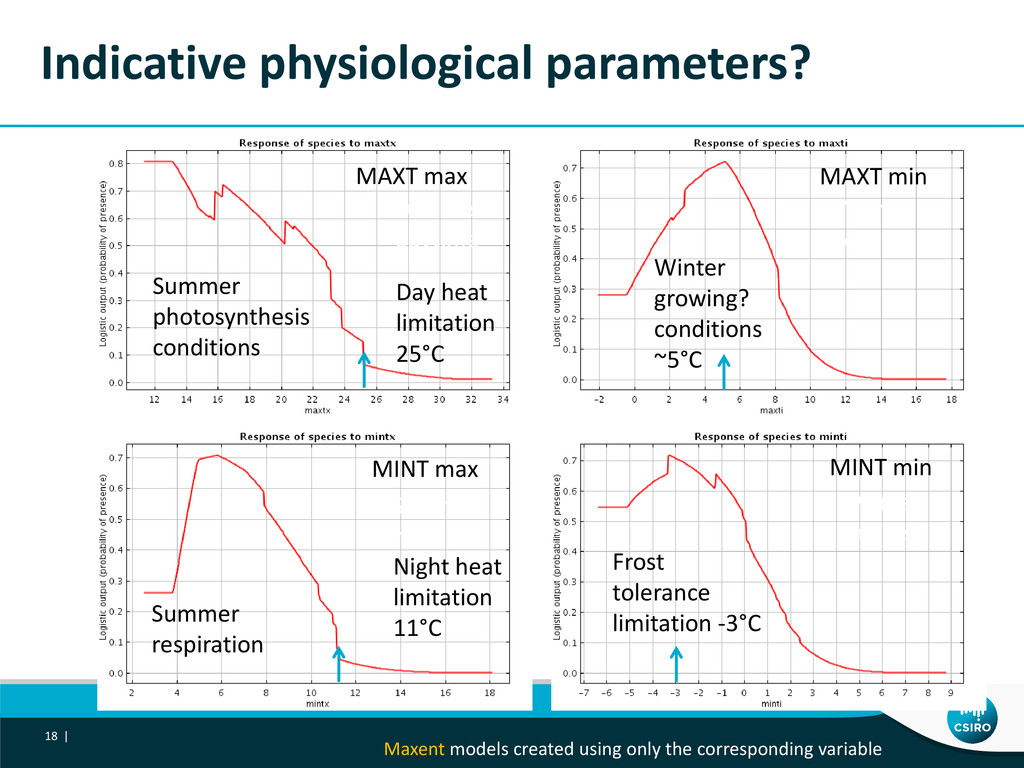
minimum and maximum temperatures CSIRO. Informing data models in ecology MINT max MINT min MAXT min MAXT min MINT max Blue points: species (Eucalyptus delegatensis) Grey scale: extent of environment in Australia (white grids correspond to a large area - common, black grids represent a small area – rare type) Blue space: beyond background environments * Extreme ends of the gradient are more independent 0.234 0.094 0.345 0.062 0.310 Numbers: inter-layer association 0 = identical, 1 = entirely different 16 | 0.138
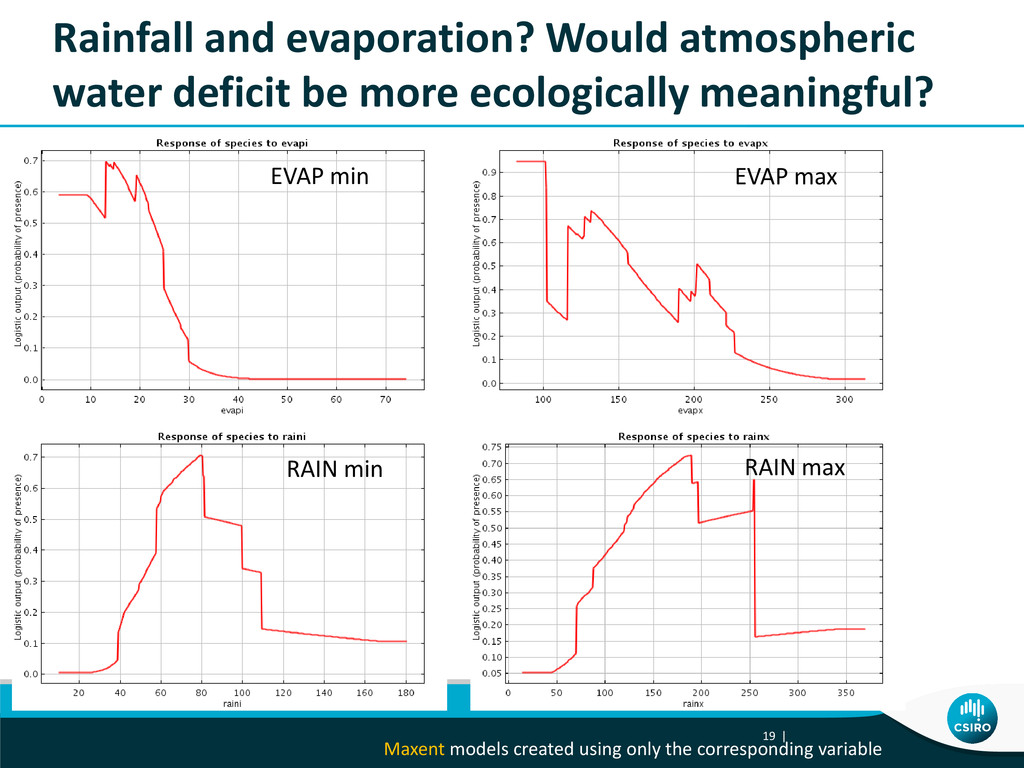
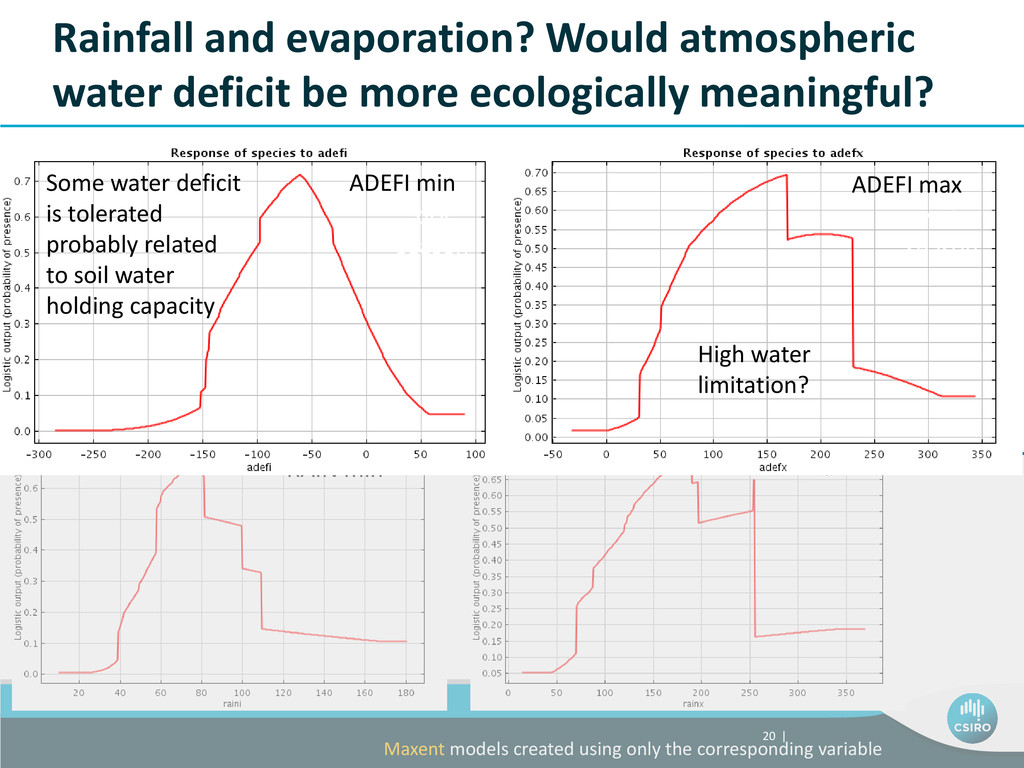
meaningful? Maxent models created using only the corresponding variable EVAP min RAIN min EVAP max RAIN max ADEFI min Some water deficit is tolerated probably related to soil water holding capacity dry season ADEFI max High water limitation? wet season 20 |
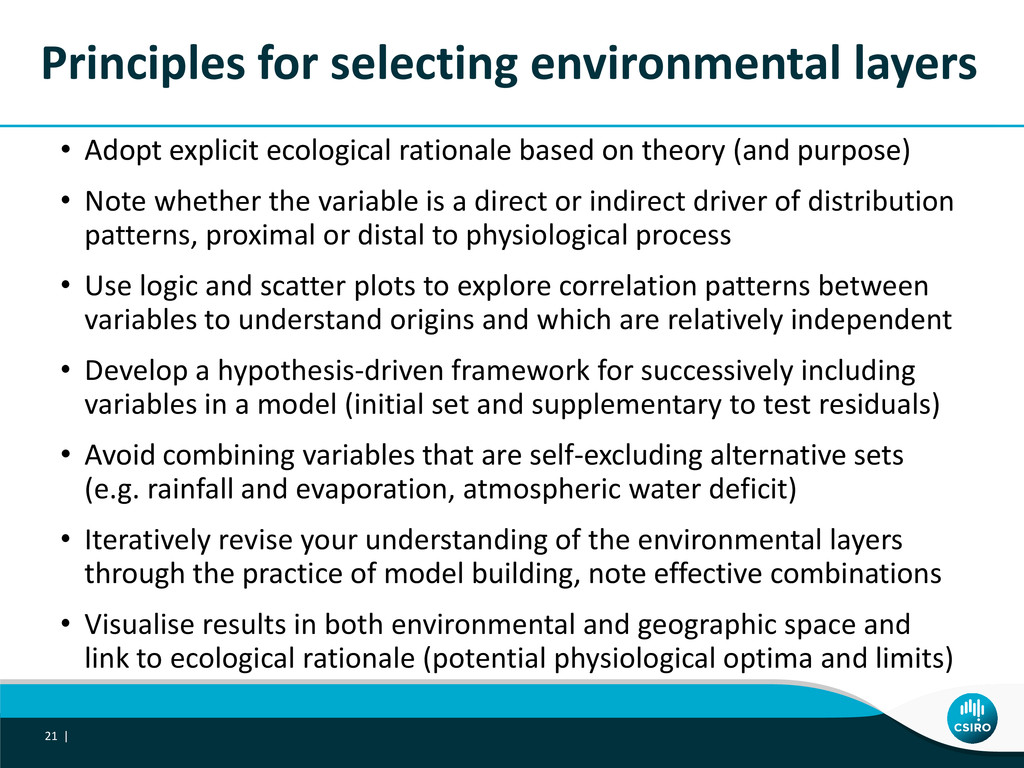
based on theory (and purpose) • Note whether the variable is a direct or indirect driver of distribution patterns, proximal or distal to physiological process • Use logic and scatter plots to explore correlation patterns between variables to understand origins and which are relatively independent • Develop a hypothesis-driven framework for successively including variables in a model (initial set and supplementary to test residuals) • Avoid combining variables that are self-excluding alternative sets (e.g. rainfall and evaporation, atmospheric water deficit) • Iteratively revise your understanding of the environmental layers through the practice of model building, note effective combinations • Visualise results in both environmental and geographic space and link to ecological rationale (potential physiological optima and limits) 21 |
Ecological Geographer Phone: 02 6246 Email: [email protected] Web: www.csiro.au Eucalyptus delegatensis canopy Further Reading: Williams, et al. 2012. Which environmental variables should I use in my biodiversity model? IJGIS, 26:2009-2047.