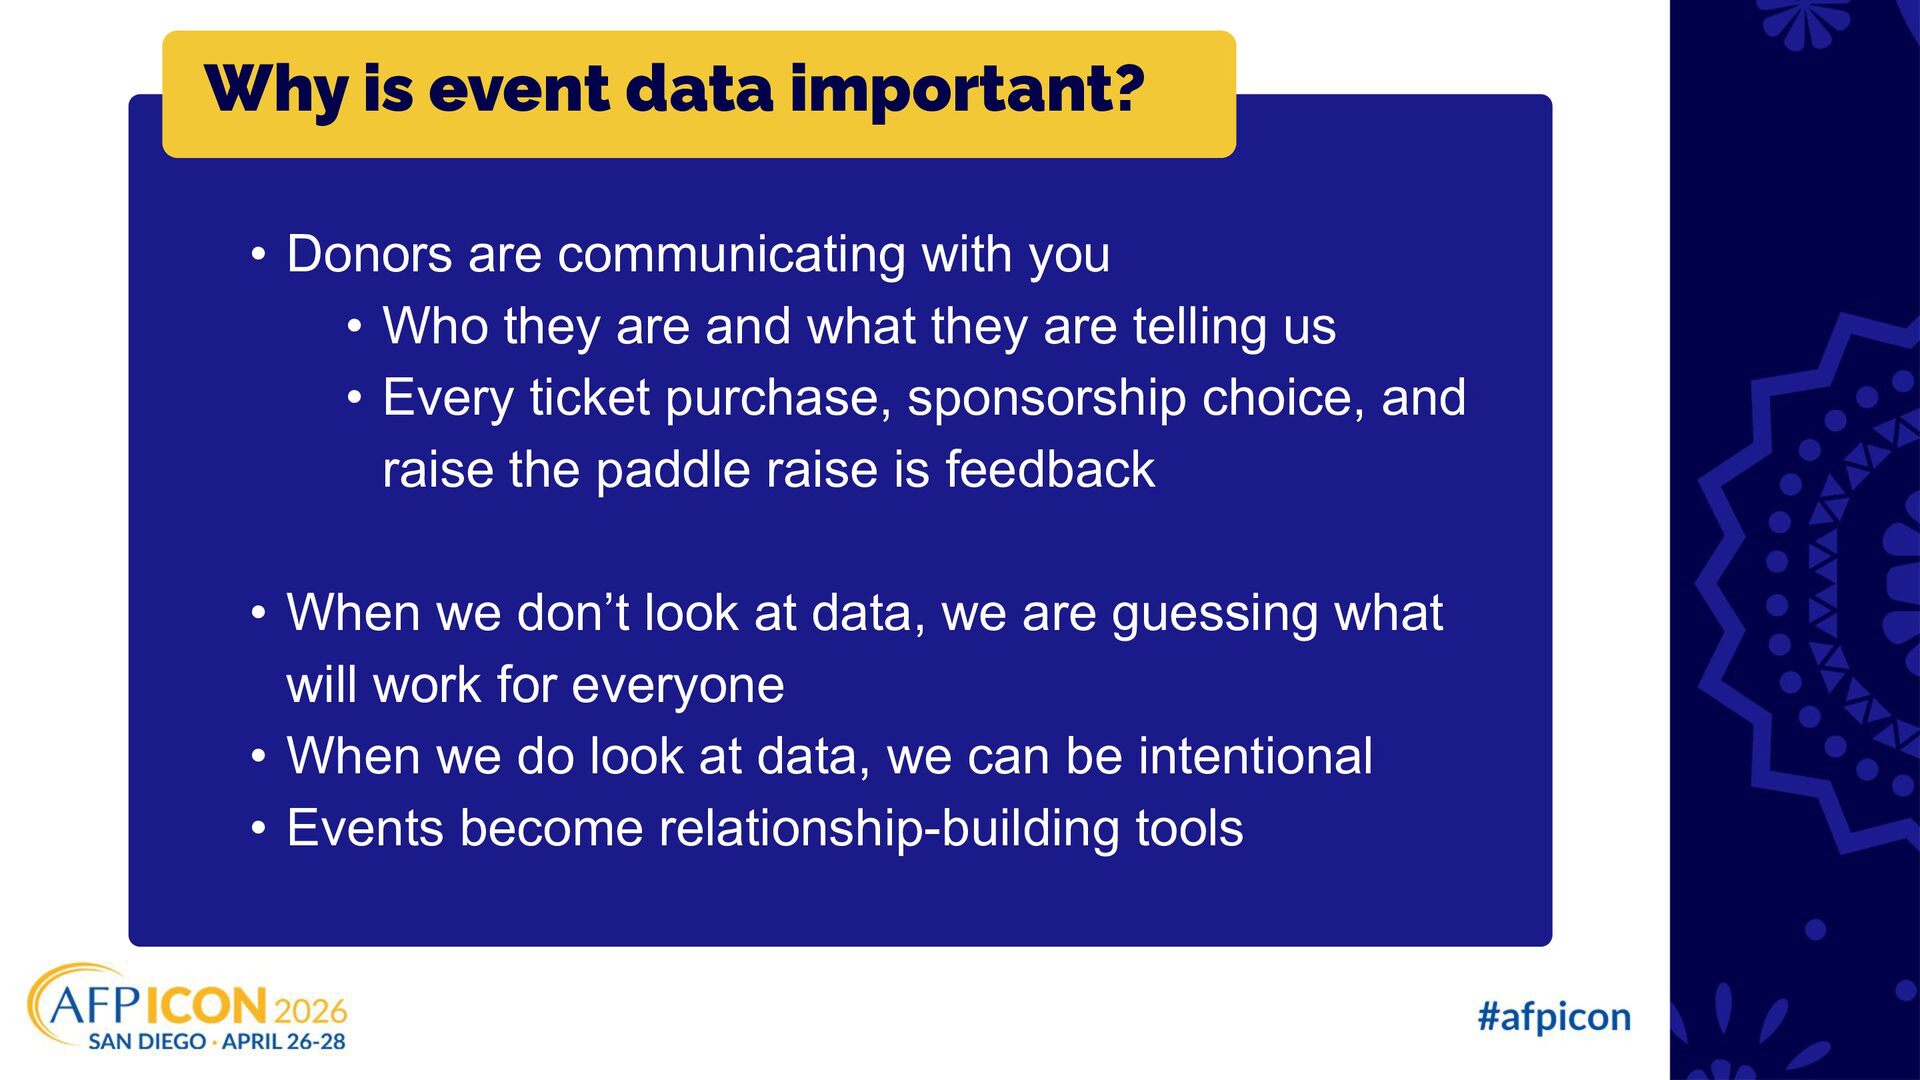
and what they are telling us • Every ticket purchase, sponsorship choice, and raise the paddle raise is feedback • When we don’t look at data, we are guessing what will work for everyone • When we do look at data, we can be intentional • Events become relationship-building tools Why is event data important?
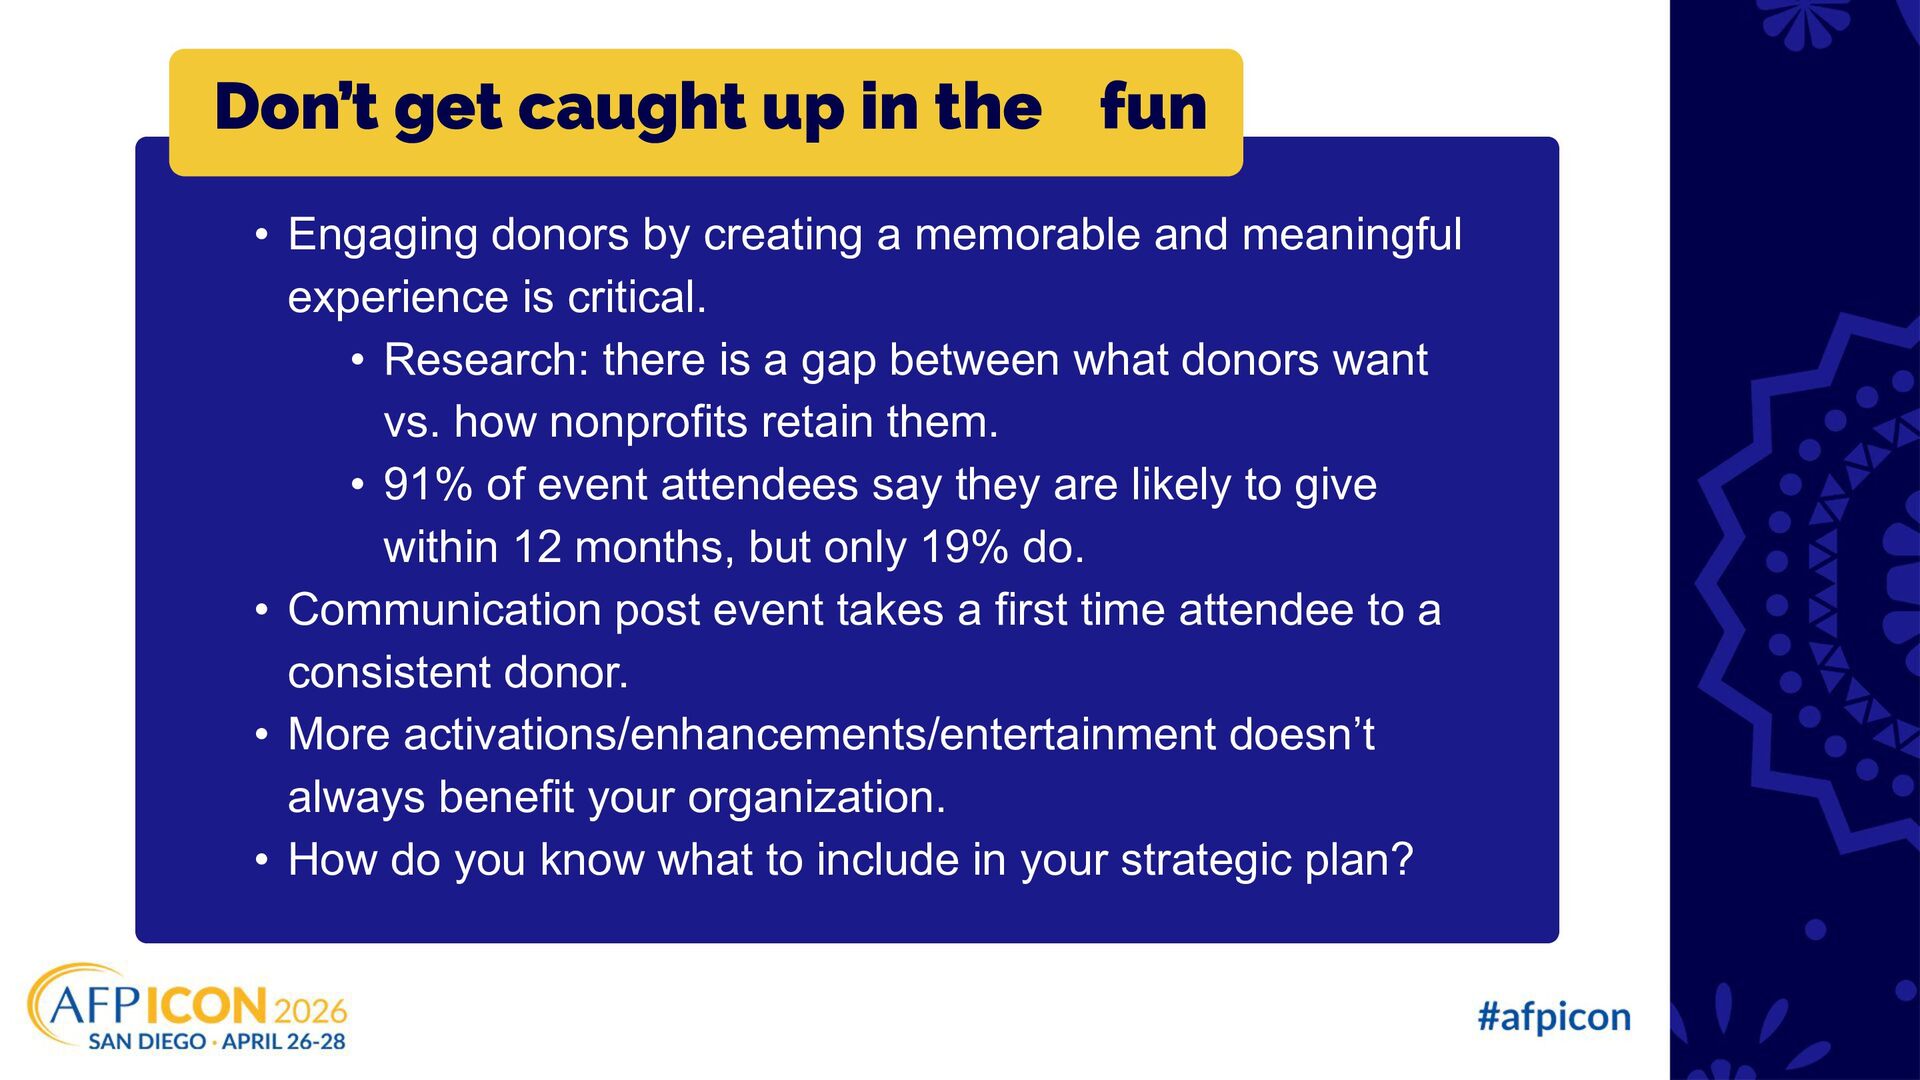
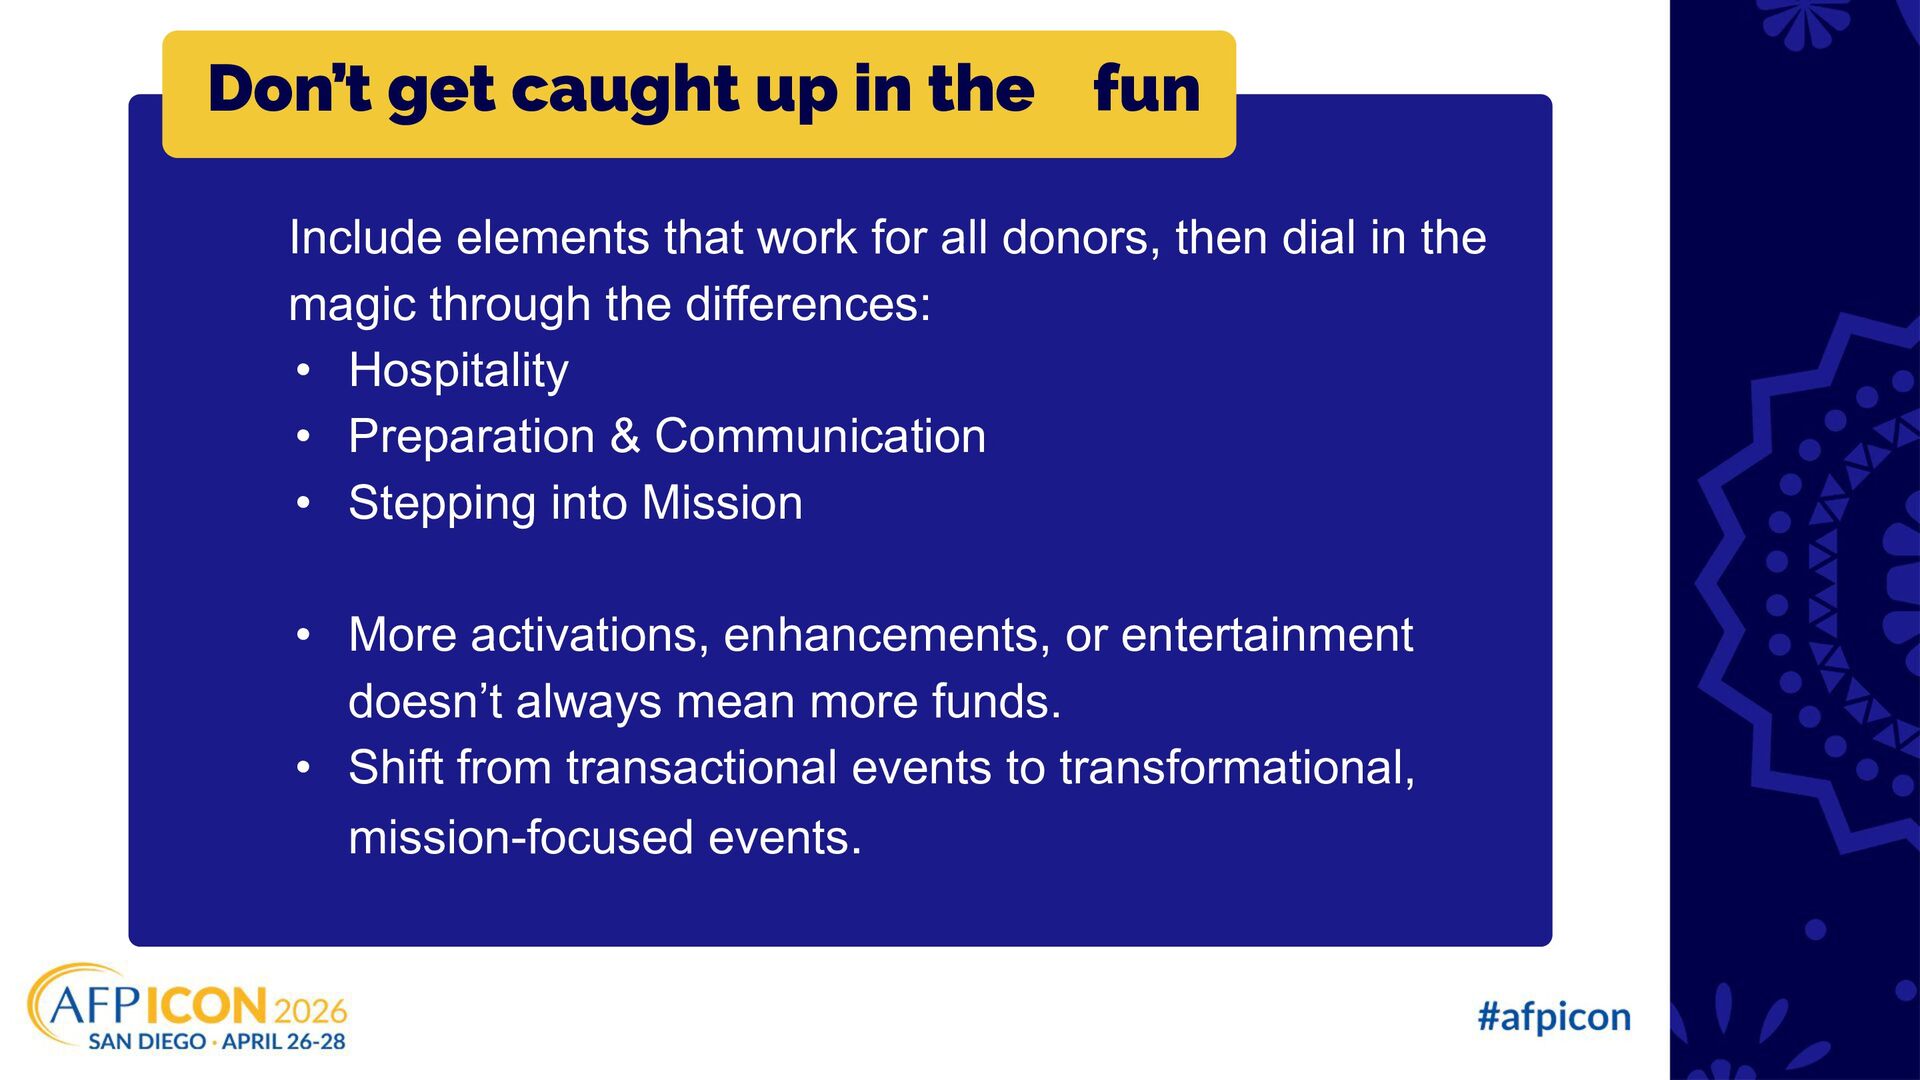
is critical. • Research: there is a gap between what donors want vs. how nonprofits retain them. • 91% of event attendees say they are likely to give within 12 months, but only 19% do. • Communication post event takes a first time attendee to a consistent donor. • More activations/enhancements/entertainment doesn’t always benefit your organization. • How do you know what to include in your strategic plan? Don’t get caught up in the fun
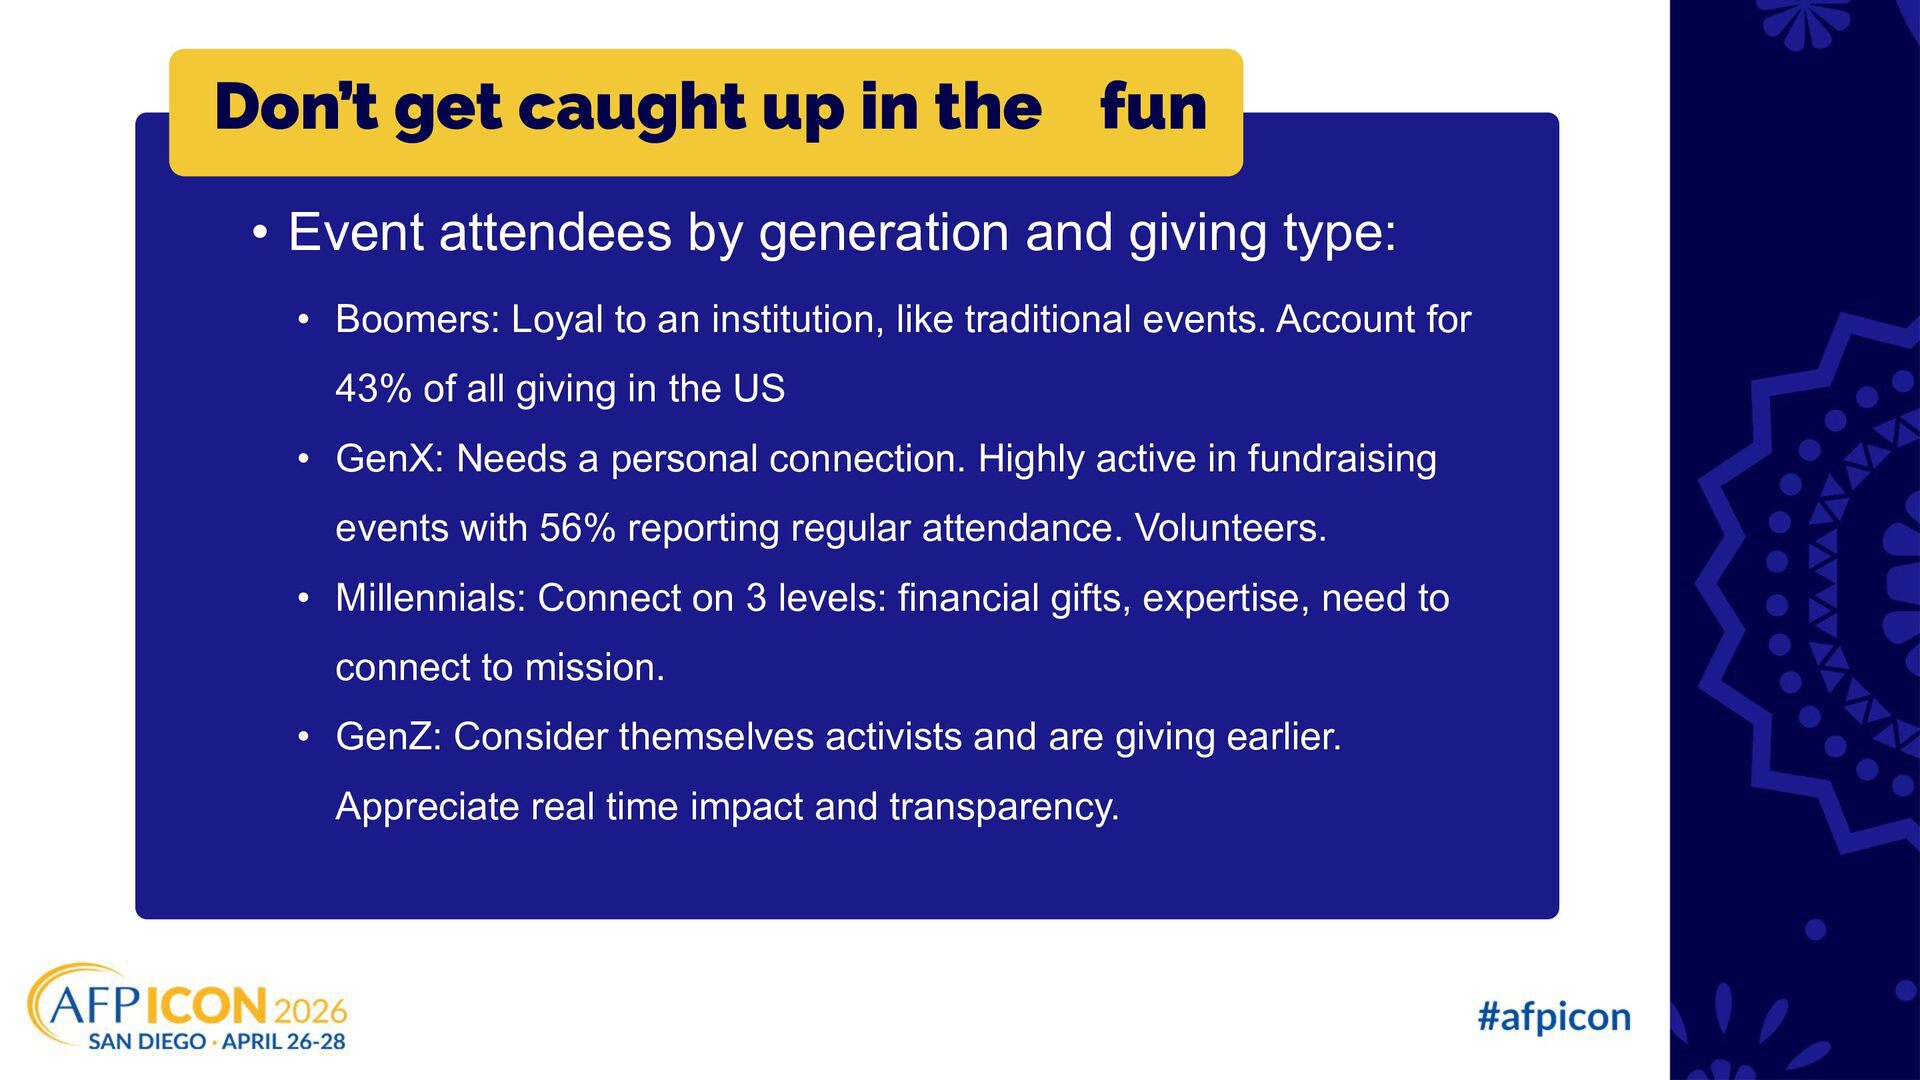
by generation and giving type: • Boomers: Loyal to an institution, like traditional events. Account for 43% of all giving in the US • GenX: Needs a personal connection. Highly active in fundraising events with 56% reporting regular attendance. Volunteers. • Millennials: Connect on 3 levels: financial gifts, expertise, need to connect to mission. • GenZ: Consider themselves activists and are giving earlier. Appreciate real time impact and transparency.
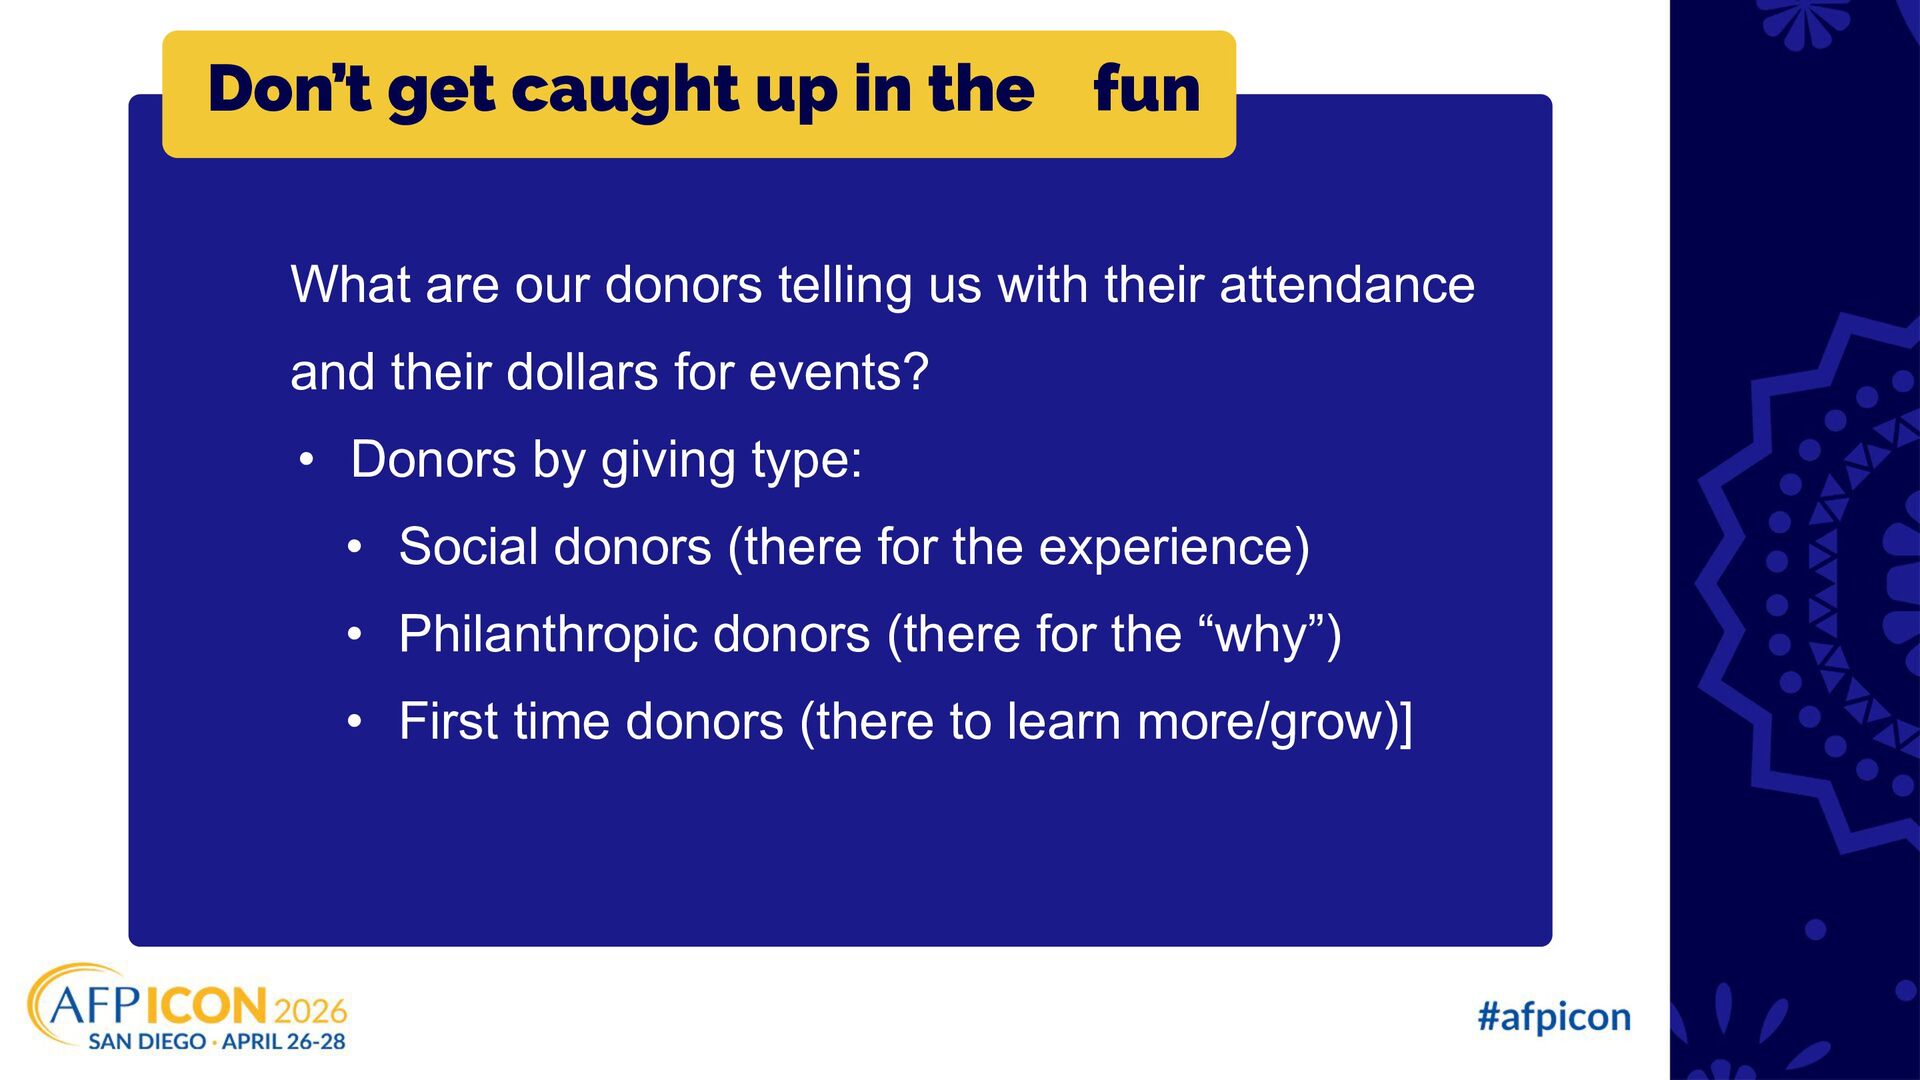
their dollars for events? • Donors by giving type: • Social donors (there for the experience) • Philanthropic donors (there for the “why”) • First time donors (there to learn more/grow)] Don’t get caught up in the fun
the magic through the differences: • Hospitality • Preparation & Communication • Stepping into Mission • More activations, enhancements, or entertainment doesn’t always mean more funds. • Shift from transactional events to transformational, mission-focused events. Don’t get caught up in the fun
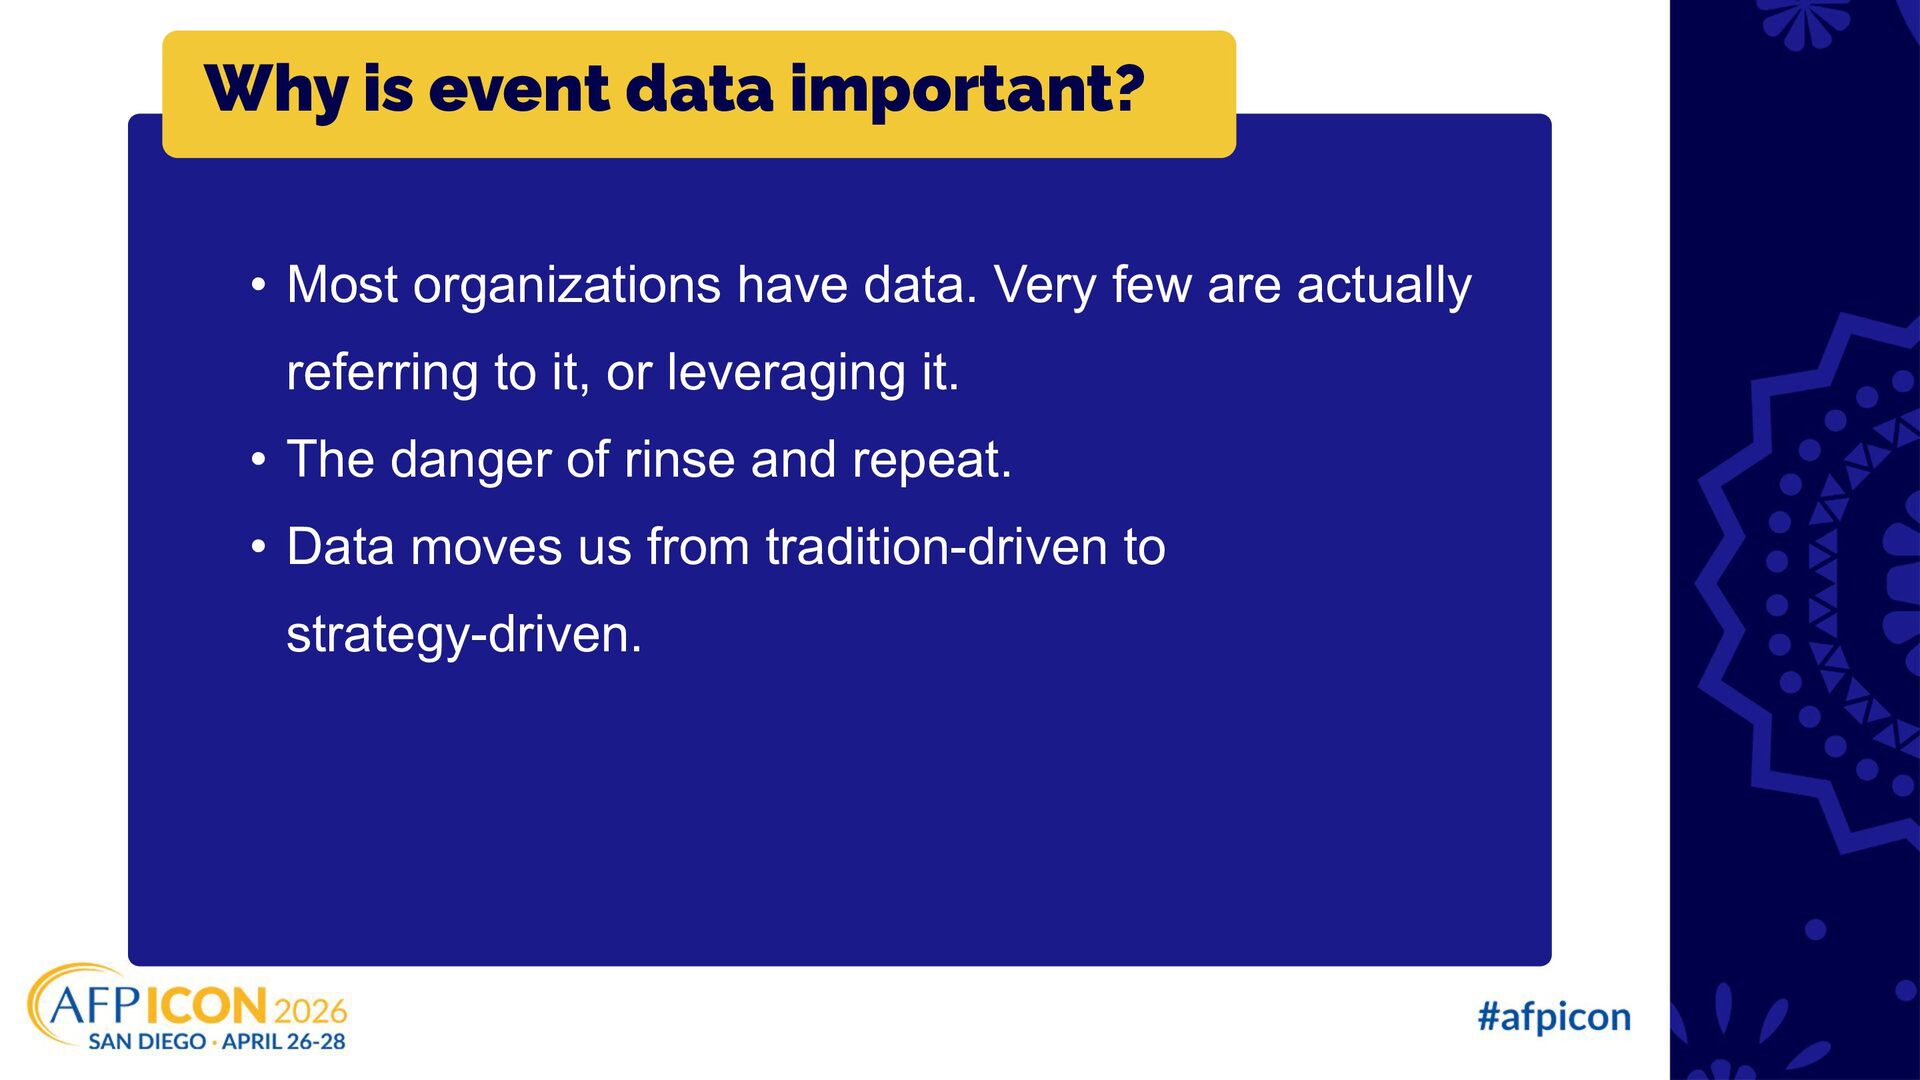
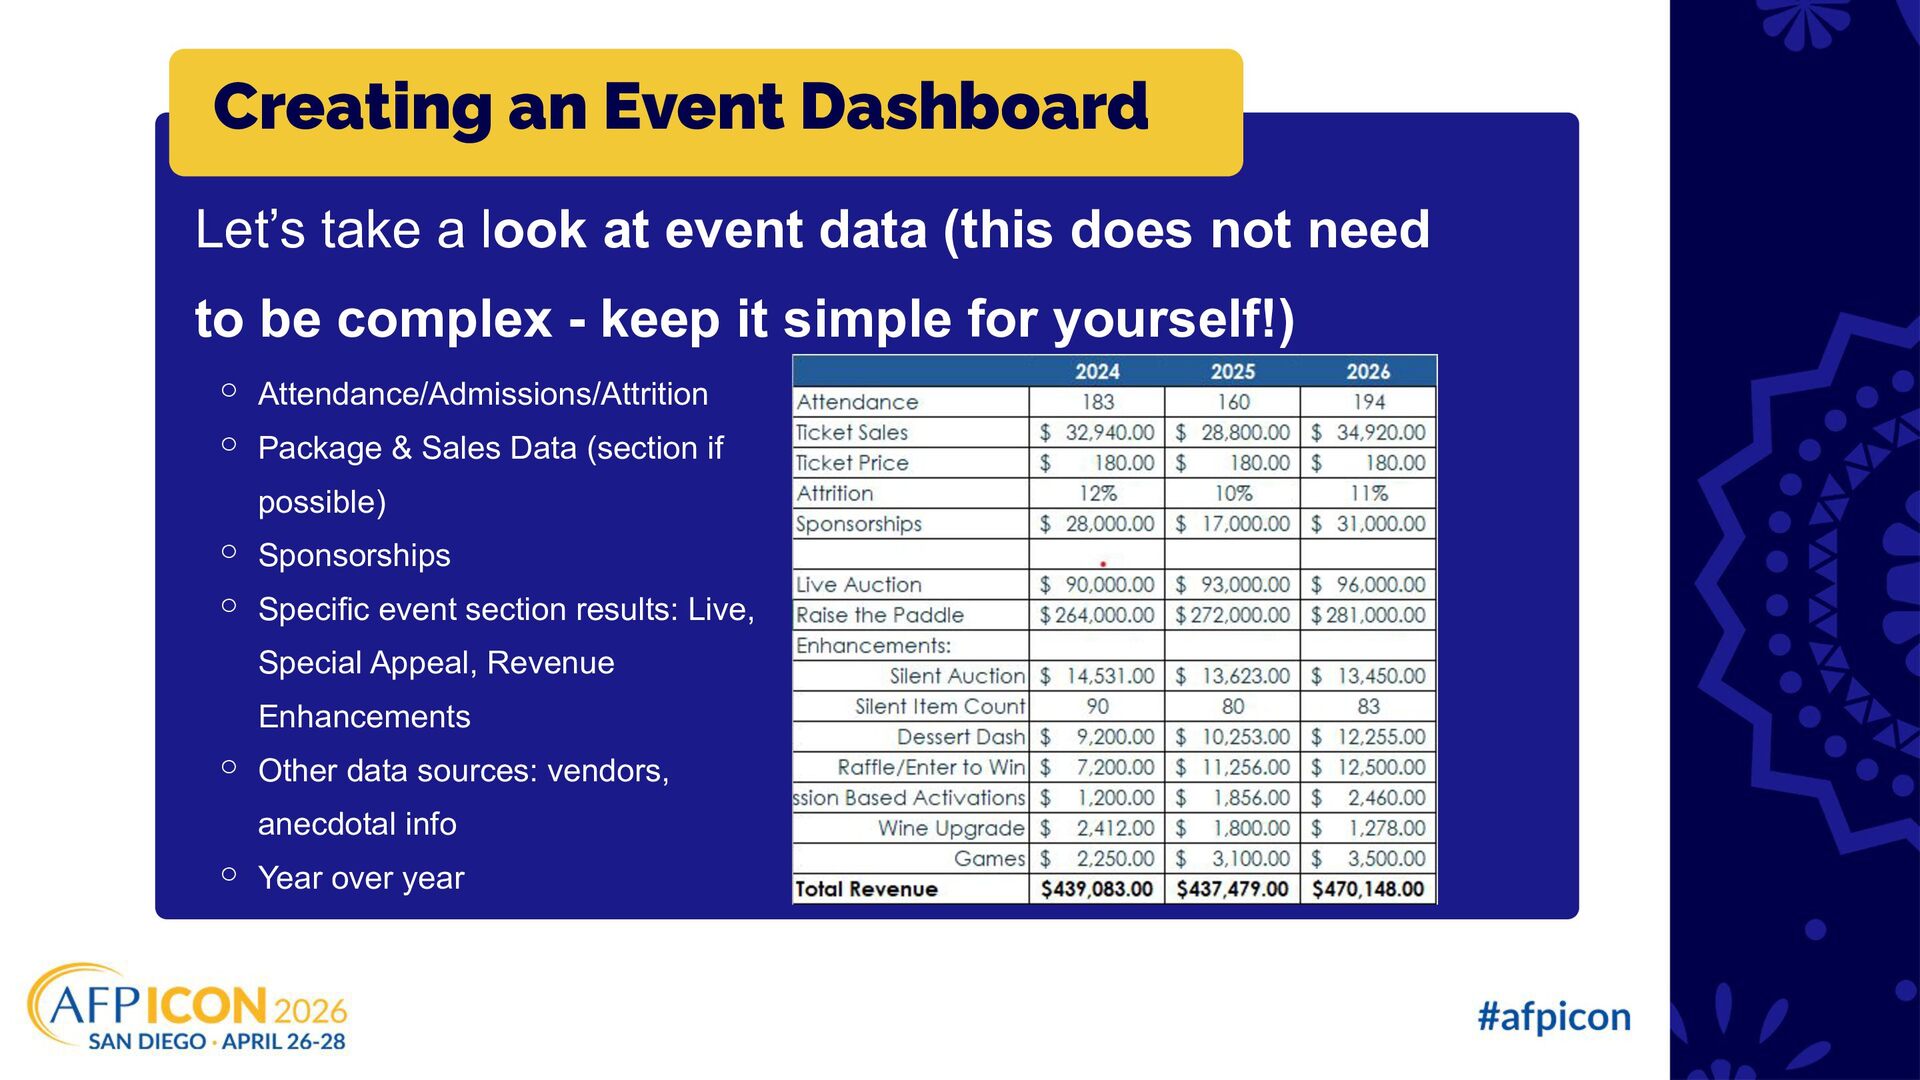
Data (section if possible) ⚬ Sponsorships ⚬ Specific event section results: Live, Special Appeal, Revenue Enhancements ⚬ Other data sources: vendors, anecdotal info ⚬ Year over year Let’s take a look at event data (this does not need to be complex - keep it simple for yourself!)
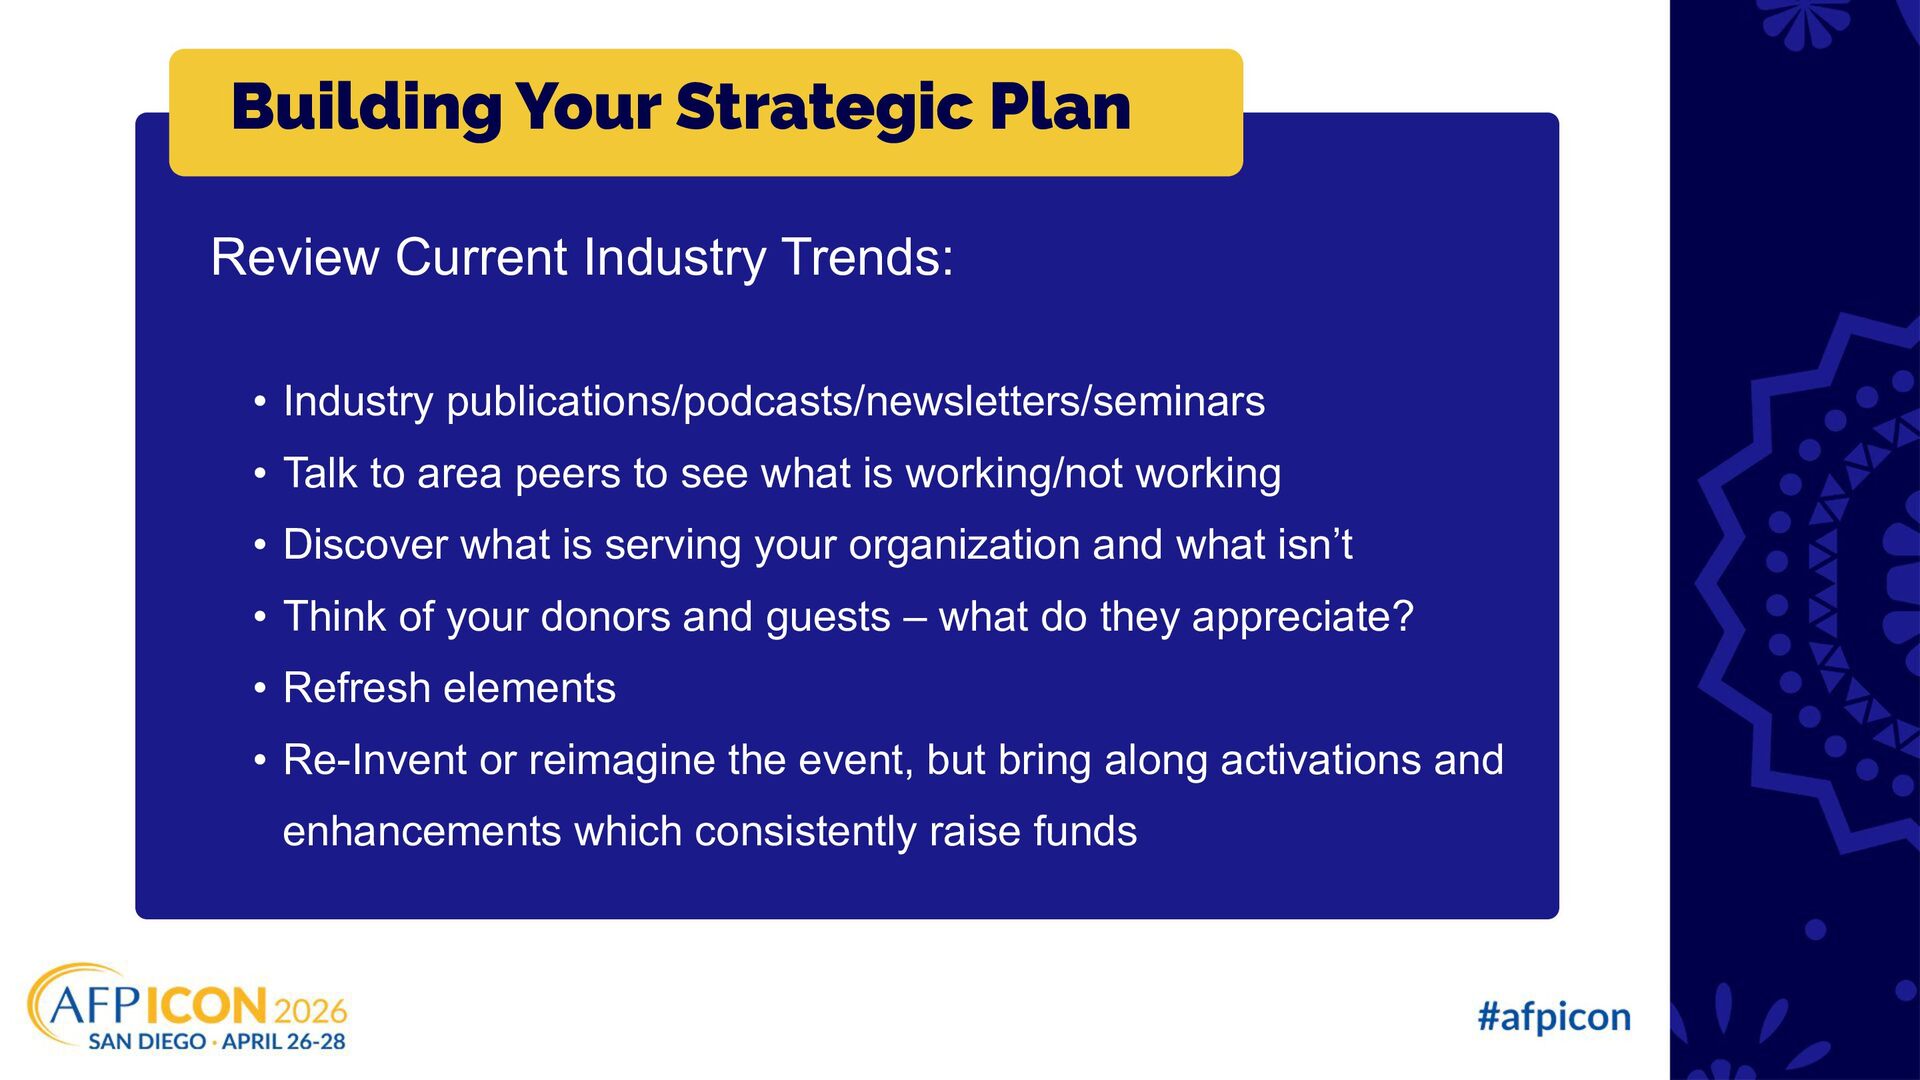
publications/podcasts/newsletters/seminars • Talk to area peers to see what is working/not working • Discover what is serving your organization and what isn’t • Think of your donors and guests – what do they appreciate? • Refresh elements • Re-Invent or reimagine the event, but bring along activations and enhancements which consistently raise funds
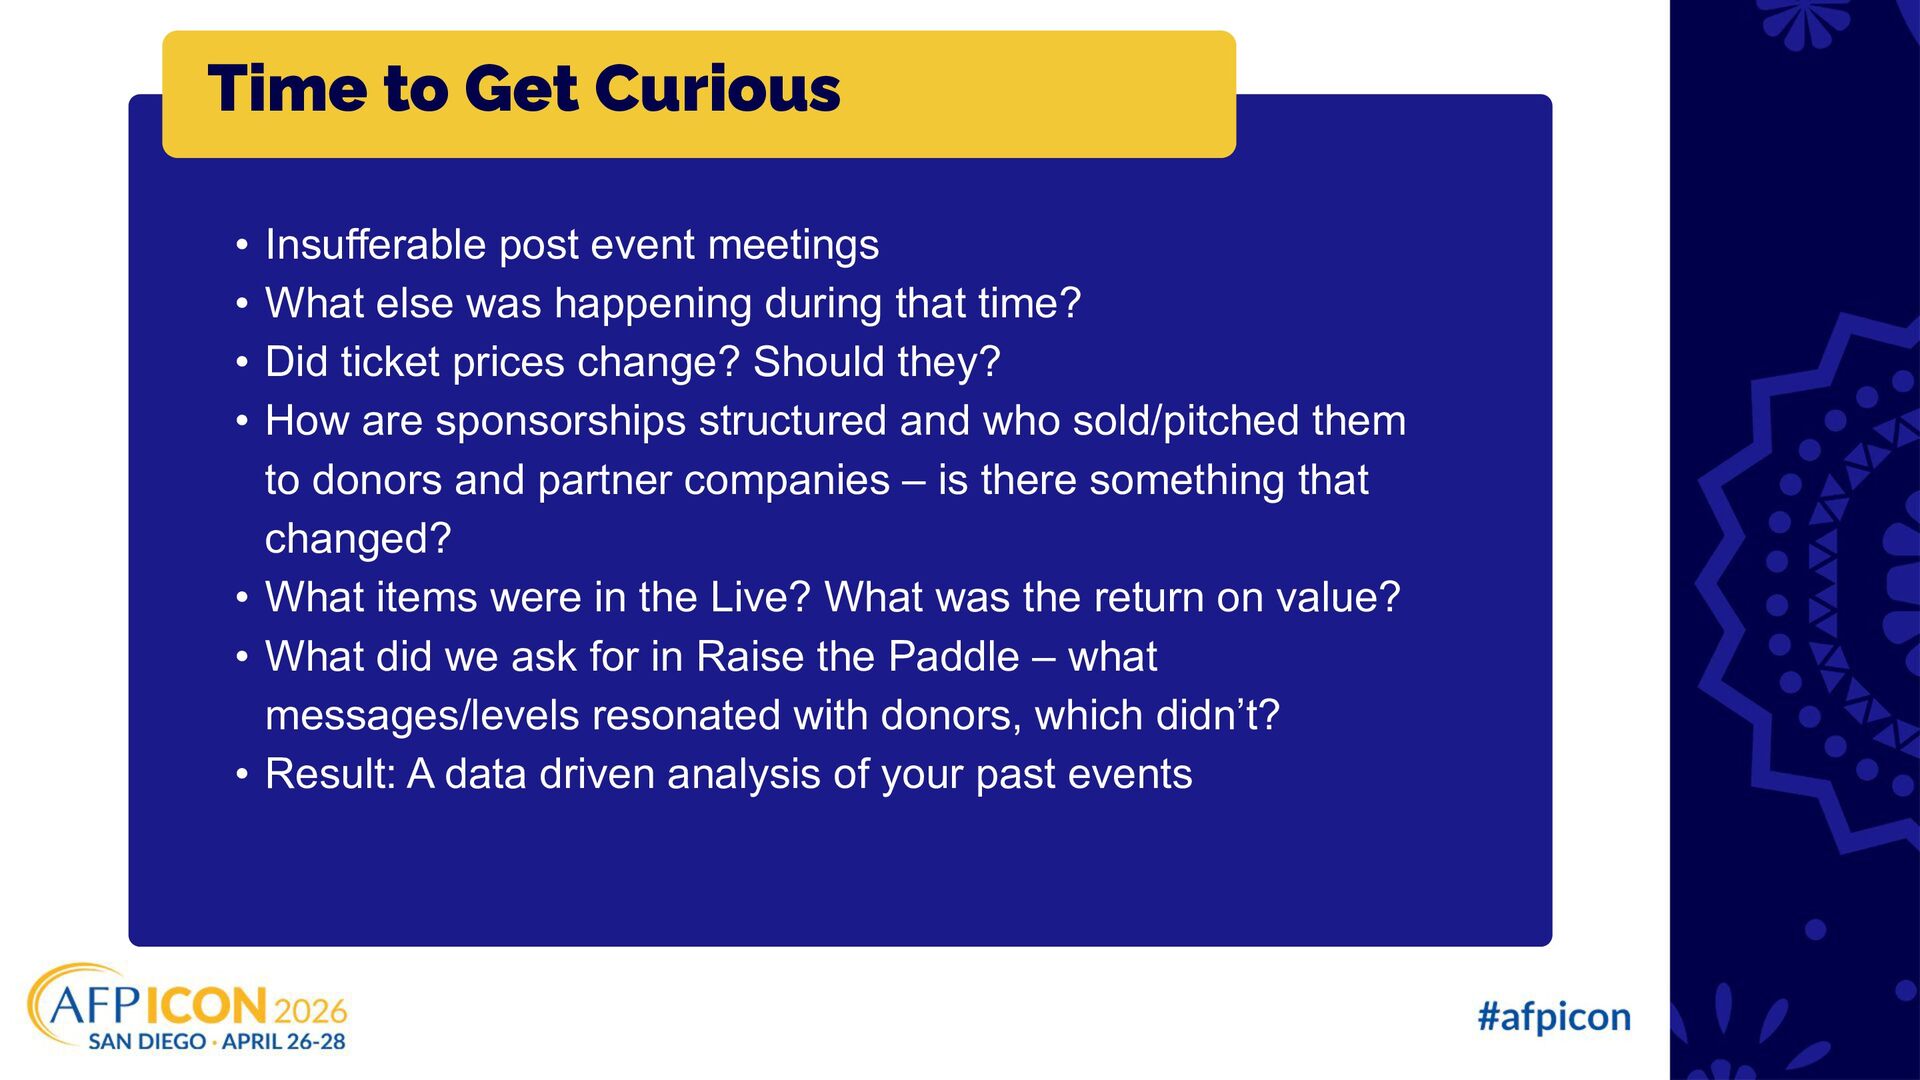
during that time? • Did ticket prices change? Should they? • How are sponsorships structured and who sold/pitched them to donors and partner companies – is there something that changed? • What items were in the Live? What was the return on value? • What did we ask for in Raise the Paddle – what messages/levels resonated with donors, which didn’t? • Result: A data driven analysis of your past events Time to Get Curious
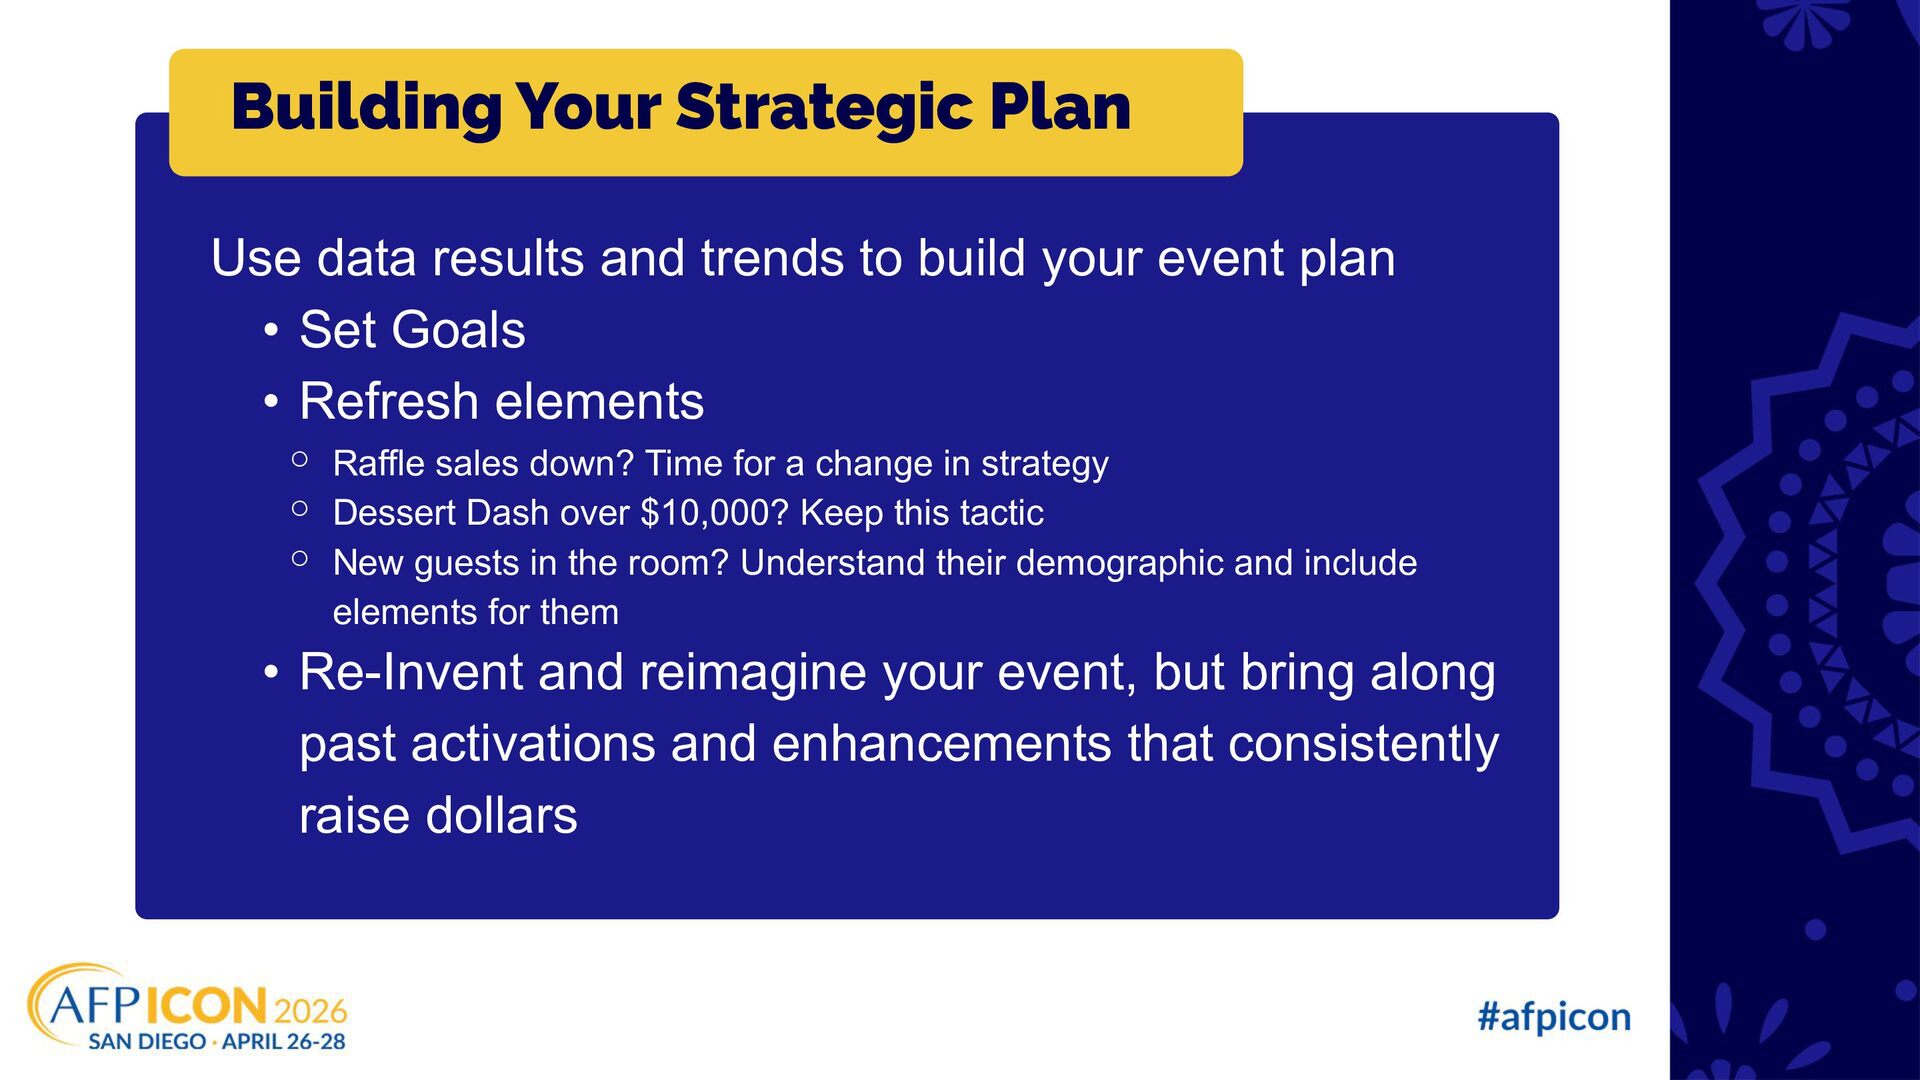
build your event plan • Set Goals • Refresh elements ⚬ Raffle sales down? Time for a change in strategy ⚬ Dessert Dash over $10,000? Keep this tactic ⚬ New guests in the room? Understand their demographic and include elements for them • Re-Invent and reimagine your event, but bring along past activations and enhancements that consistently raise dollars
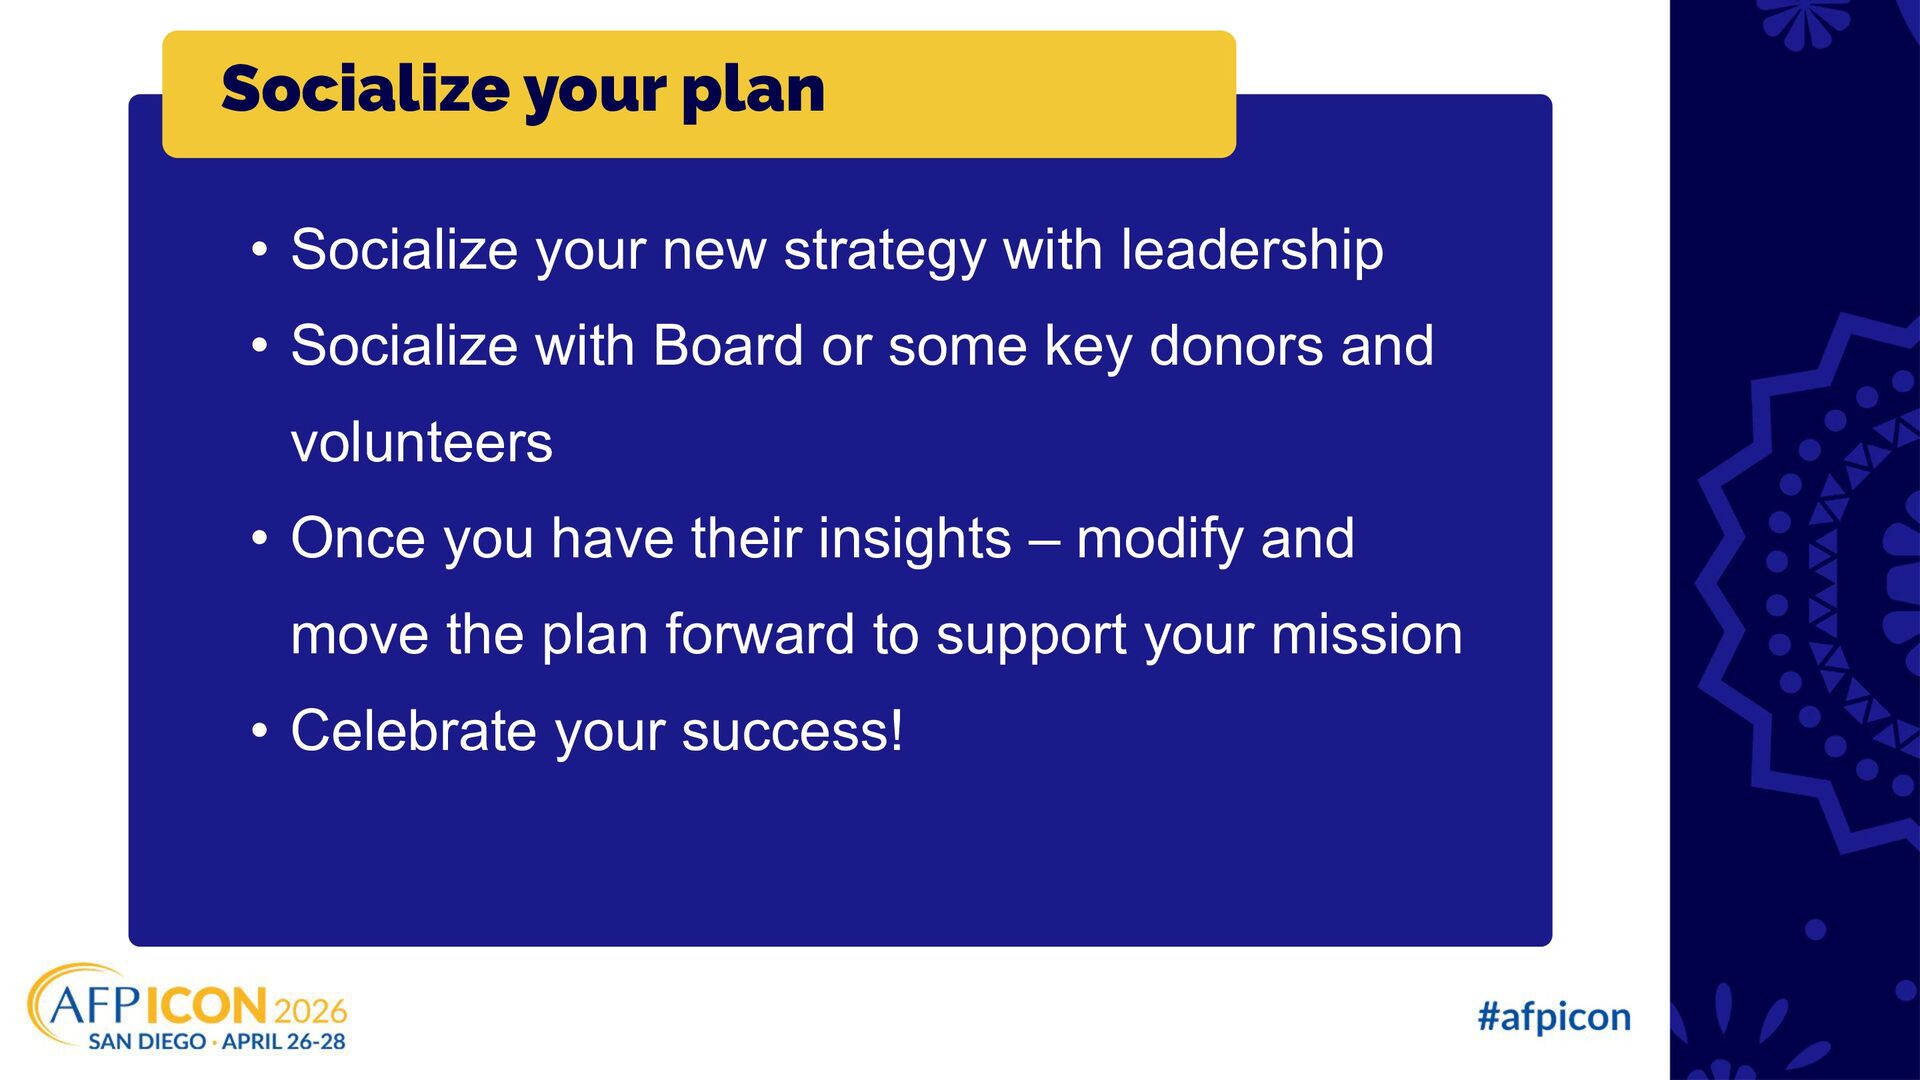
Board or some key donors and volunteers • Once you have their insights – modify and move the plan forward to support your mission • Celebrate your success! Socialize your plan
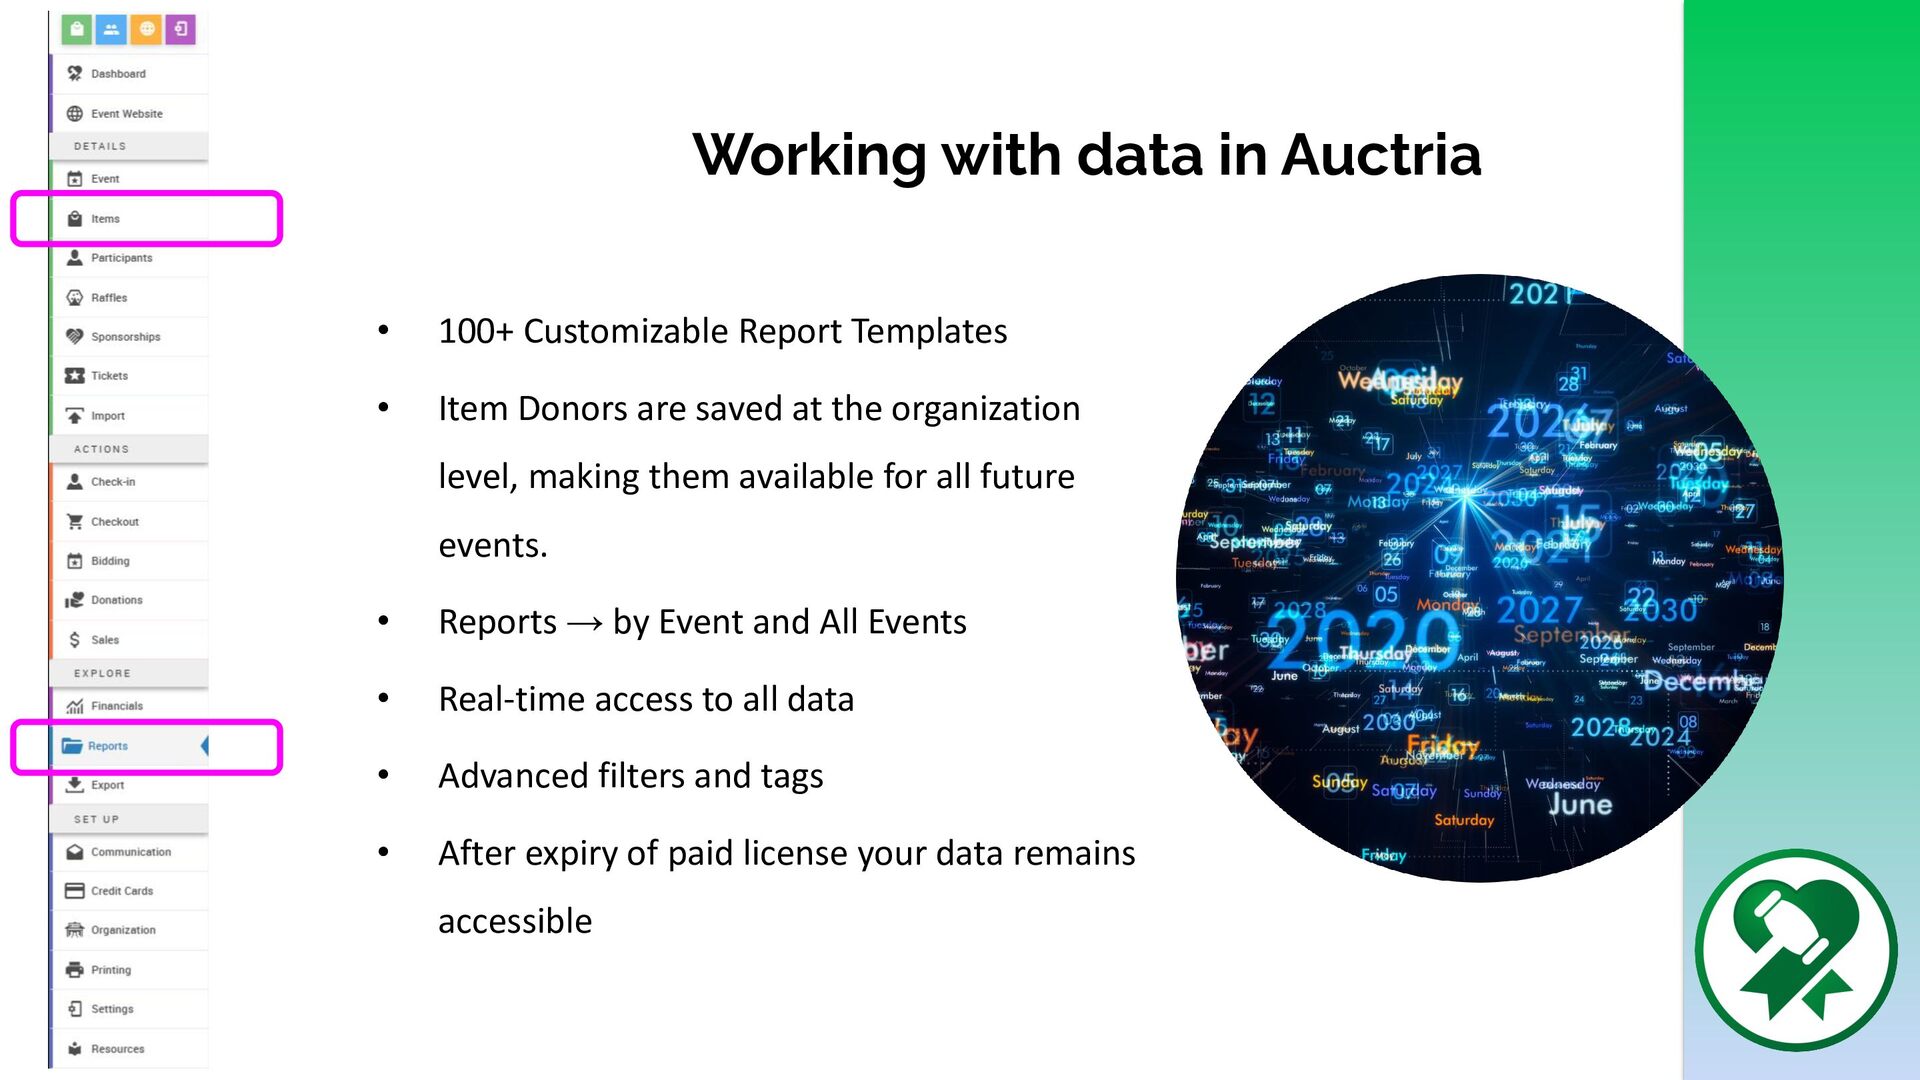
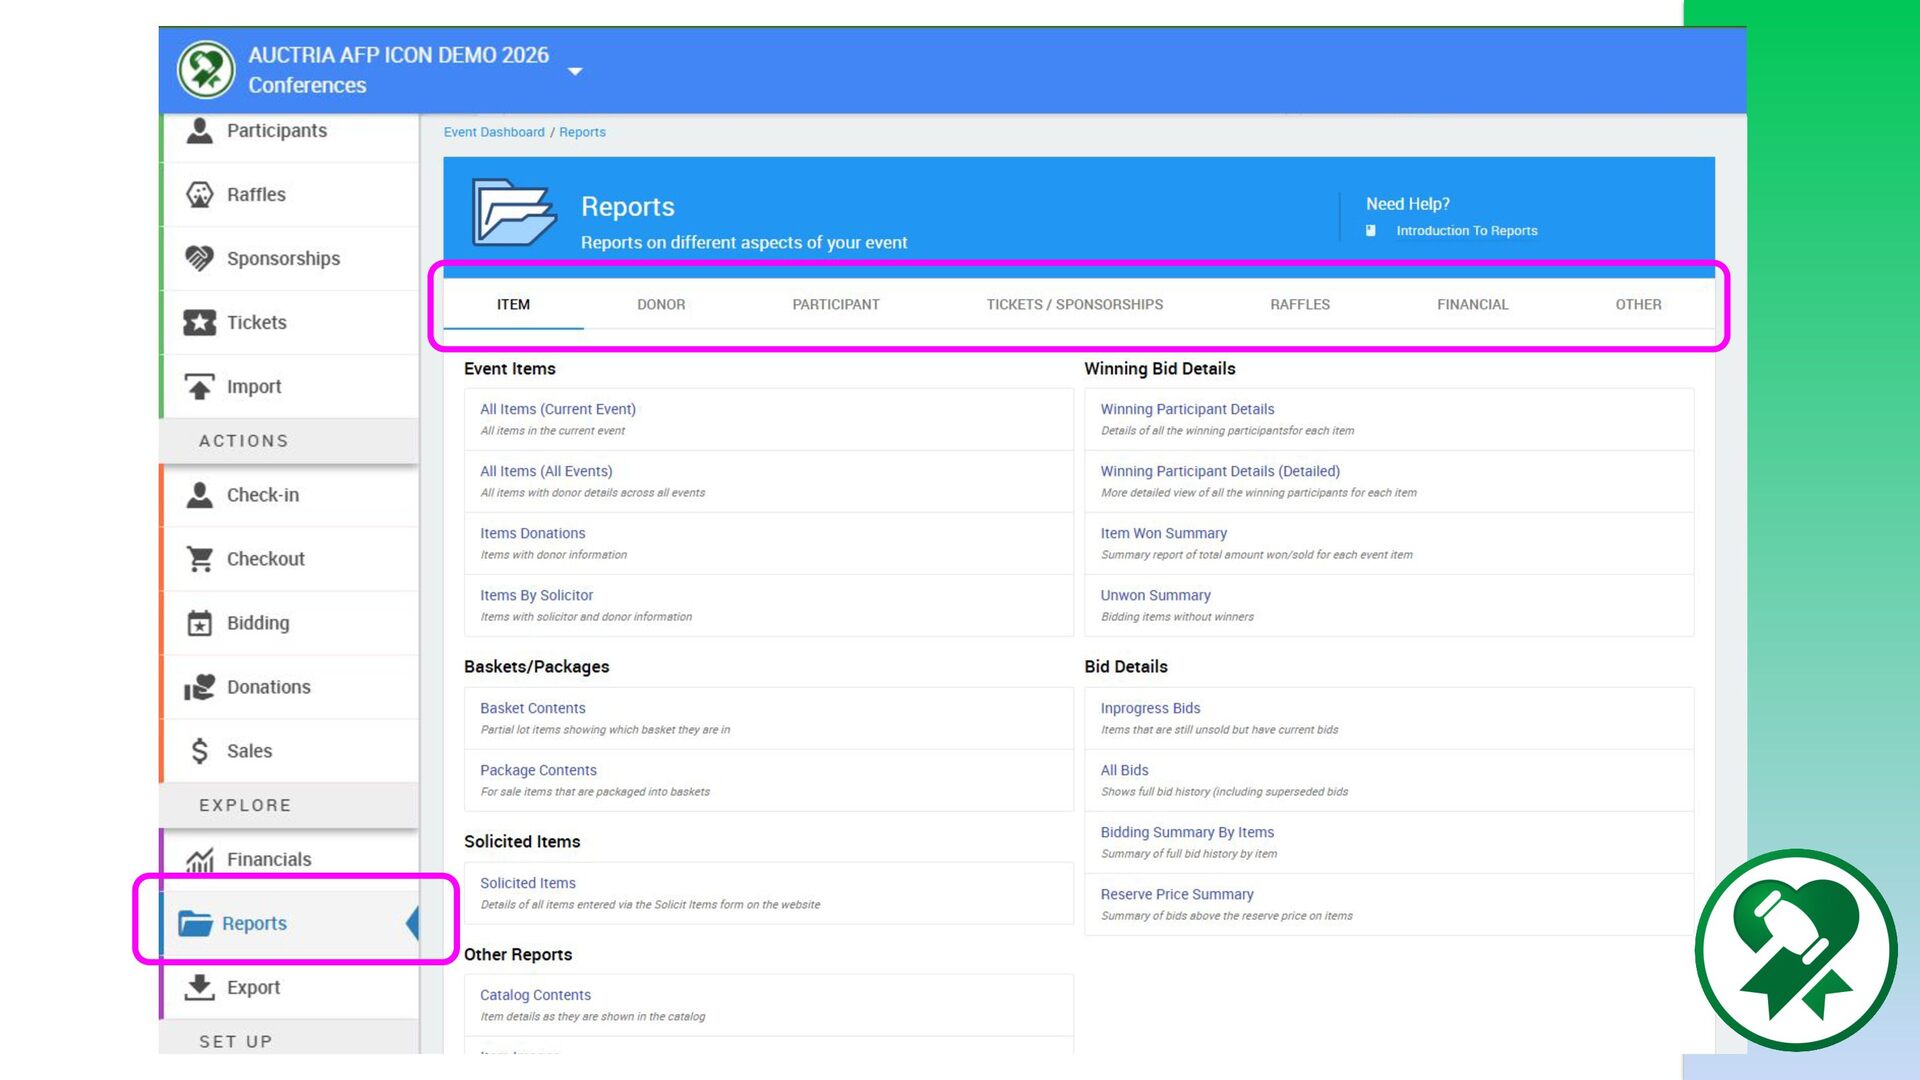
• Item Donors are saved at the organization level, making them available for all future events. • Reports → by Event and All Events • Real-time access to all data • Advanced filters and tags • After expiry of paid license your data remains accessible
![Contact Us • eefundraising.com • [email protected] • @eefundraising • @julianneread](https://files.speakerdeck.com/presentations/28a289fc058743b5a45f70d4993eb0bf/slide_25.jpg)