Upgrade to Pro — share decks privately, control downloads, hide ads and more …

A few good development metrics

A few good development metrics

Presented at Agile India 2012 Bangalore
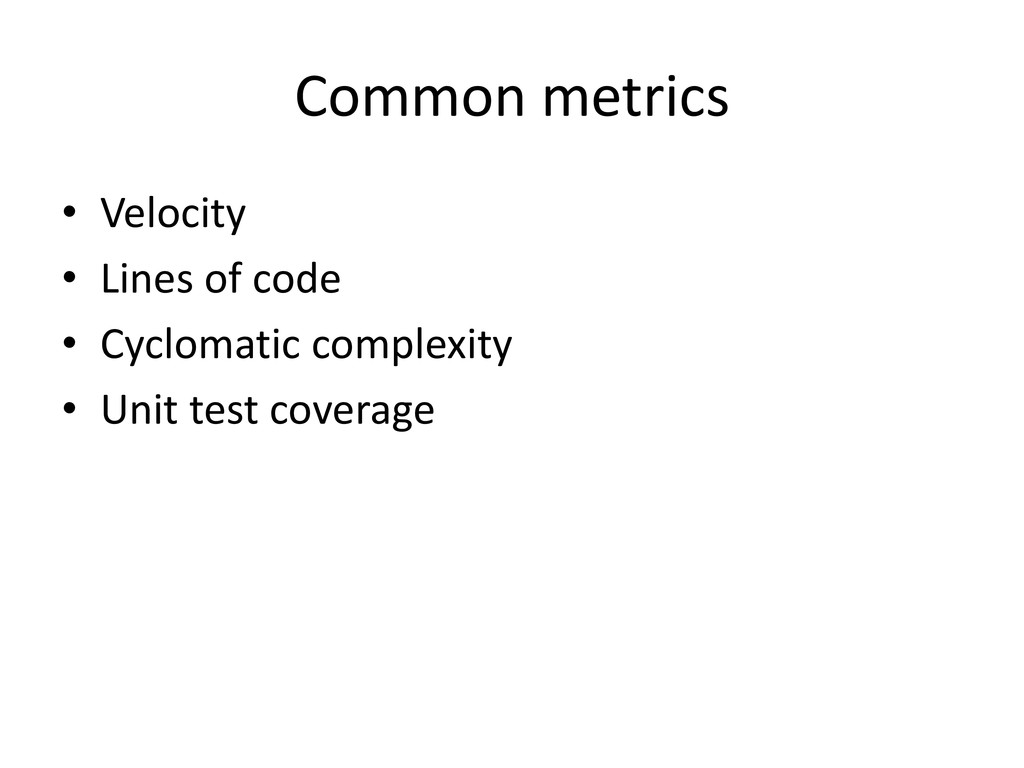
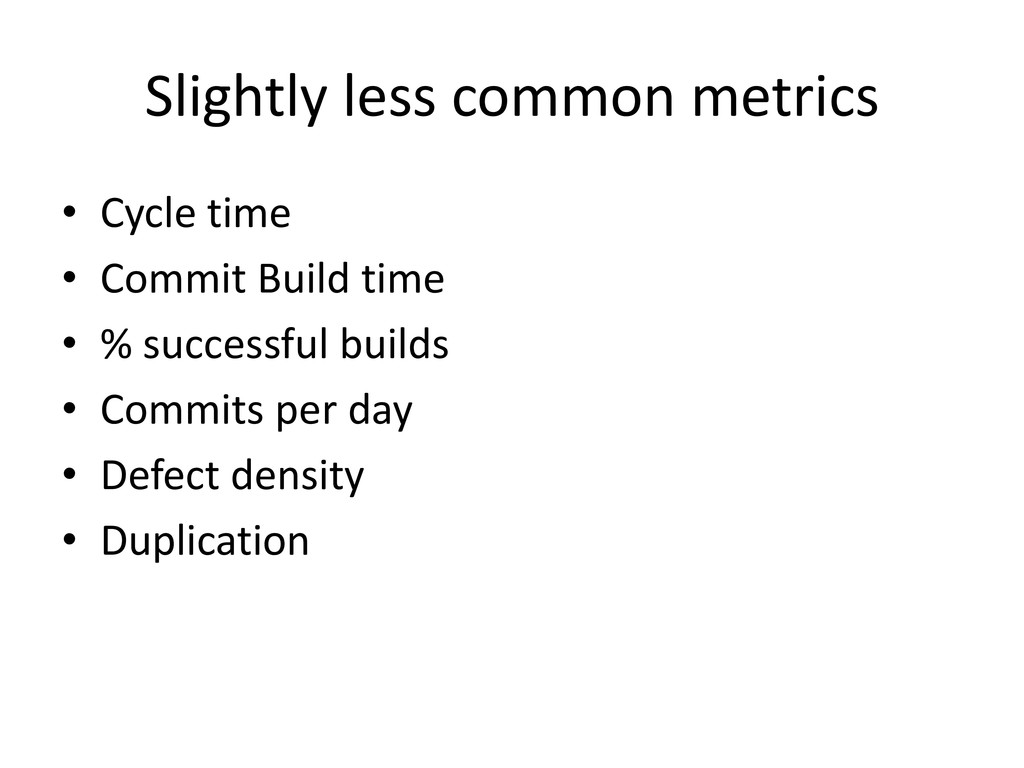
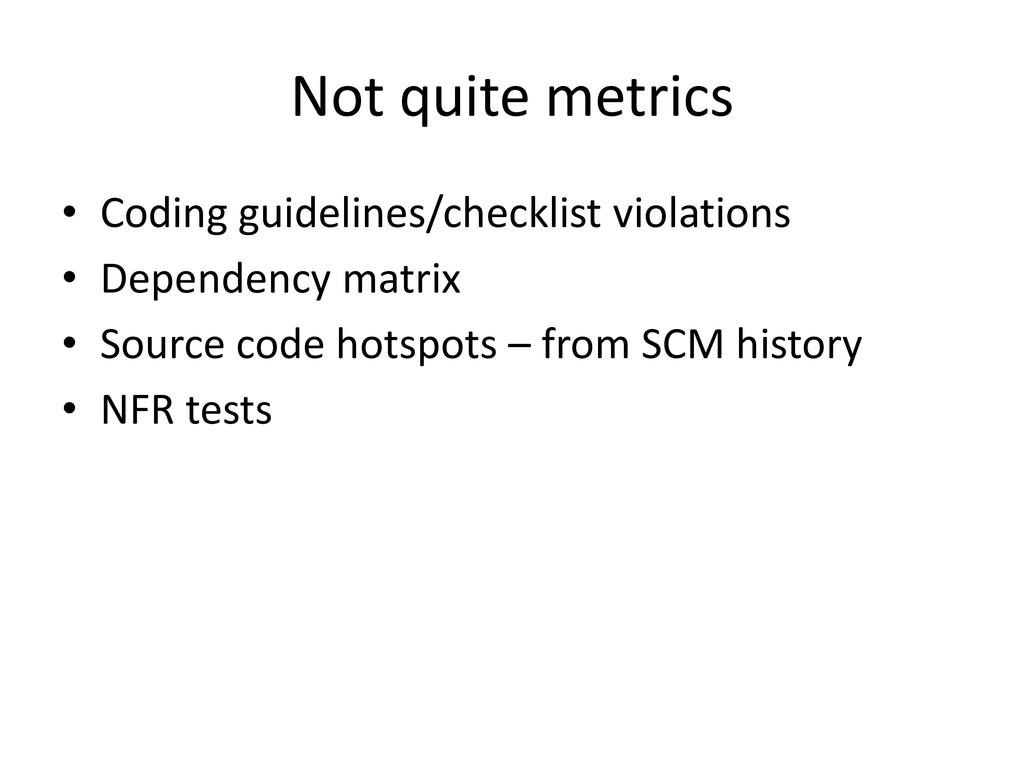
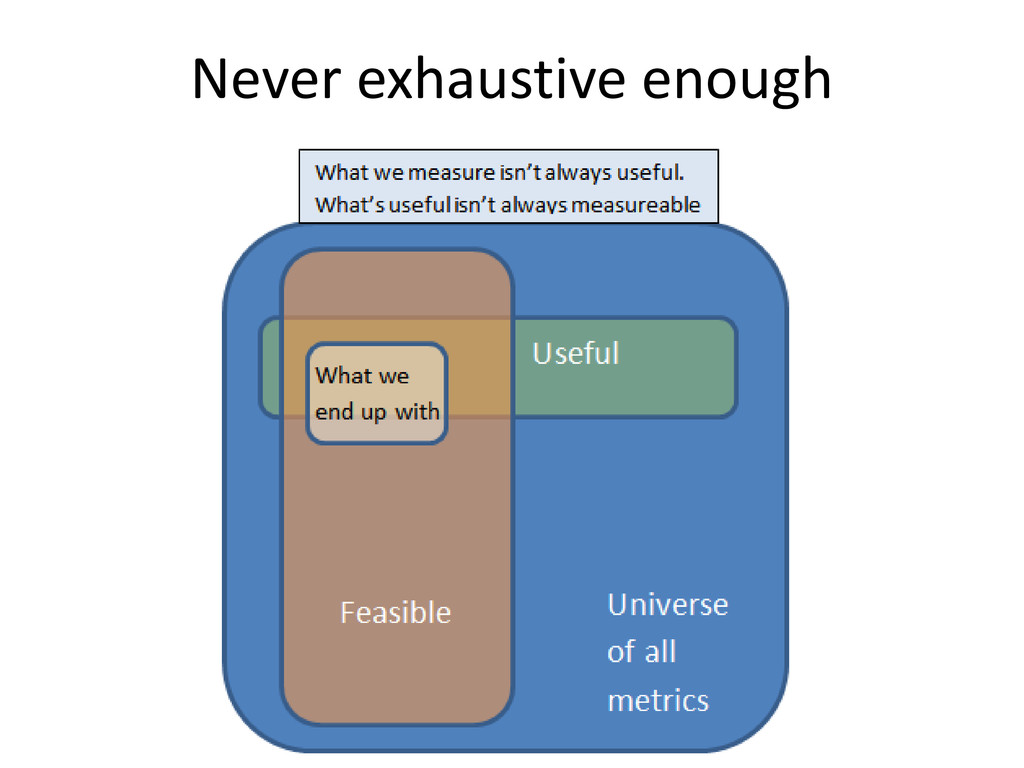
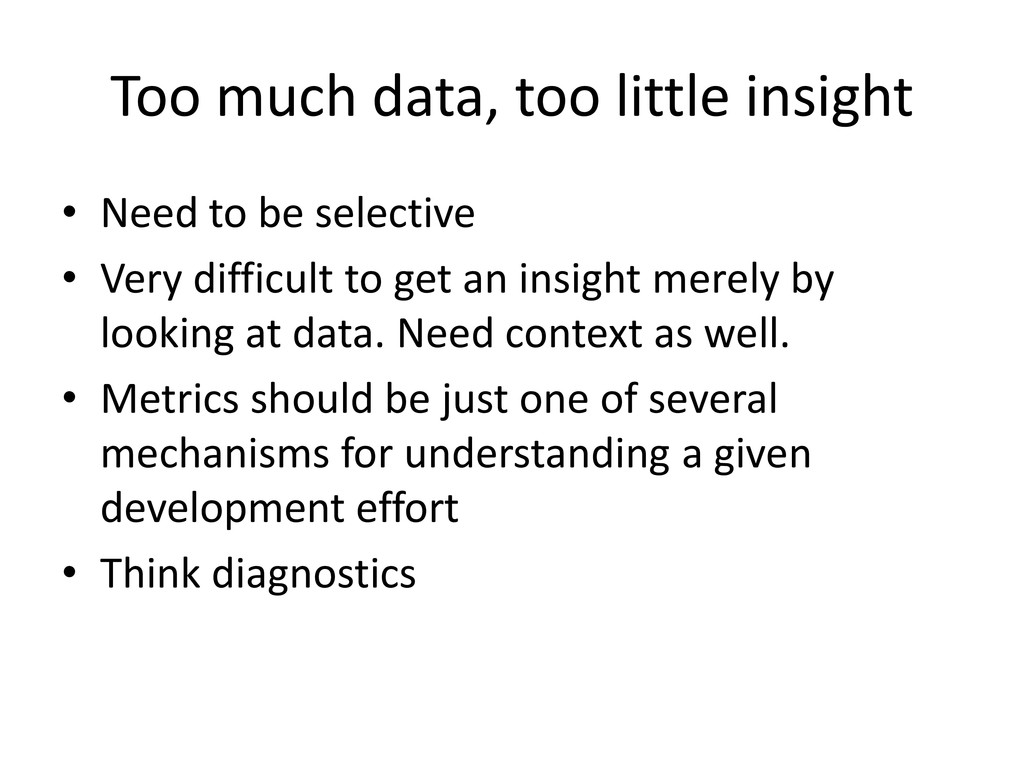
The problem with metrics is that there are so many to choose from. Lines of code, rule violations, dependency matrices, cyclomatic/npath complexity, code coverage, duplication - the list goes on. Tracking all of these results in too much data and too little insight. In this talk, we will see how to narrow down to a small set of useful metrics. We'll also see how aggregate metrics like toxicity help reduce the tracking footprint. Finally, we'll look at the difference between a measurement and a target and see why measurements should not be simply converted into targets.

Sriram Narayan

February 19, 2012
Tweet

More Decks by Sriram Narayan

Other Decks in Technology

Transcript

  1. Slightly less common metrics • Cycle time • Commit Build

    time • % successful builds • Commits per day • Defect density • Duplication
  2. Not quite metrics • Coding guidelines/checklist violations • Dependency matrix

    • Source code hotspots – from SCM history • NFR tests
  3. Too much data, too little insight • Need to be

    selective • Very difficult to get an insight merely by looking at data. Need context as well. • Metrics should be just one of several mechanisms for understanding a given development effort • Think diagnostics
  4. Aggregate metrics • We already use some – Velocity, build

    time, test coverage • Combine related metrics into meaningful aggregates • What if we could roll up a set of code quality metrics into one meaningful aggregate?
  5. Toxicity x times threshold value contributes x units of toxicity

    Thresholds are defined at ‘toxic’ levels, not just bad
  6. Suggested core • Toxicity balanced with duplication • Test Coverage

    balanced with test to code ratio • Commit Build time • Velocity
  7. Measurement vs. target • Targets are optional • The more

    specific a measurement, the less reason to set a target for it • Targets influence behaviour and cause local optima • Targets encourage “hands off” red-green- amber supervision • Abolish the metrics cop
  8. Visualizing metrics • May be useful depending on the audience

    • It is possible for critical thinking to get clouded by slick visualization • A picture is not always worth a thousand words • Beware the dumbing-down effect
  9. The use and abuse of metrics • Use them as

    one of the guiding inputs • The metrics are not in charge • Beware the green dashboard • Don’t use them as a reporting tool • Don’t use them as a means to separate decision-making/planning from execution