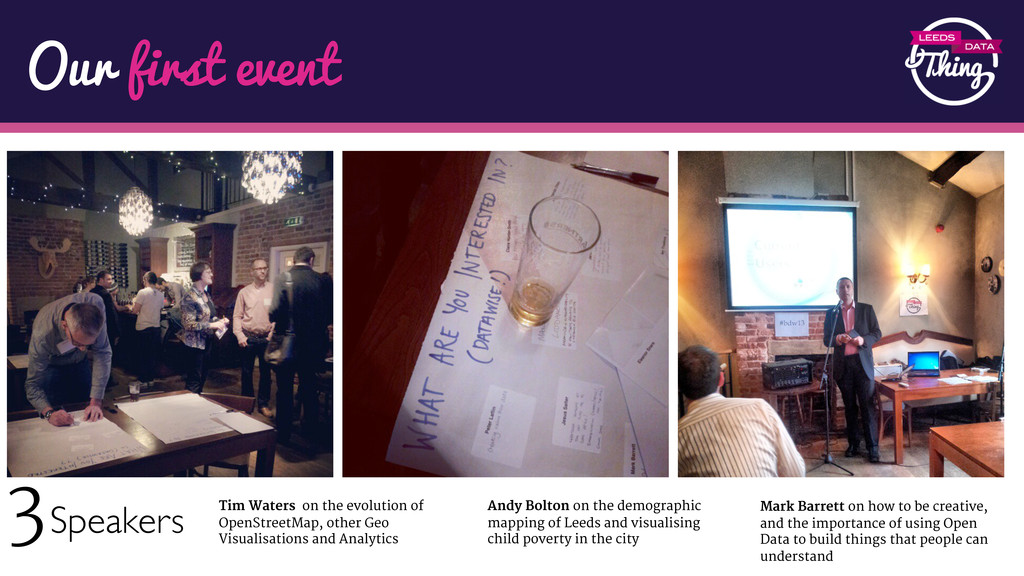
other Geo Visualisations and Analytics Andy Bolton on the demographic mapping of Leeds and visualising child poverty in the city Mark Barrett on how to be creative, and the importance of using Open Data to build things that people can understand Speakers 3
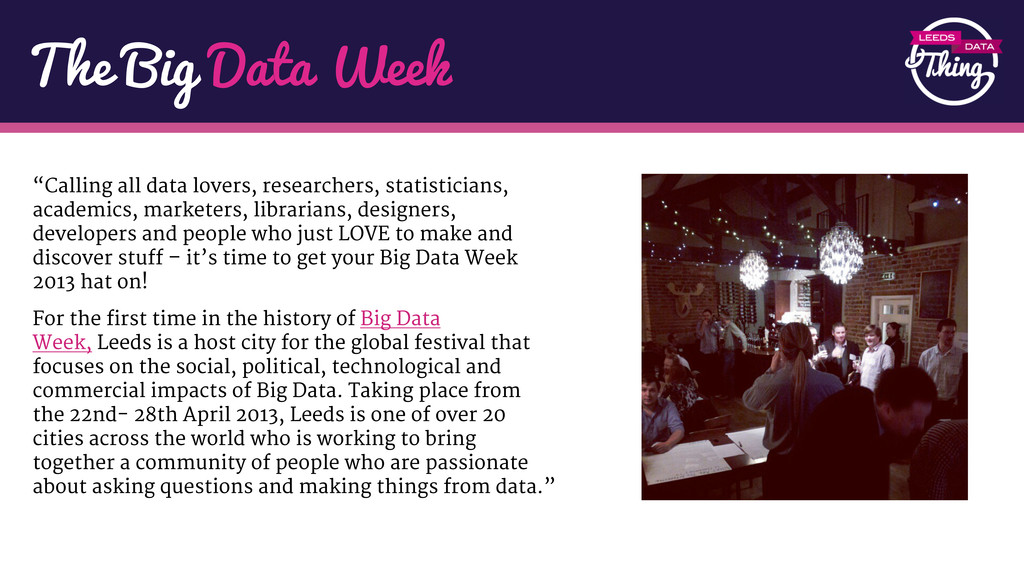
academics, marketers, librarians, designers, developers and people who just LOVE to make and discover stuff – it’s time to get your Big Data Week 2013 hat on! For the first time in the history of Big Data Week, Leeds is a host city for the global festival that focuses on the social, political, technological and commercial impacts of Big Data. Taking place from the 22nd- 28th April 2013, Leeds is one of over 20 cities across the world who is working to bring together a community of people who are passionate about asking questions and making things from data.”
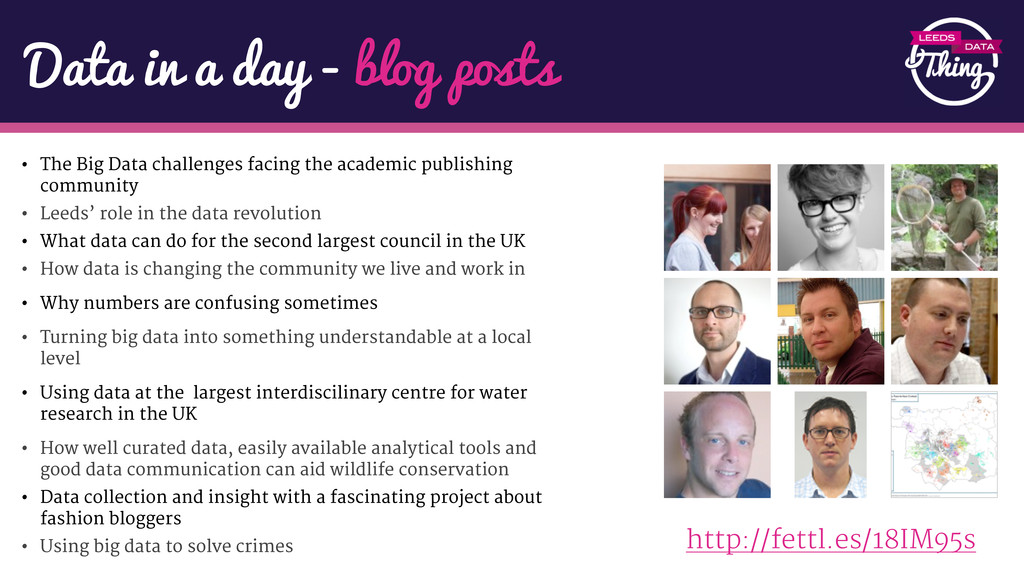
• Leeds’ role in the data revolution • What data can do for the second largest council in the UK • How data is changing the community we live and work in • Why numbers are confusing sometimes • Turning big data into something understandable at a local level • Using data at the largest interdiscilinary centre for water research in the UK • How well curated data, easily available analytical tools and good data communication can aid wildlife conservation • Data collection and insight with a fascinating project about fashion bloggers • Using big data to solve crimes Data in a day - blog posts http://fettl.es/18IM95s
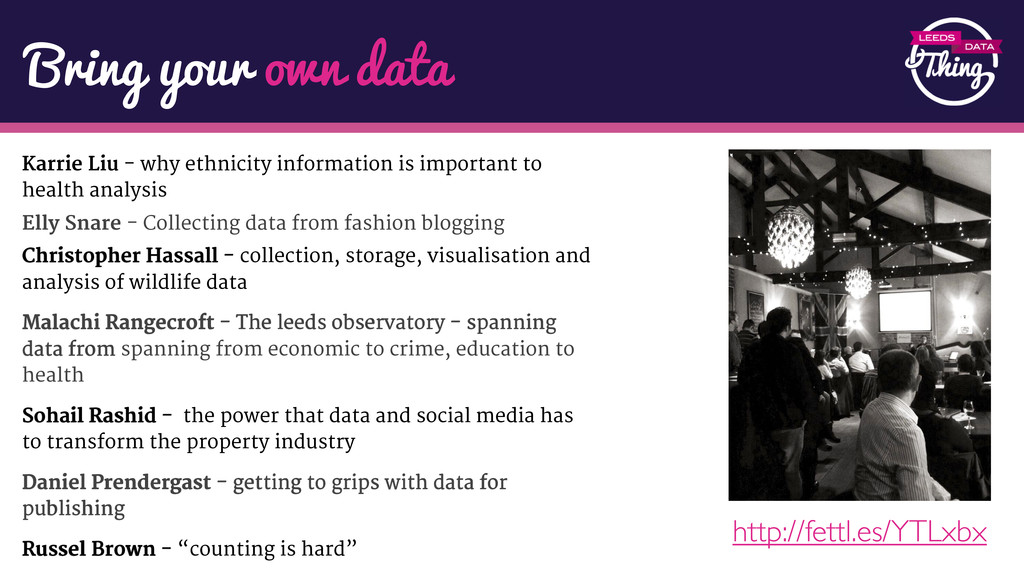
is important to health analysis Elly Snare - Collecting data from fashion blogging Christopher Hassall - collection, storage, visualisation and analysis of wildlife data Malachi Rangecroft - The leeds observatory - spanning data from spanning from economic to crime, education to health Sohail Rashid - the power that data and social media has to transform the property industry Daniel Prendergast - getting to grips with data for publishing Russel Brown - “counting is hard” http://fettl.es/YTLxbx
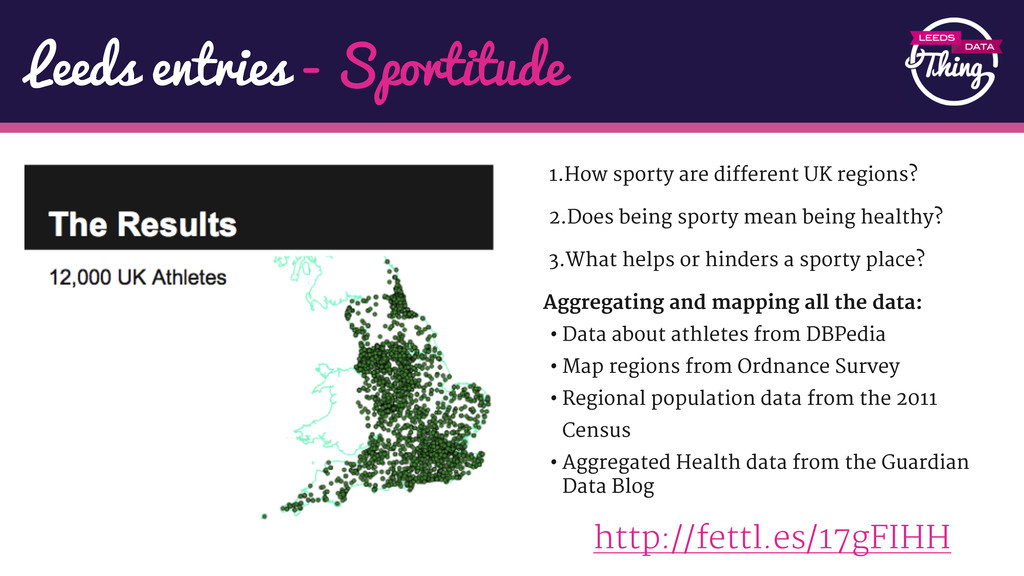
regions? 2.Does being sporty mean being healthy? 3.What helps or hinders a sporty place? Aggregating and mapping all the data: •Data about athletes from DBPedia •Map regions from Ordnance Survey •Regional population data from the 2011 Census •Aggregated Health data from the Guardian Data Blog
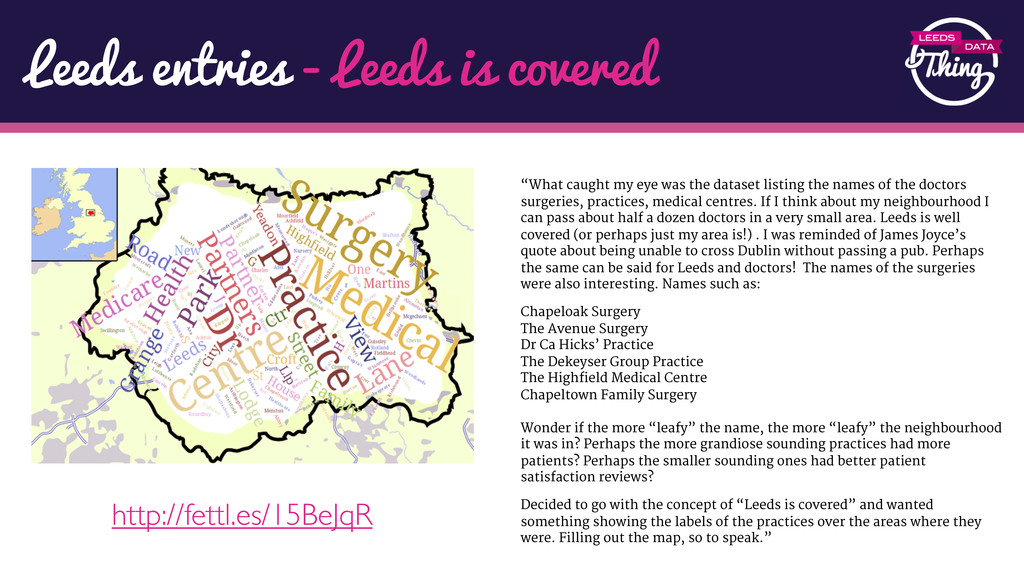
eye was the dataset listing the names of the doctors surgeries, practices, medical centres. If I think about my neighbourhood I can pass about half a dozen doctors in a very small area. Leeds is well covered (or perhaps just my area is!) . I was reminded of James Joyce’s quote about being unable to cross Dublin without passing a pub. Perhaps the same can be said for Leeds and doctors! The names of the surgeries were also interesting. Names such as: Chapeloak Surgery The Avenue Surgery Dr Ca Hicks’ Practice The Dekeyser Group Practice The Highfield Medical Centre Chapeltown Family Surgery Wonder if the more “leafy” the name, the more “leafy” the neighbourhood it was in? Perhaps the more grandiose sounding practices had more patients? Perhaps the smaller sounding ones had better patient satisfaction reviews? Decided to go with the concept of “Leeds is covered” and wanted something showing the labels of the practices over the areas where they were. Filling out the map, so to speak.”
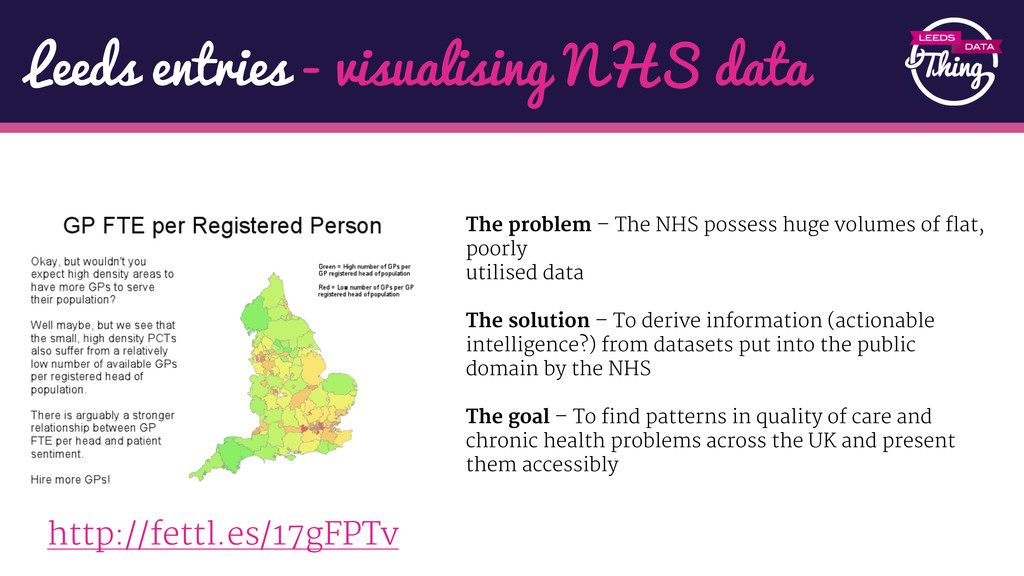
poorly utilised data The solution – To derive information (actionable intelligence?) from datasets put into the public domain by the NHS The goal – To find patterns in quality of care and chronic health problems across the UK and present them accessibly http://fettl.es/17gFPTv Leeds entries - visualising NHS data
'long life with high fertility?' •Longer lives, Birth control & War are seen in the Global data •> $500 per capita doesn't affect life expectancy •In Leeds, income drives health factors across its wards. •The NHSIC data tells us: Leeds was a bit glum 'yesterday' with less children & shorter lives. •Leeds Health hotspots by GP: Diabetes outliers
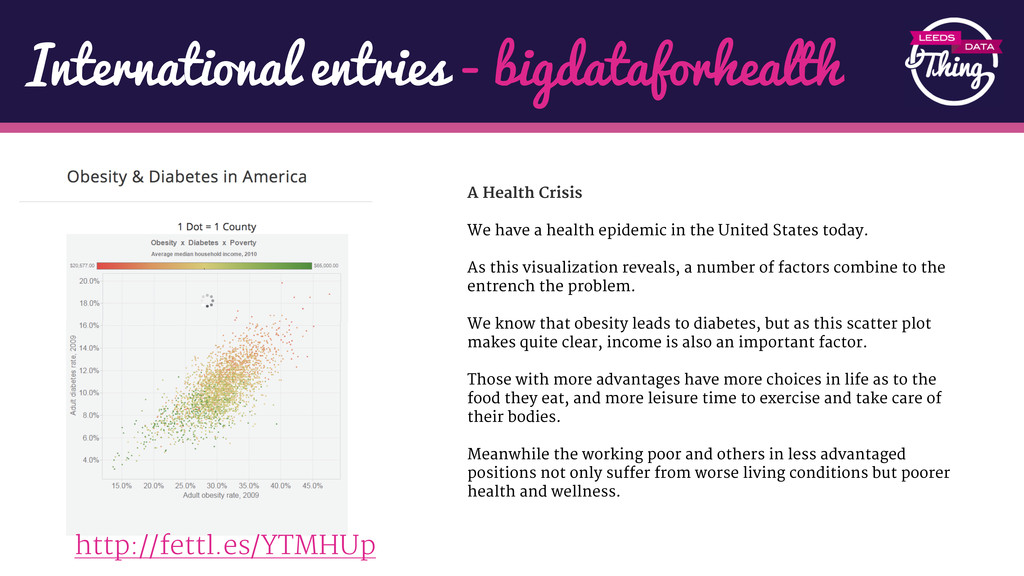
health epidemic in the United States today. As this visualization reveals, a number of factors combine to the entrench the problem. We know that obesity leads to diabetes, but as this scatter plot makes quite clear, income is also an important factor. Those with more advantages have more choices in life as to the food they eat, and more leisure time to exercise and take care of their bodies. Meanwhile the working poor and others in less advantaged positions not only suffer from worse living conditions but poorer health and wellness. http://fettl.es/YTMHUp
news articles of the years 2008 to 2013 were mined. 323,860,101 times were the german cities Berlin, Hamburg, Stuttgart, Dortmund, Frankfurt, and Leipzig mentioned in those articles. 376,595 disease-related words were found in the textual vicinity of those cities. For each city the three most significant disease related terms were analysed further. We manually selected catchwords that occurred frequently in the surroundings of the diseases. http://bdw.neofonie.de
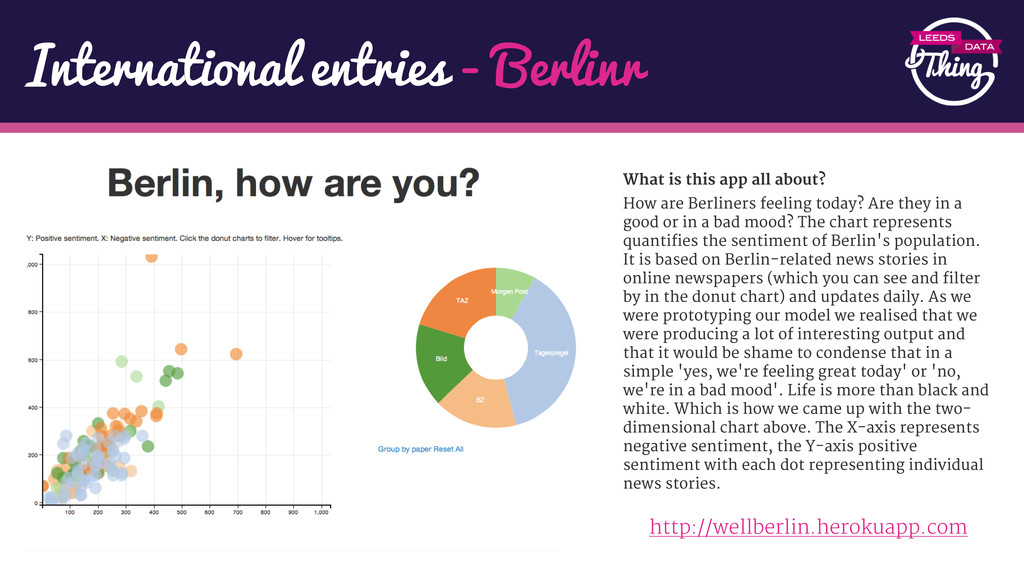
How are Berliners feeling today? Are they in a good or in a bad mood? The chart represents quantifies the sentiment of Berlin's population. It is based on Berlin-related news stories in online newspapers (which you can see and filter by in the donut chart) and updates daily. As we were prototyping our model we realised that we were producing a lot of interesting output and that it would be shame to condense that in a simple 'yes, we're feeling great today' or 'no, we're in a bad mood'. Life is more than black and white. Which is how we came up with the two- dimensional chart above. The X-axis represents negative sentiment, the Y-axis positive sentiment with each dot representing individual news stories. http://wellberlin.herokuapp.com
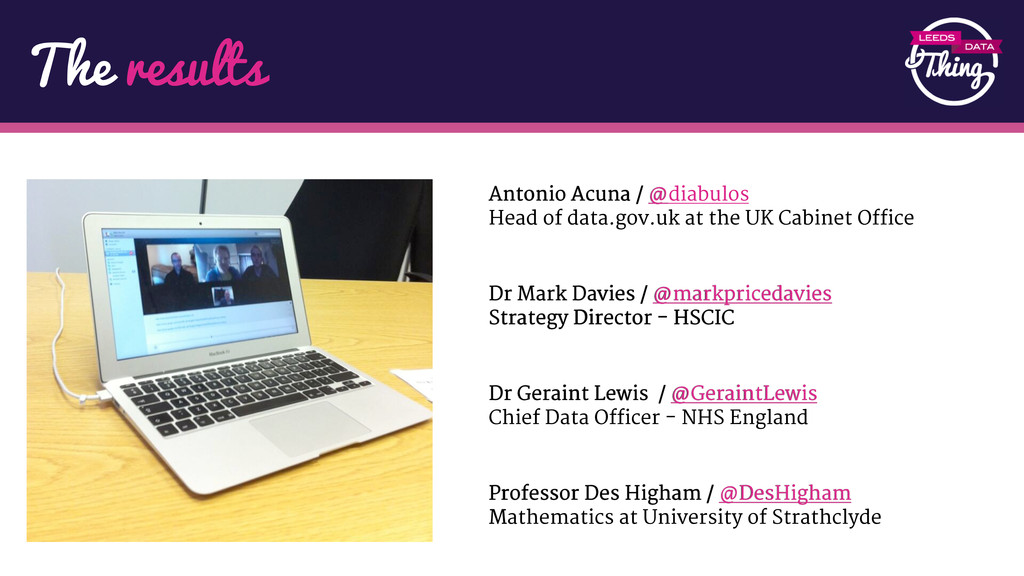
Cabinet Office Dr Mark Davies / @markpricedavies Strategy Director - HSCIC Dr Geraint Lewis / @GeraintLewis Chief Data Officer - NHS England Professor Des Higham / @DesHigham Mathematics at University of Strathclyde The results
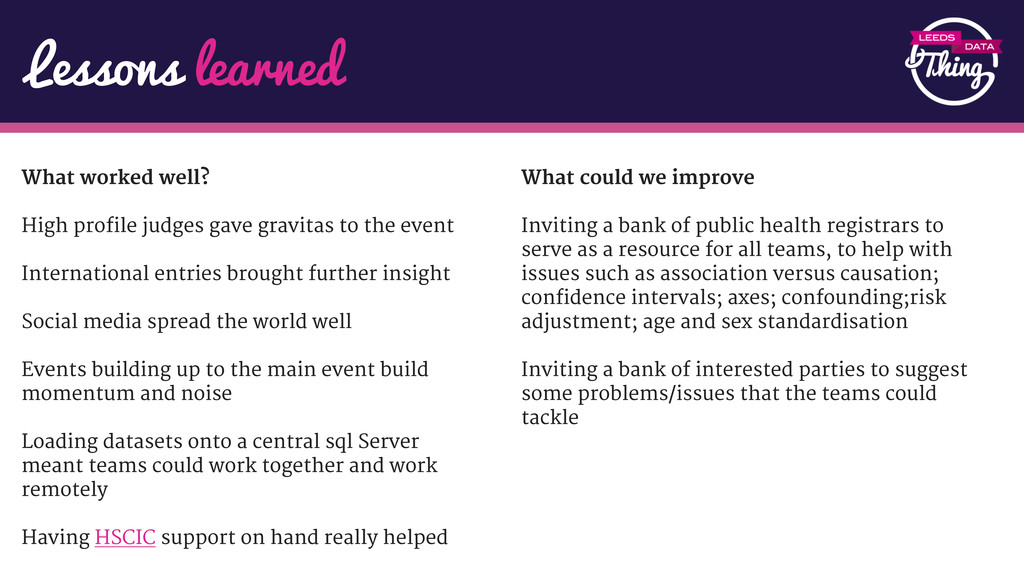
to the event International entries brought further insight Social media spread the world well Events building up to the main event build momentum and noise Loading datasets onto a central sql Server meant teams could work together and work remotely Having HSCIC support on hand really helped What could we improve Inviting a bank of public health registrars to serve as a resource for all teams, to help with issues such as association versus causation; confidence intervals; axes; confounding;risk adjustment; age and sex standardisation Inviting a bank of interested parties to suggest some problems/issues that the teams could tackle
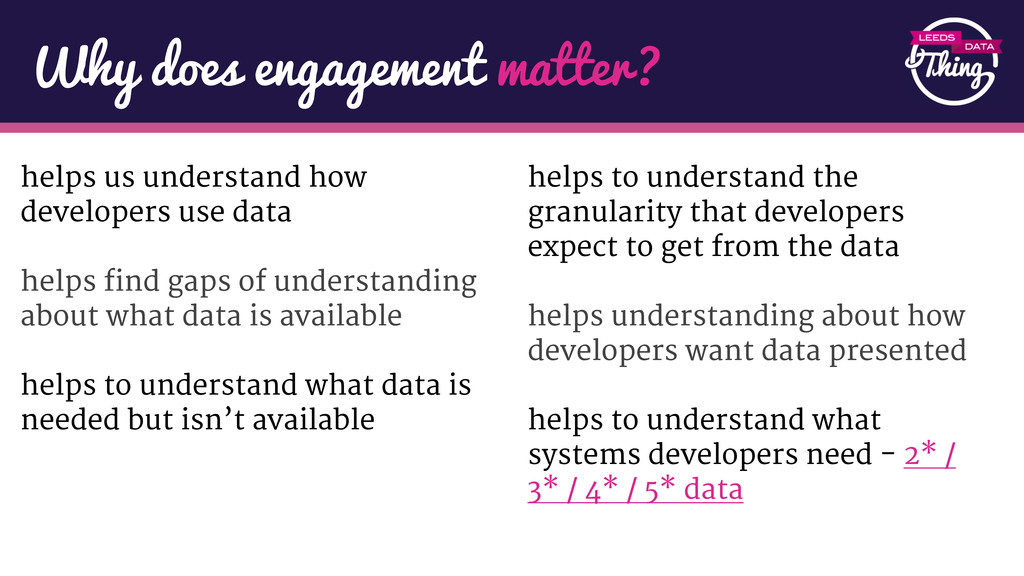
of understanding about what data is available helps to understand what data is needed but isn’t available helps to understand the granularity that developers expect to get from the data helps understanding about how developers want data presented helps to understand what systems developers need - 2* / 3* / 4* / 5* data Why does engagement matter?
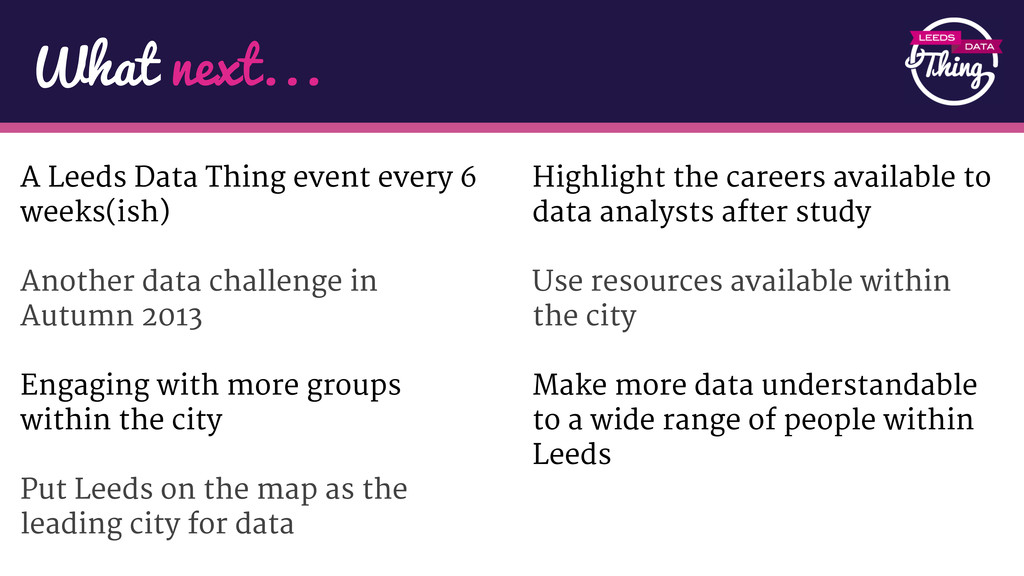
challenge in Autumn 2013 Engaging with more groups within the city Put Leeds on the map as the leading city for data Highlight the careers available to data analysts after study Use resources available within the city Make more data understandable to a wide range of people within Leeds What next...