Upgrade to Pro — share decks privately, control downloads, hide ads and more …

Measuring and Logging Everything in Real Time

Measuring and Logging Everything in Real Time

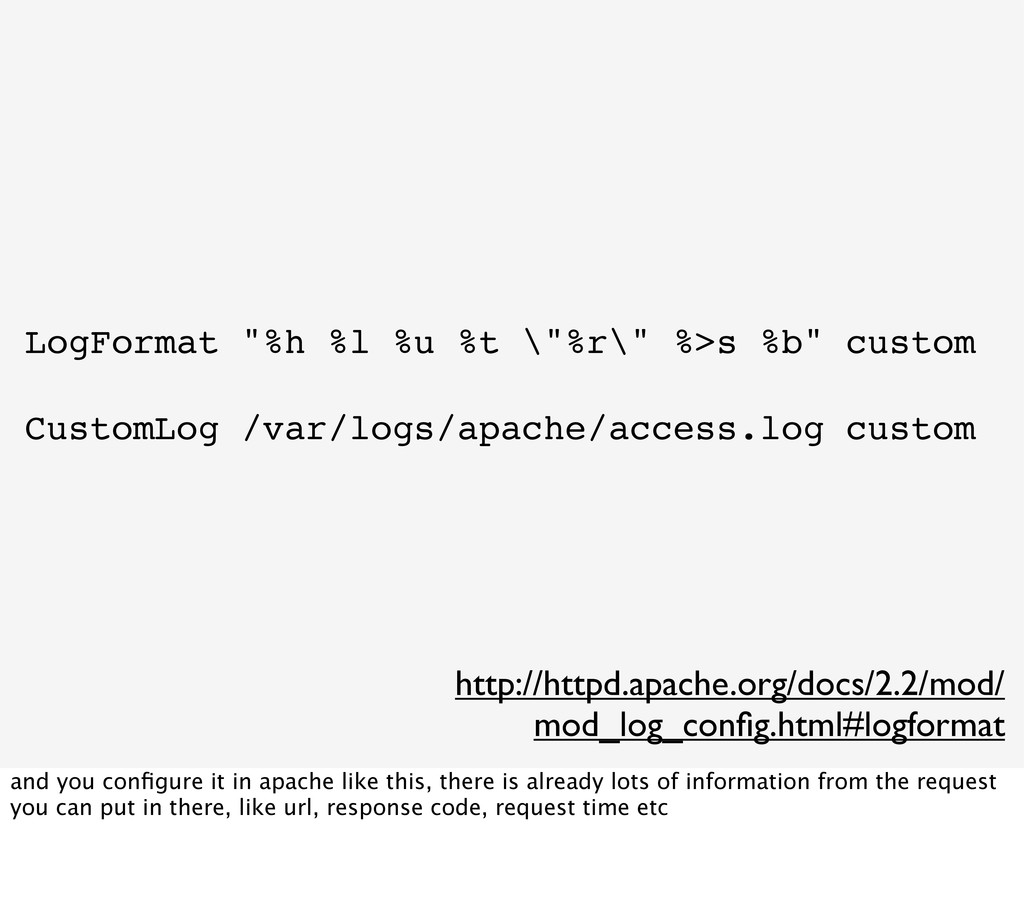
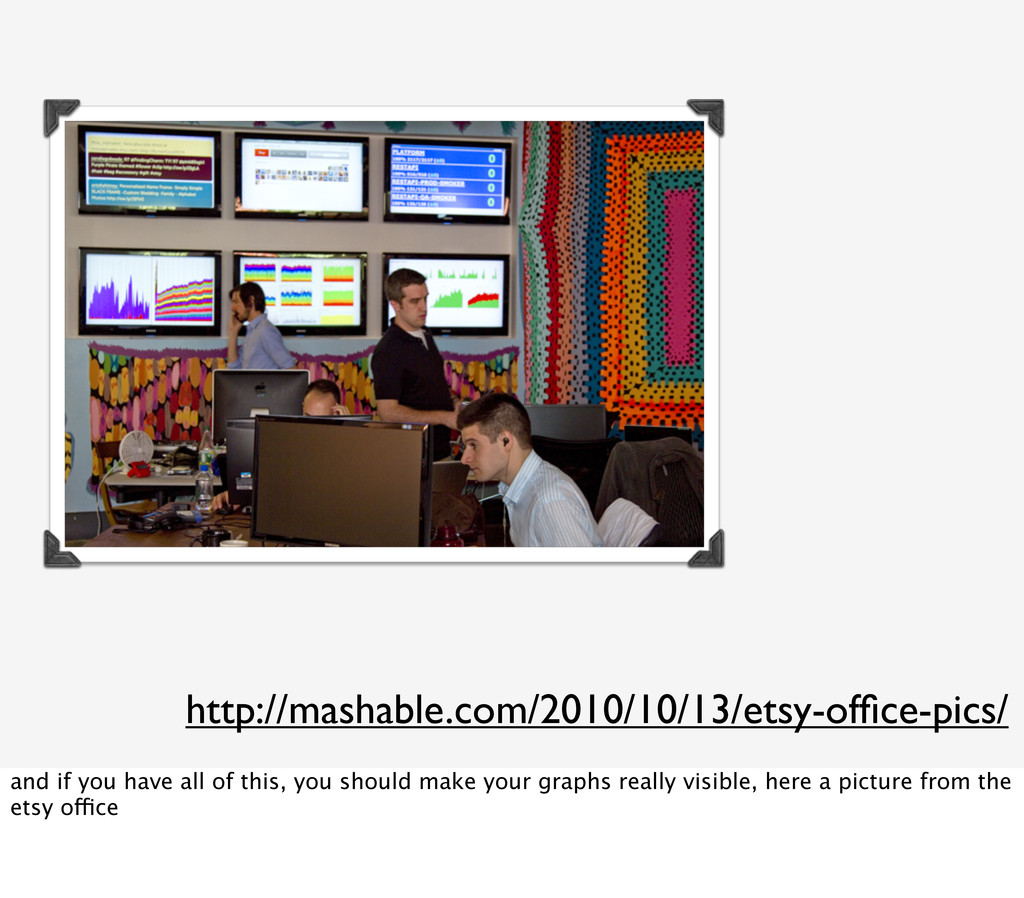
Do you know what is happening in your web application right now, this second, how many requests, logins, exceptions you have, how many and what data your users are generating and what the click through rate of each of your registration step is? Or do you know exactly which exception with which stack trace caused the error your users are seeing? If not, this talk will show how you can easily measure and log everything that happens in your application with the help of open source tools, such as Graphite, StatsD, Graylog2 and Logstash, without influencing your production environment.

Dutch PHP Conference 2013
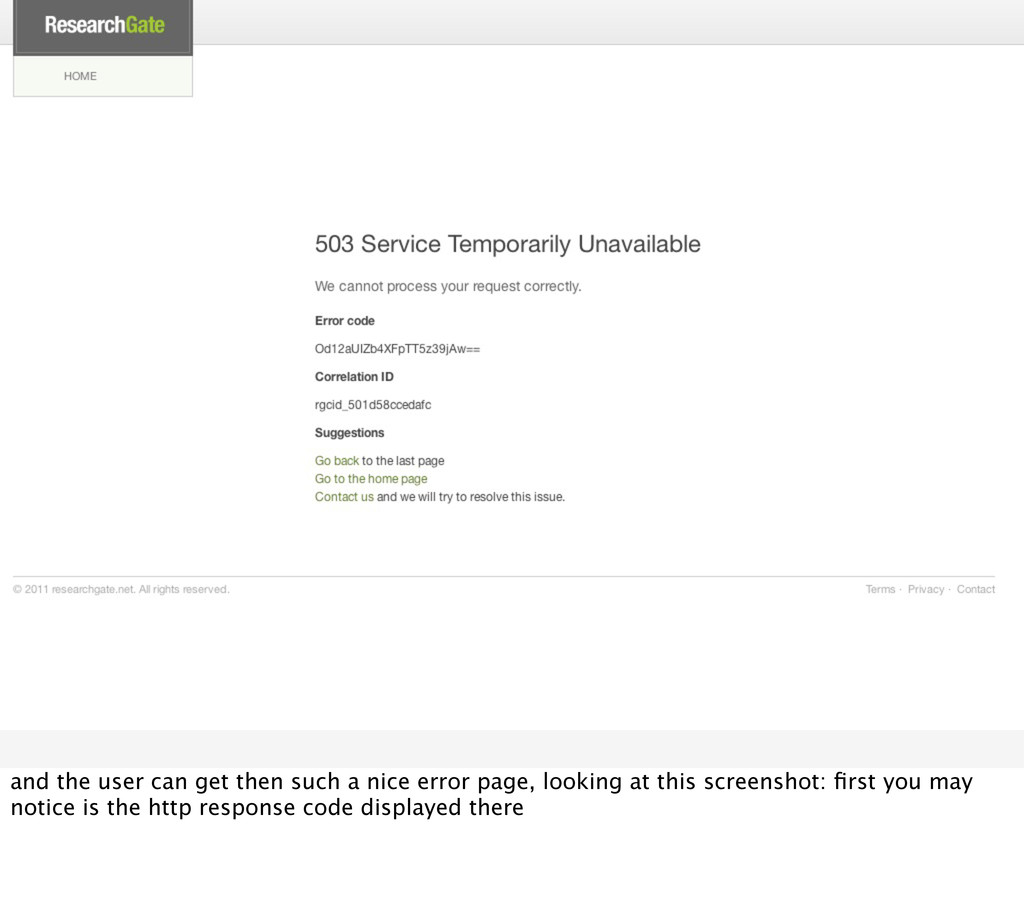
Bastian Hofmann

June 08, 2013
Tweet

More Decks by Bastian Hofmann

Other Decks in Programming

Transcript

  1. Measuring and Logging
    Everything in Real-Time
    @BastianHofmann
    As the title says in the next hour we are going to talk about two very important aspects of
    any web application that are often overlooked in the beginning:

    View Slide

  2. Logging
    1st is logging, so that you actually now, what's happening in your application if you have to
    track down an error

    View Slide

  3. Measuring
    And 2nd is measuring and monitoring constantly how your application is behaving

    View Slide

  4. Many roads
    Of course as with many things there are many roads to accomplish that and many tools
    available, that help you with it. i'll not going to show you all of them, but just what we ended
    up using at ResearchGate. They work great for us, but depending on your use cases other
    tools may be more suited to your needs. The important thing to get out of this talk: take care
    of it

    View Slide

  5. A few words
    about me
    before that ...

    View Slide

  6. i work at researchgate, the social network for scientists and researchers

    View Slide

  7. ResearchGate gives
    science back to the
    people who make it
    happen.
    We help researchers
    build reputation and
    accelerate scientific
    progress.
    On their terms.

    the goal is to give...

    View Slide

  8. over 2.9 million users

    View Slide

  9. here some impressions of the page

    View Slide

  10. View Slide

  11. http://gigaom.com/2013/06/05/heres-how-bill-gatess-
    researchgate-investment-might-change-the-world-for-the-
    better
    http://venturevillage.eu/researchgate

    View Slide

  12. have this, and also work on some cool stuff

    View Slide

  13. View Slide

  14. in addition to this i also speak frequently on conferences throughout the world

    View Slide

  15. work and live in berlin

    View Slide

  16. Questions? Ask
    by the way, if you have any questions throughout this talk, if you don't understand
    something, just raise your hand and ask. probably my fault anyways since i spoke to quickly
    or my accent was too bad

    View Slide

  17. Logging
    So 1st: Logging

    View Slide

  18. For when
    something goes
    wrong

    View Slide

  19. server
    error log
    access log
    debug logs
    slow query log
    ...
    Let's start with a simple setup: we have one server with an apache and some database on it.
    Of course all of these services are writing logs somewhere

    View Slide

  20. $ ssh my_simple_server
    getting at these is very simple, just ssh into the server

    View Slide

  21. $ tail -f error.log
    $ cat error.log | grep Exception
    and use your favorite unix command line tools to view the logs

    View Slide

  22. Error Logs
    Let's look at the application related logs a bit more closely, for example the ... as it says,
    Apache and PHP log all errors that happen in your application there

    View Slide

  23. ErrorLog /var/logs/apache/error.log
    The location is specified in your Apache configuration somewhere like this

    View Slide

  24. php.ini
    •error_reporting
    •display_errors
    •display_startup_errors
    •log_errors
    •error_log
    And there are some ini settings in PHP for configuring how errors should be handled, just
    read up on them in the documentation

    View Slide

  25. callable set_exception_handler(
    callable $exception_handler
    );
    Since you probably don't want to display an exception to the user (or a blank page) but a nice
    error page, you should set a custom exception handler in your application

    View Slide

  26. callable set_error_handler(
    callable $error_handler
    [, int $error_types = E_ALL |
    E_STRICT ]
    );
    and while you are at it, also set a custom error_handler, hey it's PHP

    View Slide

  27. bool error_log ( string $message [, int
    $message_type = 0 [, string $destination [, string
    $extra_headers ]]] )
    You can then log to the apache error log with the error_log function

    View Slide

  28. and the user can get then such a nice error page, looking at this screenshot: first you may
    notice is the http response code displayed there

    View Slide

  29. HTTP Response
    Codes
    http://www.w3.org/Protocols/rfc2616/rfc2616-
    sec6.html
    Please read up on it and choose correct ones for your application. helps you greatly with
    filtering the important stuff from the unimportant later on: a 503 may be much more serious
    then a 404

    View Slide

  30. on the screenshot here you also see some additional codes and ids displayed that help to
    identify the error in your system later on

    View Slide

  31. Log additional info
    of course you should not only display this information but also write it to your log files, you
    can easily do this in your custom error handler, and if you need to find the error that resulted
    in this error page you can just grep for the error code

    View Slide

  32. Not only error
    codes

    View Slide

  33. Request
    Information

    View Slide

  34. But what about
    fatal errors
    A bit earlier I said, you should actually write your own error handler to catch them show an
    error page and add custom information to the error logs, but what about fatal error, the php
    script is aborted then

    View Slide

  35. Use error_get_last()
    in a Shutdown
    Handler
    http://php.net/manual/en/function.error-
    get-last.php

    View Slide

  36. Access Logs
    Another important log is the access log, which logs each incoming request

    View Slide

  37. 192.168.56.1 - - [09/Jul/2012:19:18:19
    +0200] "GET /rg_trunk/webroot/c/af10c/
    images/template/rg_logo_default.png HTTP/
    1.1" 200 882 "http://devm/rg_trunk/webroot/
    directory/publications/"
    this is what it usually looks like

    View Slide

  38. LogFormat "%h %l %u %t \"%r\" %>s %b" custom
    CustomLog /var/logs/apache/access.log custom
    http://httpd.apache.org/docs/2.2/mod/
    mod_log_config.html#logformat
    and you configure it in apache like this, there is already lots of information from the request
    you can put in there, like url, response code, request time etc

    View Slide

  39. http://de.php.net/apache_note
    string apache_note (
    string $note_name
    [, string $note_value = "" ]
    )
    but with the apache_note function you can add additional information from your application.
    by the way this is of course also possible with nginx, there you just set some response
    headers in php, in nginx you can then access these upstream headers, log them, and then
    filter them out so the clients don't get them

    View Slide

  40. LogFormat "...\"%{referer}i\" \"%{user-
    agent}i\" %{session_id}n %{account_id}n..."
    custom
    but back to apache: these notes then can be referenced in your log format like this

    View Slide

  41. Debug Logs
    next log type that your application can write are plain debug logs that are not related to
    errors

    View Slide

  42. https://github.com/Seldaek/monolog/
    a good library recommendation for doing this instead of writing to a file manually is monolog

    View Slide

  43. use Monolog\Logger;
    use Monolog\Handler\StreamHandler;
    // create a log channel
    $log = new Logger('name');
    $log->pushHandler(
    new StreamHandler(
    'path/to/your.log', Logger::WARNING
    )
    );
    // add records to the log
    $log->addWarning('Foo');
    $log->addError('Bar');

    View Slide

  44. Handlers
    •Stream
    •Mail
    •FirePHP
    •ChromePHP
    •Socket
    •Roating File
    •MongoDB
    •Syslog
    •Gelf
    •Null
    •Test
    •FingersCrossed
    nice thing is: it supports multiple handlers out of the box, to log wherever you need it,
    especially useful: the fingers crossed handler: you just put your logs in this handler but it
    does not log them directly to a file, only when a certain condition was met, like a threshold all
    already written logs and all further logs are written to a file

    View Slide

  45. Log in a structured
    way
    one thing that can help you greatly with managing huge amount of logs with lot's of different
    additional information in it is logging in a structured way (not only for debug but also for
    error logs)

    View Slide

  46. JSON
    http://www.ietf.org/rfc/rfc4627.txt
    in my opinion a good format is json, since it is still human readable

    View Slide

  47. use Monolog\Logger;
    use Monolog\Handler\StreamHandler;
    use Monolog\Formatter\JsonFormatter;
    $log = new Logger('name');
    $handler = new StreamHandler(
    'path/to/your.log', Logger::WARNING
    );
    $handler->setFormatter(new JsonFormatter());
    $log->pushHandler($handler);
    in monolog you can just set a formatter for this

    View Slide

  48. Logs from other
    services
    but of course your application probably is a bit more complex, soa anyone? so you have also
    other services somewhere logging something

    View Slide

  49. web server http service
    http service
    http service
    http service
    user request
    log
    log
    log
    log
    log
    the setup may look like this, a request comes to a webserver and your php application on
    there calls other services. each of them have their own logs. for example the http service
    there. now if an error happens in the http service we are probably going to display an error as
    well in our php app. but how can we identify then which exception on the http service lead to
    the displayed error on the web server?

    View Slide

  50. Correlation /
    Tracing ID
    a nice way of doing this in a generlized, non-custom way is by using a common correlation
    or tracing id

    View Slide

  51. web server http service
    http service
    http service
    http service
    create
    unique
    trace_id for
    request
    user request
    trace_id
    trace_id
    trace_id
    trace_id
    log
    log
    log
    log
    log
    so when the user request first hits your system you generate a unique trace_id for this
    request and you then pass this to all underlying services through an http header.

    View Slide

  52. X-Trace-Id: bbr8ehb984tbab894

    View Slide

  53. web server http service
    http service
    http service
    http service
    create
    unique
    trace_id for
    request
    user request
    trace_id
    trace_id
    trace_id
    trace_id
    log
    log
    log
    log
    log
    everyone then puts these tracing id in every logs they write. so if you have a tracing id you
    can easily find all logs for this request by just greping for the trace_id

    View Slide

  54. but... usually your application does not look like this

    View Slide

  55. but more like this: you have multiple servers lying around

    View Slide

  56. which means ssh-ing into all of these servers (dsh...) and then grepping for information over
    multiple logs (access log, error log, debug logs, ...) can become quite tedious and time
    consuming

    View Slide

  57. Aggregate the logs
    in a central place
    so to make it easier: work on a central log management and ...

    View Slide

  58. Make them easily
    full-text searchable
    also ...

    View Slide

  59. Make them
    aggregate-able
    and make different kind of logs aggregateable

    View Slide

  60. Always Log to file
    but whatever you do and whatever we are going to talk about...

    View Slide

  61. Seriously...

    View Slide

  62. Always Log to file
    because this is your backup when your central log management solution will fail (network
    errors, etc). and i'll guarantee you, it will fail sometime, probably at the worst moment

    View Slide

  63. Directly to a
    database
    first naive approach to central log management is to log directly from you application to a
    database (you saw the mongoDbHandler from Monolog)

    View Slide

  64. webserver webserver webserver
    DB
    setup would look like this: everything in one place, easily searchable, great, finished

    View Slide

  65. Disadvantages
    not quite, it has some disadvantages

    View Slide

  66. Database is down?
    what happens if

    View Slide

  67. Database is slow?

    View Slide

  68. Database is full?

    View Slide

  69. How to integrate
    access logs?

    View Slide

  70. Influences
    application
    performance
    because of all the database queries you are doing, and chances are if there are problems on
    your platform and multiple errors are occurring, directly writing to a database will make your
    problems worse

    View Slide

  71. Frontend?
    also there is still no frontend to easily search and monitor exceptions, of course there are sql
    clients, phpmyadmin, rockmongo etc, but they are multi purpose tools and not really made
    for displaying and filtering logs

    View Slide

  72. Better solutions?
    are there ...

    View Slide

  73. graylog2
    http://graylog2.org/
    on tool that I quite like for this is called graylog2

    View Slide

  74. Full text search
    it comes out of the box with a very nice interface to do...

    View Slide

  75. Structured
    Messages
    in ...

    View Slide

  76. Metrics & Alarms
    and offers metrics, alarms on your logs

    View Slide

  77. that's what the interface looks like, you'll see this in action in a minute

    View Slide

  78. https://github.com/bashofmann/
    vm_graylog2_amqp_logstash_apache

    View Slide

  79. Graylog2
    UDP GELF Messages
    elasticsearch
    webserver webserver webserver
    the easiest approach is to just send the messages in a special format (gelf, supported by a
    monolog handler) with a upd request from your app servers to graylog which stores them in
    elasticsearch. udp is quite nice since it is fire and forget, so it does not influence our
    application too much (if you reuse connections and don't create a new one for each log)

    View Slide

  80. {
    "version": "1.0",
    "host": "www1",
    "short_message": "Short message",
    "full_message": "Backtrace here\n
    \nmore stuff",
    "timestamp": 1291899928.412,
    "level": 1,
    "facility": "payment-backend",
    "file": "/var/www/somefile.rb",
    "line": 356,
    "_user_id": 42,
    "_something_else": "foo"
    }
    a typical graylog gelf message looks like this, some default fields, and user specific fields
    prepended with an underscore

    View Slide

  81. Disadvantages
    but ...

    View Slide

  82. Graylog/
    elasticsearch is
    down?
    still if graylog/es is down you are using logs

    View Slide

  83. Graylog/
    elasticsearch is full?

    View Slide

  84. Packet loss
    udp has the disadvantage that because of network errors your logs possibly don't arrive

    View Slide

  85. Graylog2
    elasticsearch
    webserver webserver webserver
    AMQP
    GELF GELF
    GELF
    GELF
    better approach, put a queue in between, also good for load balancing

    View Slide

  86. Don't influence your
    application by
    logging
    but still if you push something in a queue you are still influencing your production system
    unnecessarily

    View Slide

  87. Always Log to file
    and remember you should log to file anyways

    View Slide

  88. logstash
    http://logstash.net/
    enter the next tool we are using, logstash is a very powerful tool to handle log processing

    View Slide

  89. input filter output
    basic workflow is that you have some input where logstash gets log messages in, on this
    input you can execute multiple filters that modify the message and then you can output the
    filtered message somewhere

    View Slide

  90. Very rich plugin
    system
    to do this it offers a very large and rich plugin system for all kinds of inputs, filters and
    outputs, and you can also write your own

    View Slide

  91. Graylog2
    elasticsearch
    webserver webserver webserver
    AMQP
    log log log
    logstash logstash logstash
    so our setup would look like this, logstash instances on each app server take the local log
    files, parse and filter them and send them to the queue

    View Slide

  92. input {
    file {
    type => "error"
    path =>
    [ "/var/logs/php/*.log" ]
    add_field =>
    [ "severity", "error" ]
    }
    file {
    type => "access"
    path =>
    [ "/var/logs/apache/*_access.log" ]
    add_field =>
    [ "severity", "info" ]
    }
    }
    input configuration

    View Slide

  93. filter{
    grok {
    match => ["@source",
    "\/%{USERNAME:facility}\.log$"]
    }
    grok {
    type => "access"
    pattern => "^%{IP:OriginalIp}
    \s[a-zA-Z0-9_-]+\s[a-zA-Z0-9_-]+\s\[.*?
    \]\s\"%{DATA:Request}..."
    }
    }
    filter configuration

    View Slide

  94. output {
    amqp {
    host => "amqp.host"
    exchange_type => "fanout"
    name => "logs"
    }
    }
    output configuration

    View Slide

  95. Measuring
    now that you have all the log messages in a central, searchable, aggregateable place: lets go
    to measuring

    View Slide

  96. For knowing what
    happens
    so that you know what actually happens in your application and in your system

    View Slide

  97. Technical Metrics
    and with that i mean technical metrics like load on your servers, available memory, requests,
    exceptions, response times (a bit more on that later)

    View Slide

  98. Business Metrics
    but also and probably even more important, business metrics

    View Slide

  99. Define your KPIs
    or so called key performance indicators, example: signups, profile views, messages, uploaded
    images, average volume per sale, ... it really depends on your application

    View Slide

  100. Graphite
    http://graphite.wikidot.com/
    again there are many tools available to collect and display these metrics: one i want to
    highlight is graphite

    View Slide

  101. webserver webserver webserver
    graphite
    UDP
    easiest way to use it is just sending udp requests with the metric you want to count to
    graphite, but if you're collection and measuring lots of stuff this could put quite a high load
    on graphite

    View Slide

  102. StatsD
    https://github.com/etsy/statsd/
    etsy wrote a great small tool called statsd to help you with that

    View Slide

  103. webserver webserver webserver
    graphite
    UDP statsd
    you can just hook it in between your servers and graphite as a small load balancing daemon.
    it receives all messages, aggregates them and then flushes them in a certain interval, like
    very 10 seconds to graphite

    View Slide

  104. webserver webserver webserver
    statsd statsd
    statsd
    graphite
    aggregated
    UPD message
    of course you also can run one statsd on every webserver, so that your statsd gets not
    overloaded

    View Slide

  105. webserver webserver webserver
    statsd statsd
    statsd
    graphite
    aggregated
    UPD message
    statsd
    and you even can arrange different statsd in a row

    View Slide

  106. Metric?
    what is a metric: three different types

    View Slide

  107. Counters
    counters (how often did something happen)

    View Slide

  108. Timers
    timer (how long did something take)

    View Slide

  109. Gauges
    gauges (collect arbitrary values (amount of a sale)

    View Slide

  110. graphite comes with a powerful interface where you can plot and aggregate this data into
    graphs and perform different mathematical functions on it to get it exactly the way you want
    to display your data

    View Slide

  111. https://metrics.librato.com/
    and if you don't want to be bothered with setting graphite up, you can also use hosted
    solutions like librato (statsd comes with different backends to push data to)

    View Slide

  112. http://mashable.com/2010/10/13/etsy-office-pics/
    and if you have all of this, you should make your graphs really visible, here a picture from the
    etsy office

    View Slide

  113. Remember:
    Response Times
    last but not least:

    View Slide

  114. Easiest approach:
    Get it out of the
    access log

    View Slide

  115. 192.168.56.1 - - [09/Jul/2012:19:18:19
    +0200] "GET /rg_trunk/webroot/c/af10c/
    images/template/rg_logo_default.png HTTP/
    1.1" 200 882 "http://devm/rg_trunk/webroot/
    directory/publications/"
    this is what it usually looks like

    View Slide

  116. Is this actually what
    we want to
    measure?
    Is this really the response time the user sees?

    View Slide

  117. External Resources
    CSS
    JavaScript
    Images
    Slow connections
    Slow
    Browsers
    SSL Handshakes
    DNS resolving
    so for the users the actual response time is actually when all this finished loading

    View Slide

  118. That is what we
    want to measure!

    View Slide

  119. https://github.com/lognormal/boomerang

    View Slide

  120. browser
    JS: boomerang
    logstash
    trackingServer
    access log
    requests
    tracking image
    with timing
    information as
    query
    parameters
    graphite
    statsd
    boomerang collects from various sources load times of the current page (e.g.
    window.performance api), and with them requests a tracking image from a tracking server
    you specify (should be on another domain, so that you don't send unnecessary cookies
    there). on this tracking server a logstash can parse the access logs and then send the
    collected timers via statsd to graphite

    View Slide

  121. http://twitter.com/BastianHofmann
    http://profiles.google.com/bashofmann
    http://lanyrd.com/people/BastianHofmann
    http://speakerdeck.com/u/bastianhofmann
    https://github.com/bashofmann
    https://www.researchgate.net/profile/Bastian_Hofmann/
    [email protected]
    thanks, you can contact me on any of these platforms or via mail. please go to joind.in and
    rate the talks you have seen

    View Slide