Upgrade to Pro — share decks privately, control downloads, hide ads and more …

2013 CEEB Workshop 2: Your research in figures

2013 CEEB Workshop 2: Your research in figures

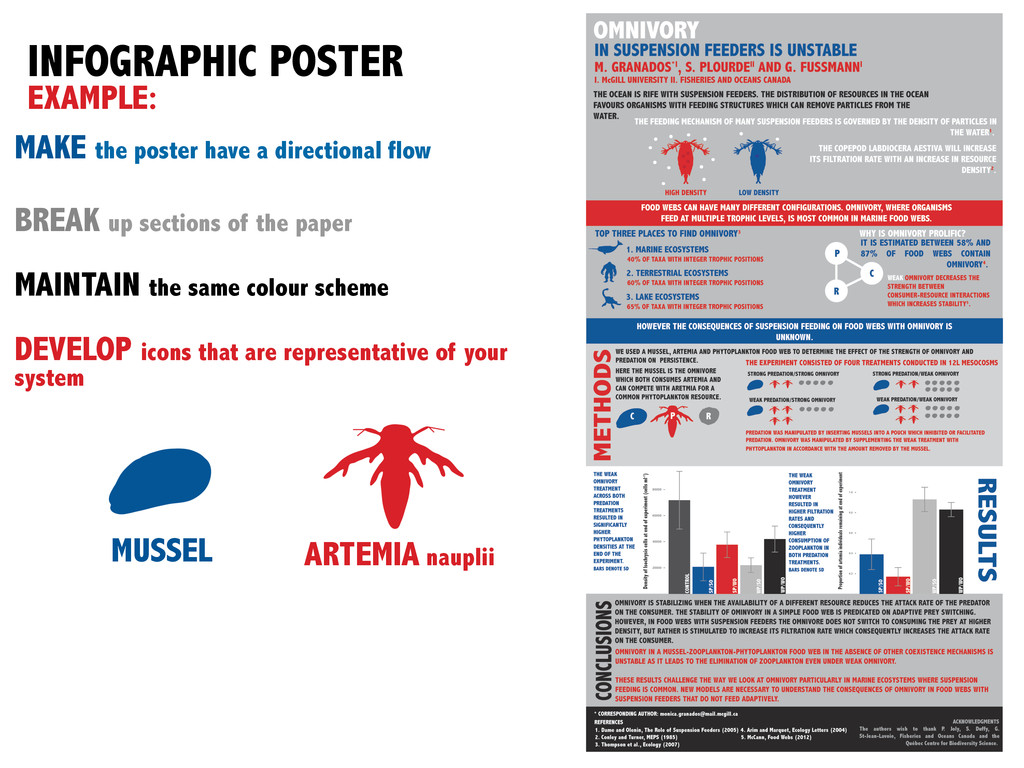
Workshop delivered by Monica Granados at the 2013 CEEB retreat on representing your introduction, methods and results as figures for presentations and posters.

More Decks by Biology Graduate Students Association

Other Decks in Science

Transcript

  1. INFOGRAPHICS ARE VISUAL REPRESENTATIONS OF DATA YOU can represent quantitative

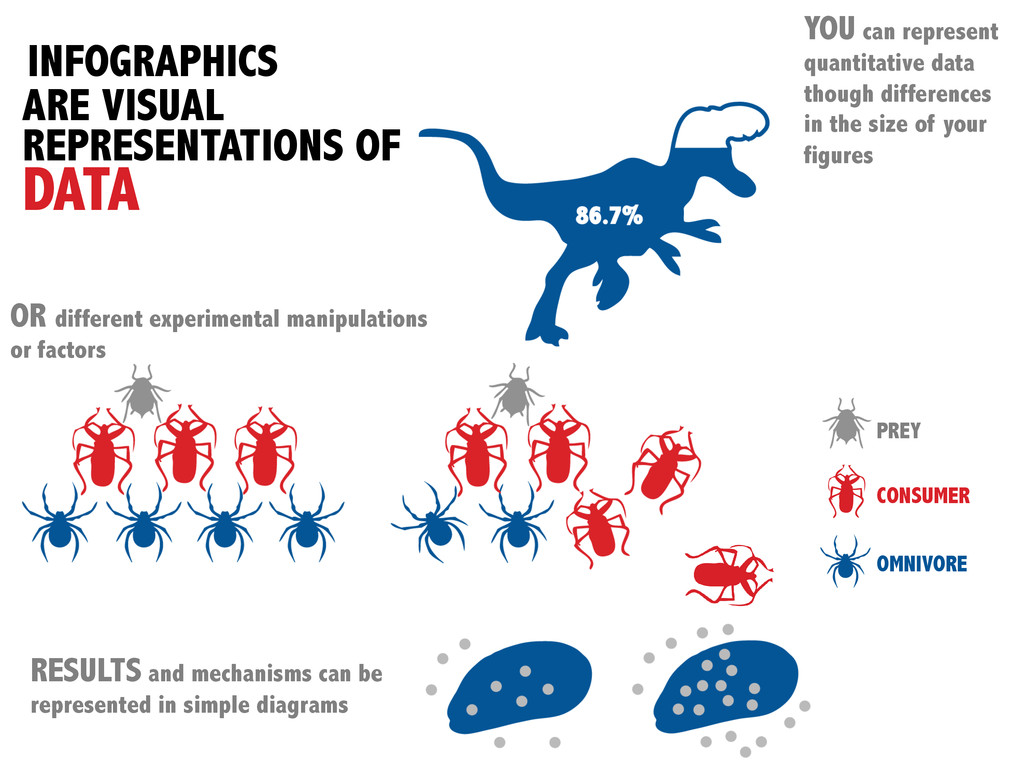
    data though differences in the size of your figures CONSUMER OMNIVORE PREY OR different experimental manipulations or factors RESULTS and mechanisms can be represented in simple diagrams
  2. INFOGRAPHIC POSTER EXAMPLE: MAKE the poster have a directional flow

    BREAK up sections of the paper MAINTAIN the same colour scheme DEVELOP icons that are representative of your system MUSSEL ARTEMIA nauplii
  3. ADDITIONAL RESOURCES WWW.COOLINFOGRAPHICS.COM WWW.VISUAL.LY BLOG that amalgamates some of the

    best infographics produced RESOURCE and toolkits for the production of infographics